The Cluster Manager provides a variety of reports. These reports provide many types of analytics about your build cluster and use several types of data visualization, such as scatter plots and pie charts.Typically, the reports access the uploaded annotation file to present analysis of various aspects of the build. You can create custom reports as well.
Generating Reports
-
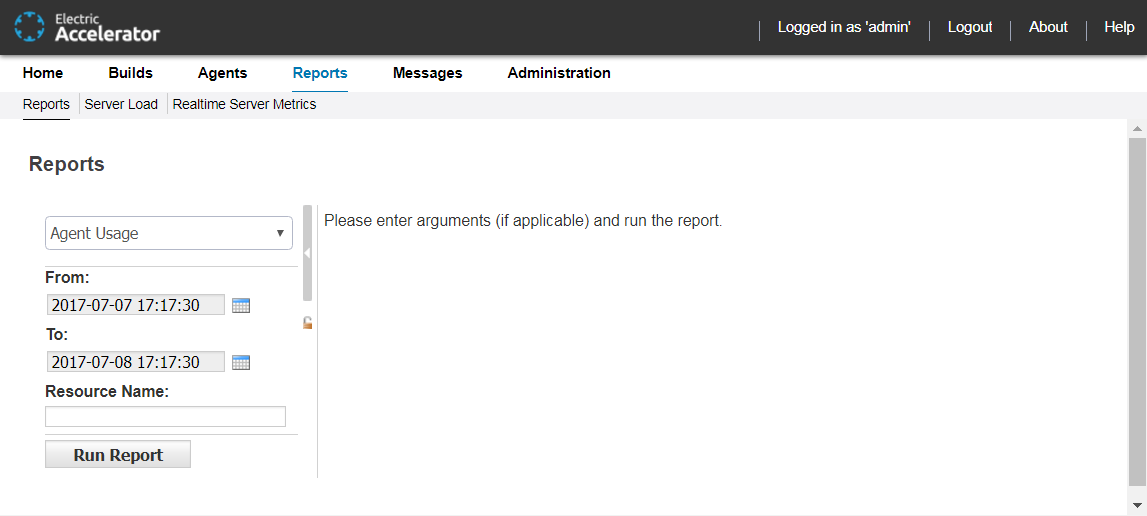
Click the Reports > Reports subtab.
-
From the drop-down menu, choose the report that you want to generate.
-
Click the From field and choose the report start date from the calendar that appears.
-
Click the To field and choose the report end date from the calendar that appears.
-
(Optional) Complete any additional fields to customize the report.
-
(Optional) Customize the Ranges field.
If available, the Ranges field lets you customize which ranges that the report displays. Use this format for the Ranges field: rangename ,[ beginning of range , end of range ), rangename ,[ beginning of range , end of range ), and so on. [ or ] brackets denote that the number is inclusive. ( or ) brackets denote that the number is exclusive.
See Reports for more information.
-
Click Run Report to generate the report.
Adding Custom Reports
You can add custom reports to the Build Details page. Typically, the reports access the uploaded annotation file to present analysis of various aspects of the build. You must write a script/application that takes three arguments and produces an HTML/text output file.
The arguments are (in this order):
-
Script name (the base name of the script)
-
Cluster Manager build ID
-
Directory where the annotation file is located. The filename with annotation is always
build.xml. This is where the script writes its output files.
Generally, the script reads the build.xml file and creates a number of files. The first file it must create is the temporary HTML file. That file is named after the provided script name, followed by .html_tmp. This is where the HTML output is created. After the file is done, it is moved under the script name followed by .html.
If the file produces downloadable output (such as plain text), it produces a file named after the script name followed by .out_tmp (the temporary file where the file is created). After the file is created, it is moved under the script name followed by .out.
It is important that the script is well-behaved if failure occurs (for example broken XML). In this case, it must remove the temporary files so the Cluster Manager does not continue to show the Generating… state. Electric Cloud recommends generating an HTML output file (following the naming scheme above) that states the error, so users can learn of a failure.
Recommendation: Start generated output with a table element, which then may contain whatever is desired. To pick up common stylesheet settings, make the table and its cells of the mainWindow class.
Making Custom Reports Available to the Cluster Manager
To make the report available:
-
Install the script/application in the
<ECloud install>/<arch>/bindirectory. -
Run the application
ecaddcmreportwith the following arguments (in this order): -
shortname (the name used internally to identify the report)
-
label (the text to display in the UI to represent the report)
-
commandline (the full path to the executable)
-
wait flag (1 means the UI stalls the request to wait for the result file and 0 means the request returns immediately)