The CloudBees User Activity Monitoring plugin helps you understand licensing and entitlement by providing you with a dashboard summary of recent user activity and Comma-Separated Values (CSV) exports of user access details. You can track user activity for a standalone controller or use the operations center to aggregate user information for all connected controllers.
| This plugin is not intended to provide an authoritative, precise measure of the number of users. It is intended to provide a reasonable approximation of user activity for discussion with your CloudBees account team. If you require a more robust licensing management solution, CloudBees CI license usage is available for CloudBees Software Delivery Automation and provides continuous monitoring to maintain a many-to-one mapping of email addresses for a given user, a visual representation of CloudBees CI licenses and their active users, and an API to create custom license usage reports. For more information about CloudBees Software Delivery Automation, contact your CloudBees sales representative. |
The configuration and functionality of the User Activity Monitoring dashboard varies based on the version of the plugin you are using:
CloudBees User Activity Monitoring plugin version 1.3 and later
The following information is specific to the CloudBees User Activity Monitoring plugin, version 1.3 and later.
Accessing the User Activity dashboard
The User Activity dashboard summarizes user activity with a data retention policy of 40 months.
| If a user has a different username and email address for your identity provider and for your SCM, separate local users are created and the plugin does not attempt to merge the duplicate entries. |
To access the User Activity dashboard:
-
Ensure you are signed in to a controller or the operations center with Administer permissions.
-
From the dashboard, select Manage Jenkins in the left pane.
-
Select User Activity. The User Activity dashboard displays.
From the User Activity dashboard, you can:
-
View the 50 most recent user activity entries.
-
Optionally, specify a number of days or months and select Refresh to filter user activity.
-
Select Download Report to download a report containing all user activity for the past 40 months. The report is a CSV file and named
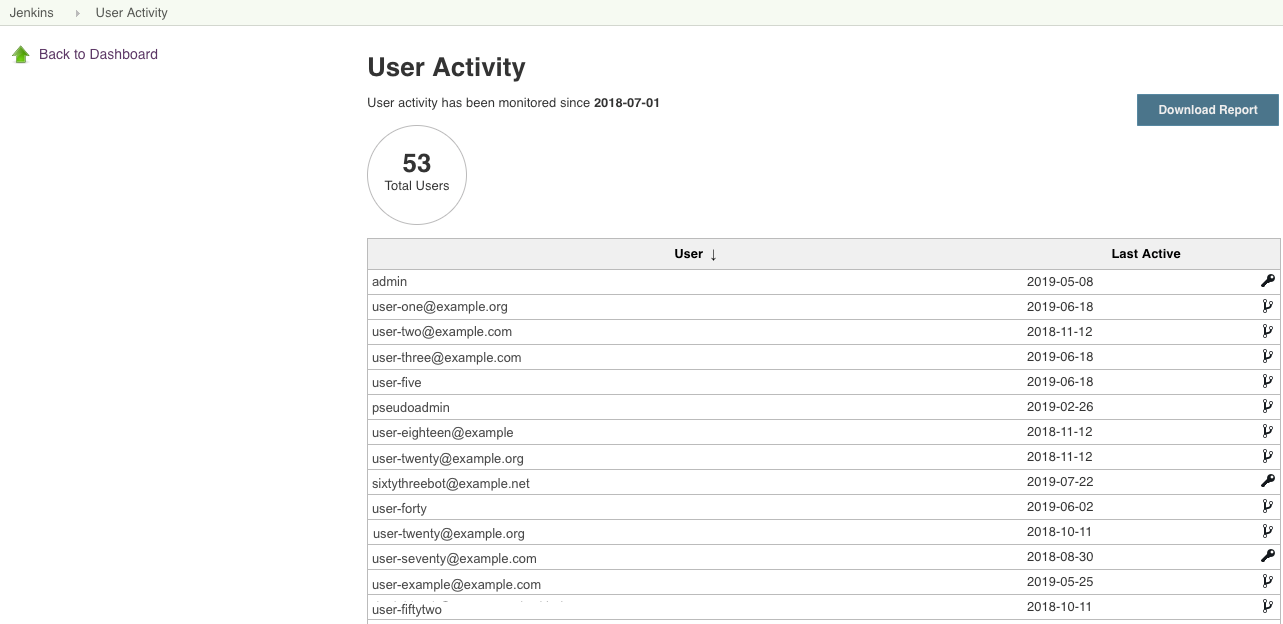
user-access-monthly-yyyy-MM-dd-HH-mm-ssss.csv. Figure 1. User Activity dashboard, version 1.3 and later
-
User Activity details
The following user activity details are available:
-
User activity has been monitored since: Displays the oldest Last active date and time for any user activity in the past 40 months.
-
Total users: Displays the total number of users.
The 50 most recent users are displayed in the dashboard. For all user activity for the past 40 months, select Download Report. -
User activity tracked by the plugin, including username, email address, date of last activity, and a user access type of either authenticated or Source Control Management (SCM).
-
Authenticated user access type: Users that are signed in using CloudBees authentication and perform actions directly on the system. These users are indicated by a key
 icon.
icon. -
SCM user access type: Users that perform code commits to a Source Control Management (SCM) tool that triggers jobs or reports results through CloudBees products. These users are indicated by a source control
 icon.
icon.
-
CloudBees User Activity Monitoring plugin version 1.1.7 and earlier
The following information is specific to the CloudBees User Activity Monitoring plugin, version 1.1.7 and earlier.
Counting and monitoring user licenses
The User Activity Monitoring plugin helps you understand licensing and entitlement. It provides you with a summary of user activity, CSV exports of user access details, and JSON reports that can be exported to other applications.
This topic explains how to install the plugin, prepare your instance or instances for reporting, and generate reports.
What counts as a user?
User means "an individual authorized by Customer to log into and use the CloudBees subscribed Products directly or an individual authorized by Customer to perform code commits into a source control management system triggering jobs in or reporting results through CloudBees Products. The licensed User quantity is the total number of unique Users of the Products calculated over the course of the entire Subscription Term."
| This plugin is not intended to provide an authoritative, precise measure of the number of subscribed users; it is intended to provide a reasonable approximation of user activity for discussion with your CloudBees account team. |
How users are counted
The User Activity Monitoring plugin generates data about user activity on your instance (or instances) over time. There are two different ways you can use the plugin to understand your user activity:
-
For standalone installation: if you only have one controller, you may just want a quick and simple accounting of user activity for each instance. If you have more than one controller, you must consolidate the data.
-
For large scale installation: if you’re responsible for hundreds or even thousands of instances with a very large and active user base, the instance-by-instance approach doesn’t scale. For administrators who need to aggregate user information at scale, please see large-scale approach.
How duplicate entries are handled
| To avoid duplicates, use the same user IDs in your identity provider (LDAP, SAML, etc.) and your SCM because Jenkins creates local users from both sources. |
Duplicate user activity entries are automatically managed both within controllers and across controllers (for situations where you are managing multiple instances). For example, if user-one@example.com appears on multiple instances, those entries will be deduplicated and only one entry for user activity will be recorded for a given time period.
For installations with multiple instances, deduplication requires that the user is referenced with the same identifier on all instances: see how users are identified for details on how individual users are identified. For example, user-one@example.com will be deduplicated if the individual uses the same email address on multiple instances, even if the individual appears as an authenticated user in one instance and an SCM user in another.
Deduplication occurs constantly at the controller level, and is reflected in the User Activity dashboard in both the number of users and the list of users. Deduplication across controllers occurs when the user activity aggregation scripts are executed.
Installing on a standalone installation
If you’re only managing a few instances, it may be more convenient to manually install the plugin on each instance. However, as soon as you have more than one controller, you must consolidate the data.
To install the plugin manually, repeat this process on each operations center and controller instance:
-
Log into the instance.
-
Navigate to .
-
Select the Available tab.
-
Locate and select the User Activity Monitoring plugin.
-
Select Install without restart to install the plugin (if the plugin is already installed, upgrade the plugin and then restart).
-
Verify that the plugin is installed by navigating to Manage Jenkins and confirming that a User Activity entry now exists on the page:
User Activity menu item
Installing on a large scale installation
The large-scale approach is intended for those administrators who are dealing with hundreds of instances and many thousands of users.
This approach uses several scripts to automate operations and make your data consistent. These scripts will be executed from a local server.
Preparing for the installation
-
First, visit the https://github.com/cloudbees/user-activity-monitoring-scripts GitHub repository maintained by CloudBees.
-
Download the following scripts to a single directory:
-
install-user-activity-monitoring-plugin.sh -
get-user-activity-monitoring-reports.sh -
merge-user-activity-monitoring-reports.sh -
count-user-activity.sh -
CountUsers.groovy -
MergeReports.groovy
-
-
Sign in to the operations center, go to your User Settings, and create an API token for the reporting operation:
-
Locate your username in the upper right corner of the operations center UI:
 Figure 2. User name
 -
Select the down arrow next to your username, and then select Configure:
 Figure 3. Configure
 -
Create a new token by selecting Add New Token:
 Figure 4. Add new token
 -
Provide an informative name and select Generate:
 Figure 5. Generate API token
 -
Before exiting operations center, copy the token value to the clipboard and save it:
 Figure 6. Copy API token
-
-
Create a file named
.envin the same location as you saved the scripts. Populate the.envfile with these values:OPS_CENTER_URL=<URL> (1) JENKINS_USER_ID=<USERNAME> (2) JENKINS_API_TOKEN=<API TOKEN> (3)1 The URL of your operations center instance. 2 The username for the CloudBees CI administrator. 3 The API token you generated earlier.
Installation methods
There are two ways to install the plugin on a large scale.
Installing using a cluster operation
Installing the plugin with a cluster operation is a less complicated method of handling a large plugin installation.
-
Log into your operations center instance.
-
Using the left-side navigation menu, select New Item.
-
In the New Item interface:
-
Provide an informative name for the new operation (1)
-
Select cluster operation (2)
-
Select OK to save the new cluster operation (3)
-
-
In the cluster operation interface, select Execute concurrent builds if necessary. This permits the operations center to perform multiple installations at the same time, instead of one installation at a time.
-
Select the Operations tab or scroll down to the Operations section, and add the following operations in sequence:
-
Select Add Operation, and select then Controllers. This indicates that the cluster operation will be performed on the controllers connected to the operations center.
-
Under Source, select From Project Parent. This specifies the scope of the source information, which in this case is a list of controllers. From Project Parent indicates that the search for sources should begin in the folder above the folder in which the project is stored.
-
Under Filters, select Add Filter and then select managed controller / client controller is Online. This specifies that operations center will filter the list of controllers to only those controllers that report that they are online.
-
Under Steps, select Add Step and then select Refresh update center metadata. This step forces the Update Center to refresh its information from the CloudBees servers before performing the cluster operation, and guarantees the most recent version of the plugin is available.
-
Under Steps, select Add Step and then select Install plugin. Change the plugin ID placeholder text to read
user-activity-monitoring, and the Version placeholder text to read the most recently released version of the plugin. -
Finally, under Steps, select Add Step and then select Safe Restart. This performs a "safe restart" on the controller instance after the plugin is installed.
-
-
Select Save to create and save the cluster operation. The operations center returns you to the Operation summary page.
-
Select Run to start the cluster operation.
Verifying the results of the cluster operation
-
The Build History status indicator shows the progress of the cluster operation:
 Figure 7. Build history
 -
Once the cluster operation completes, select the down arrow to the right of the build number and select Console Output to review the console output:
 Figure 8. Console output
 -
If the cluster operation was successful, the console log should look something like this:
Started by user Administrator Running as SYSTEM Building in workspace /Users/testuser/operations-center-one/workspace/deploy-user-activity-monitoring Started #1 master-one (log) #1 master-one finished successfully. master-one: SUCCESS Finished: SUCCESS -
Select the
loglink for a controller (in this case,master-one), presents a controller-level log of the cluster operation. In this case, it looks like this:Started Masters operation on master-one Updating update center core-cm-offline Using UpdateCenter.updateDirectlyNow OK: Requested synchronous update Updated. Updating update center cap-core-cm Using UpdateCenter.updateDirectlyNow OK: Requested synchronous update Updated. com.cloudbees.opscenter.server.clusterops.steps.ClusterOpsResult@104eea0d com.cloudbees.opscenter.server.clusterops.steps.ClusterOpsResult@2c40a396 The plugin 'user-activity-monitoring' is already installed, version '1.1.5' Installed version '1.1.5' is newer than requested version '1.1.5' The plugin 'user-activity-monitoring' is already enabled and active, nothing to do
Installing using shell scripts
Installing using shell scripts is a slightly more labor-intensive method of installing the plugin across a large number of controllers.
-
Confirm that you have downloaded the required scripts, that both
wgetandjqare present, and that the.envfile exists and is populated with the correct values. -
First, run the
install-user-activity-monitoring-plugin.shscript to install the plugin on the list of controllers retrieved from the operations center:shell$ ./install-user-activity-monitoring-plugin.sh Using .jenkins/jenkins-cli.jar. Collecting list of masters...Jul 17, 2019 7:29:09 AM org.apache.sshd.common.util.security.AbstractSecurityProviderRegistrar getOrCreateProvider INFO: getOrCreateProvider(EdDSA) created instance of net.i2p.crypto.eddsa.EdDSASecurityProvider done Install plugin on masters... * master-one: ko -
Next, run the
get-user-activity-monitoring-reports.shscript to generate JSON reports for each controller and store those reports in the local/out/reportsdirectory:shell% ./get-user-activity-monitoring-reports.sh Using .jenkins/jenkins-cli.jar. Collecting list of masters...Jul 17, 2019 7:47:11 AM org.apache.sshd.common.util.security.AbstractSecurityProviderRegistrar getOrCreateProvider INFO: getOrCreateProvider(EdDSA) created instance of net.i2p.crypto.eddsa.EdDSASecurityProvider done Generate user activity report on... * master-one: ko -
Next, run the
merge-user-activity-monitoring-reports.shscript to generate a unique report named/out/aggregated-user-activity.jsonthat contains a list of both authenticated and SCM users:shell% ./merge-user-activity-monitoring-reports.sh Merging user activity reports ... Reading individual reports from: out/reports/ File out/aggregated-user-activity.json generated -
Finally, run the
count-user-activity.shscript to populate a summary of the total user count to the file/out/aggregated-user-activity.json, and display the result tostdout:shell% ./count-user-activity.sh 1 user(s) counted as Authenticated from 2018-10-28 to 2019-02-03 3 user(s) counted as SCM contributor from 2018-10-28 to 2018-12-30 4 user(s) counted as CloudBees Core users from 2018-10-28 to 2019-02-03 Detailed summary available in: ./aggregated-user-activity-summary.json
The User Activity dashboard
The User Activity Monitoring dashboard summarizes user activity after the date of the plugin’s installation, with a data retention policy of one calendar year.
To see the User Activity dashboard, select , which displays the dashboard:
The dashboard provides the following information:
-
User activity was monitored since field: The amount of time for which user activity has been monitored. This value is a window of the previous 12 months of activity, starting from the date the plugin was installed.
-
The total number of users tracked by the plugin.
The "User activity was monitored since" field
This field reflects the amount of time for which the User Activity Monitoring plugin has been tracking user activity. The plugin does not track activity from before the plugin was installed, and user activity is aggregated monthly.
The user listing
Users are listed by username, with the date of their last activity and the user type:
-
Authenticated users: these users are users that have logged in using CloudBees authentication and have performed actions directly on the system. These users are indicated with a key icon
. -
SCM users: these users are "source control management" users for whom the instance builds or processes code, and these users are identified through build logs. These users are indicated with a source control icon
.
Generating Reports
There are two different methods to generate user activity reports:
-
On a per-controller basis, using the Download Report button.
-
On a large scale, using scripts.
Reporting per controller
If you are only operating a few instances, you can generate detailed user activity reports on a per-controller basis by selecting Download Report:

| The Download Report button uses the instance’s GUI to generate reports, and you should generate your user activity reports with the Download Report only if you have one to three instances. If you’re monitoring user activity across many instances, you should consult large-scale reporting using scripts for a more efficient large-scale method of collecting user activity data. Using this method means that you will have to combine reports for each instance. |
The report generated by Generate Report is downloaded to the local machine and named user-access-monthly-yyyy-MM-dd-HH-mm-ssss.csv. For example, user-access-monthly-2019-07-24-16-34-36-488 indicates a report downloaded on the date 2019-07-24 at the time of 16:34:36:488.
The report is formatted as Comma-Separated Values (CSV), with a single column labeled FIRST_DAY_OF_MONTH NAME ACCESS_TYPE. This column contains the following information:
-
The first day of the month in which the user registered activity. For example, a
FIRST_DAY_OF_MONTHvalue of6/1/2018indicates that the given user logged in some time in the month of June 2018. -
The name of the user (
NAME). -
The access type: either authenticated (
AUTH) or SCM (SCM).
| The CSV file can be converted from a single column into multiple sortable columns with secondary processing. For example, you can open the CSV file in Microsoft Excel, select the first column of the worksheet, and use the wizard to convert the single column to multiple columns. |
Reporting for large-scale installations using scripts
This scripted process is mostly used for large-scale reporting. However, if you use the standalone installation method on multiple controllers, you still need to aggregate the reports.
These steps gather information from all of your instances at once and aggregate user activity data into a single report.
Preparing to run the reporting scripts
First, prepare your system:
-
Install and configure the Jenkins CLI Tool.
-
Create a directory to store your reports:
shell% mkdir my-reports -
Download and install the reporting scripts, and create an
.envfile, by following the directions in Preparing for the installation.
Running the reporting scripts
After you’ve prepared your system, run the reporting scripts:
-
Execute
get-user-activity-monitoring.sh`to generate JSON reports for each controller and store those reports in the local `/out/reports/directory along with logs in/out/logs:shell% ./get-user-activity-monitoring-reports.sh Using .jenkins/jenkins-cli.jar. Collecting list of masters...Jul 17, 2019 7:47:11 AM org.apache.sshd.common.util.security.AbstractSecurityProviderRegistrar getOrCreateProvider INFO: getOrCreateProvider(EdDSA) created instance of net.i2p.crypto.eddsa.EdDSASecurityProvider done Generate user activity report on... * master-one: ko -
Execute
merge-user-activity-monitoring-reports.sh, which creates the/out/aggregated-user-activity.jsonreport. This report contains a list of allauthAccessandscmAccessentries:shell% ./merge-user-activity-monitoring-reports.sh Merging user activity reports ... Reading individual reports from: out/reports/ File out/aggregated-user-activity.json generatedThe resulting JSON file contains entries such as:
{ "authAccess": ["admin", "sixtythreebot@example.com", "automation", ...], "scmAccess": ["user-one@example.com", "user-two@example.com", "user-three@example.com", "user-five", ...] } -
Finally, execute
count-user-activity.sh, which generates the/out/aggregated-user-activity-summary.jsonreport (also sent tostdout). This report provides a consolidated view of user activity across all instances:shell% ./count-user-activity.sh 1 user(s) counted as Authenticated from 2018-10-28 to 2019-02-03 3 user(s) counted as SCM contributor from 2018-10-28 to 2018-12-30 4 user(s) counted as CloudBees Core users from 2018-10-28 to 2019-02-03 Detailed summary available in: ./aggregated-user-activity-summary.jsonThe resulting JSON file contains entries such as:
{ "from": "2019-07-01", "to": "2019-07-31", "authUsers": ["admin", "sixtythreebot@example.com", "automation", ...], "scmUsers": ["user-one@example.com", "user-two@example.com", "user-three@example.com", "user-five", ...] }
Next steps
After generating your reports, contact CloudBees Customer Support to discuss the results.
Reference: What the scripts do
This section explains the scripts used for large-scale installations as well as generating reports.
install-user-activity-monitoring-plugin.sh:
-
Collects a list of available controllers from the operations center.
-
Installs or upgrades the User Activity Monitoring plugin across many instances at once.
-
Automatically restarts controllers after the script completes.
get-user-activity-monitoring-reports.sh:
-
Requires CloudBees CI version 2.150 or later.
-
Collects a list of available controllers from the operations center.
-
Generates a JSON report for each controller and stores those reports in the local
/out/reportsdirectory.
count-user-activity.sh:
-
Generates a summary of the user count and writes it to the file
/out/aggregated-user-activity.json. -
Sends the result to
stdout.
merge-user-activity-monitoring-reports.sh:
-
Generates a unique report called
/out/aggregated-user-activity.json. -
That report contains a list of both
authAccessentries andscmAccessentries. -
authAccessdenotes an authenticated user (like administrator). -
scmAccessdenotes a user who only interacts with CloudBees CI via SCM, such as code checkins. -
User activity is deduplicated: that is, if
user-one@example.comappears in user activity for multiple instances, only one user activity entry is recorded for the aggregated report.
CountUsers.groovy: A Groovy script used by count-user-activity.sh.
MergeReports.groovy: A Groovy script used by merge-user-activity-monitoring-reports.sh.