Overview
CloudBees Release Orchestration SaaS enables you to view all commits and builds, including their status, and a visual representation of the pipeline from commit to production. Build summary, test results details, deployment summary, and success or failure status are all available. You can find where a given failure is, who should be notified, and how it can be fixed. Because you have visibility into all errors in build, deploy, test, and custom steps, you can make informed decisions leading to successful deployments.
| You must have the Admin, Developer, QA, or Manager role to access and . |
Accessing and filtering commits and builds
You can filter a list of commits or builds, display a visual representation of a selected pipeline, and display details of the pipeline execution.
| Detail | ||
|---|---|---|
Average deployment lead time (the average time taken for a commit to reach production) |
|
|
Commit date/time |
|
|
Build date/time |
|
|
Build ID |
|
|
Commit ID |
|
|
Pipeline name |
|
|
Description |
|
|
Developer |
|
|
Pipeline status |
|
|
Deployment lead time (the time a commit takes to reach production) |
|
|
To access commits or builds:
-
From the CloudBees Release Orchestration SaaS Home page, select one of the following:
-
-
-
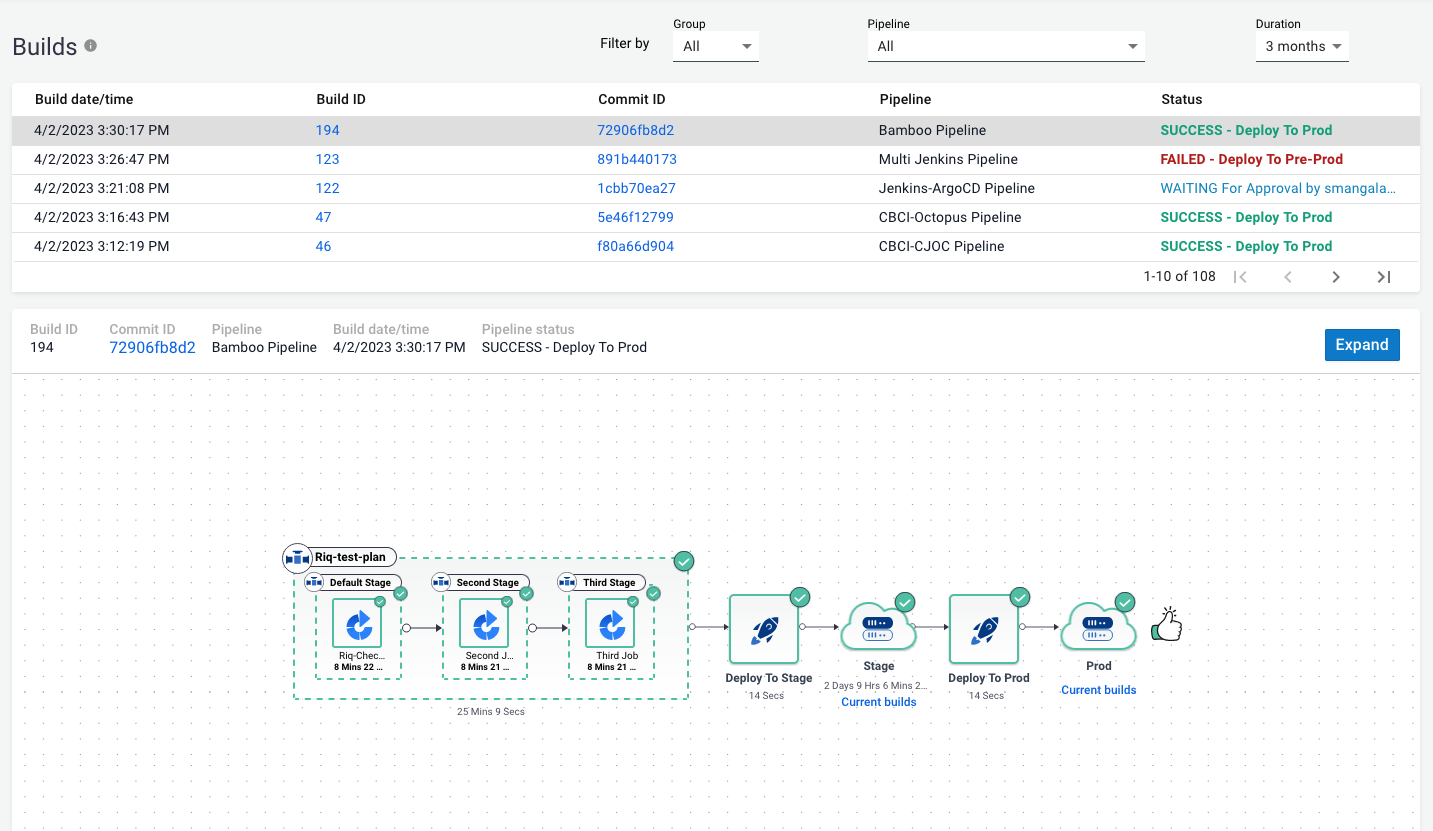 Figure 1. A list of builds
-
-
Select how you want to filter from the options:
-
Pipeline group
-
Pipeline name
-
A time duration
-
Your own commits (not available on )
-
Code branch (not available on )
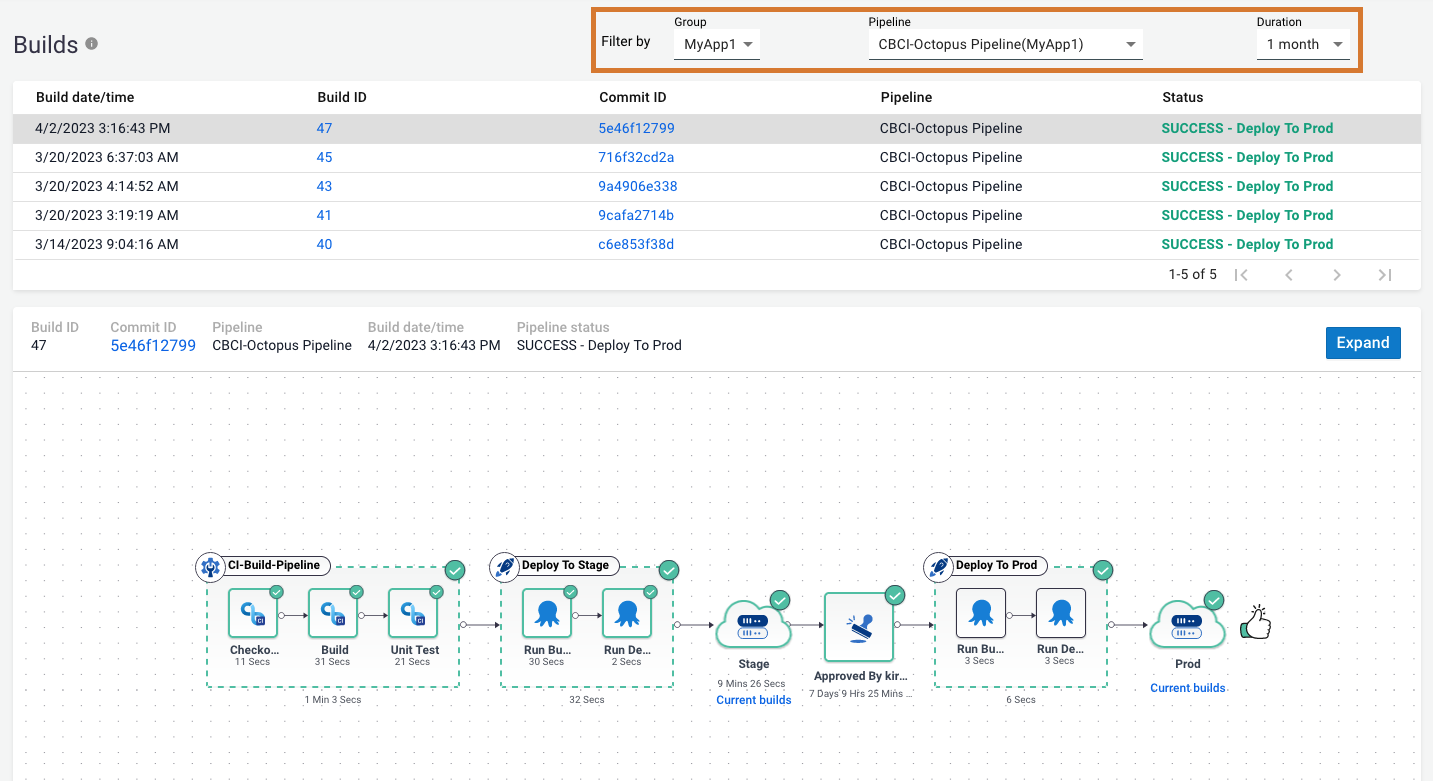 Figure 2. Filtering builds by pipeline group, name and time frame
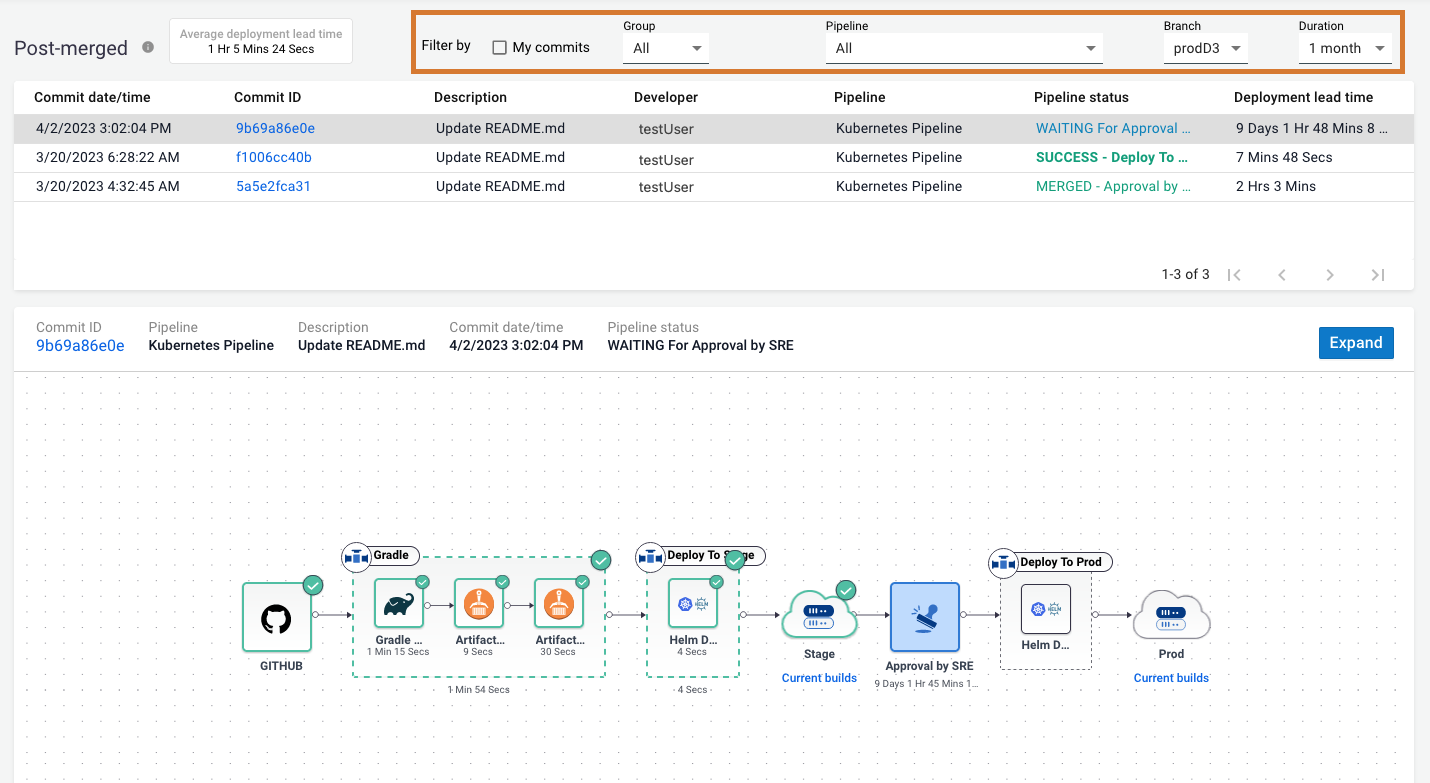 Figure 3. Filtering commits by branch and time frame
-
-
Select a commit or build.
You have filtered a list of commits or builds, and a visual representation of your selected pipeline displays.
|
CloudBees Release Orchestration SaaS displays steps in the pipeline according to your pipeline definition in . |
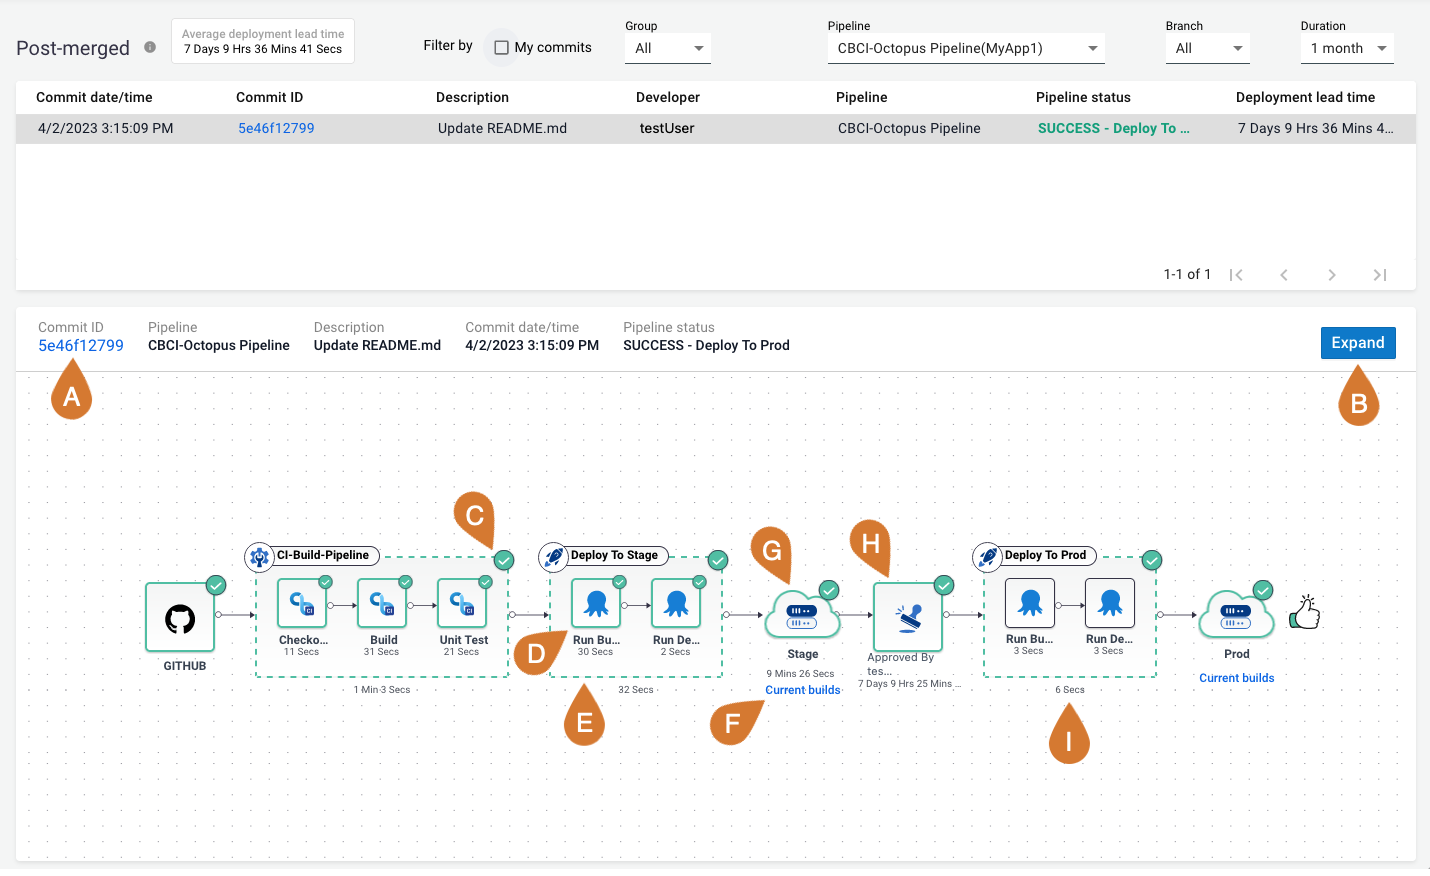
The figure above highlights the following on the visual representation of the pipeline:
-
Select the commit ID to view the commit in the repository.
-
Select Expand to display the pipeline in an expanded view.
-
The status of each step or stage is located on its upper-right corner.
-
A green checkmark icon marks a passing step/stage.
-
A red exclamation point icon marks a failing step/stage.
-
-
Select a completed step to view its console log. Select Ok to close.
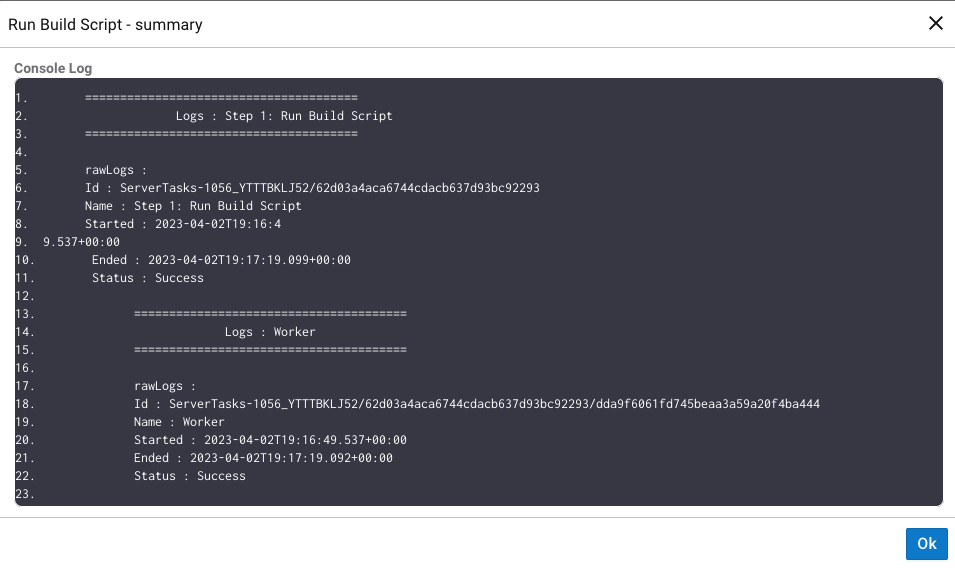 Figure 5. Console log of completed step in deploy to stage
 -
Select a completed stage to view its summary. Refer to Accessing a completed stage summary for more information.
-
Select Current builds for any environment to display the current list of builds for that environment.
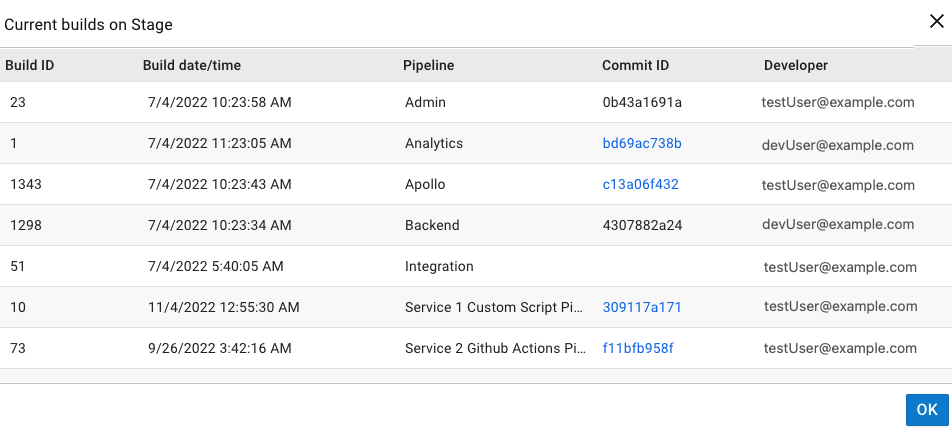 Figure 6. An example of current builds on the stage environment
 -
Select an environment to view test results. To learn more, refer to Accessing a test summary.
-
If a stage has a WAITING For Approval pipeline status, and you are the approver, you can provide feedback. Refer to Approving/rejecting a pipeline execution for more information.
-
The time taken is displayed below each step/stage.
|
In , the build ID links to the following:
|
| If a PR is merged in , you can select the linked list of commits in the feature branch to display all linked commits. |
Accessing a completed stage summary
In the visual representation of a pipeline, you can select a completed stage to view its summary.
To access a completed stage summary:
-
From the CloudBees Release Orchestration SaaS Home page, select one of the following:
-
-
Select a build or commit.
-
Select a completed stage to view:
-
Build ID.
-
Build date and time.
-
Pipeline name.
-
Commit ID. Select the commit ID to view the commit in the repository.
-
Developer.
-
-
(Optional) Select
 View full log to open the log file in a new browser tab. Refer to Accessing a log file for more information.
 -
(Optional) Select
 or
or  , as appropriate, to open the Job URL in a new browser tab.
The completed stage summary details are displayed. Select Ok to close the stage summary.

Accessing a log file
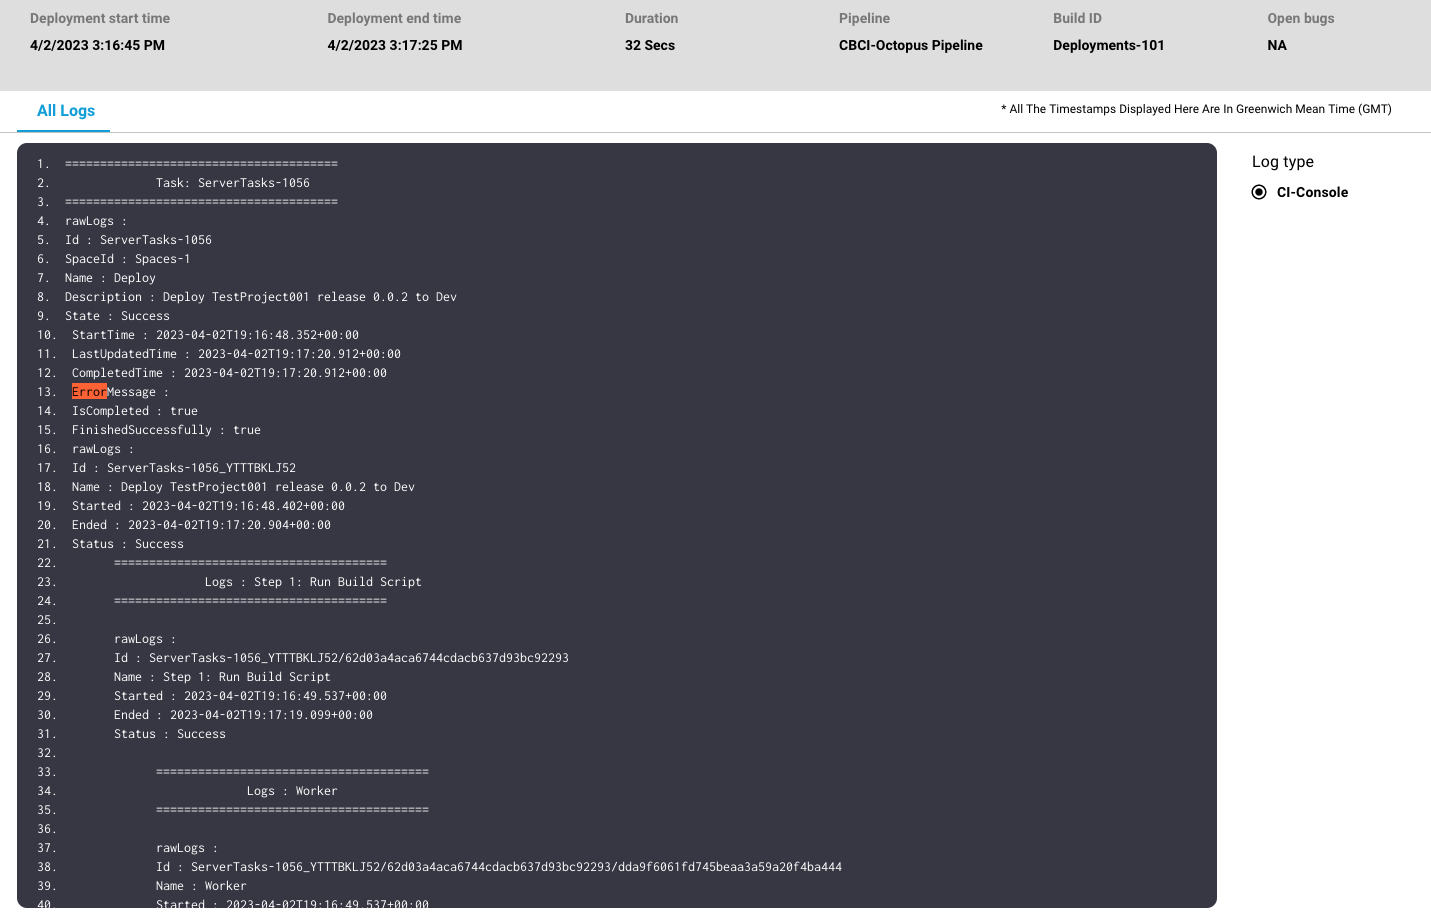
In the visual representation of a pipeline, you can select a completed stage to view its log file in a new browser tab. Any errors are highlighted.
To access a log file from a completed pipeline stage:
-
From the CloudBees Release Orchestration SaaS Home page, select one of the following:
-
-
Select a build or commit.
-
Select a completed stage.
-
Select
 View full log.
 Figure 8. Summary of completed stage with View full log highlighted
 -
(Optional) If the stage has failed, you can select FILE A BUG to report a bug in Jira.
|
For some failed steps, there is both a Root Cause log and All logs. Select All Logs to display the complete log. You can select the following log types:
|
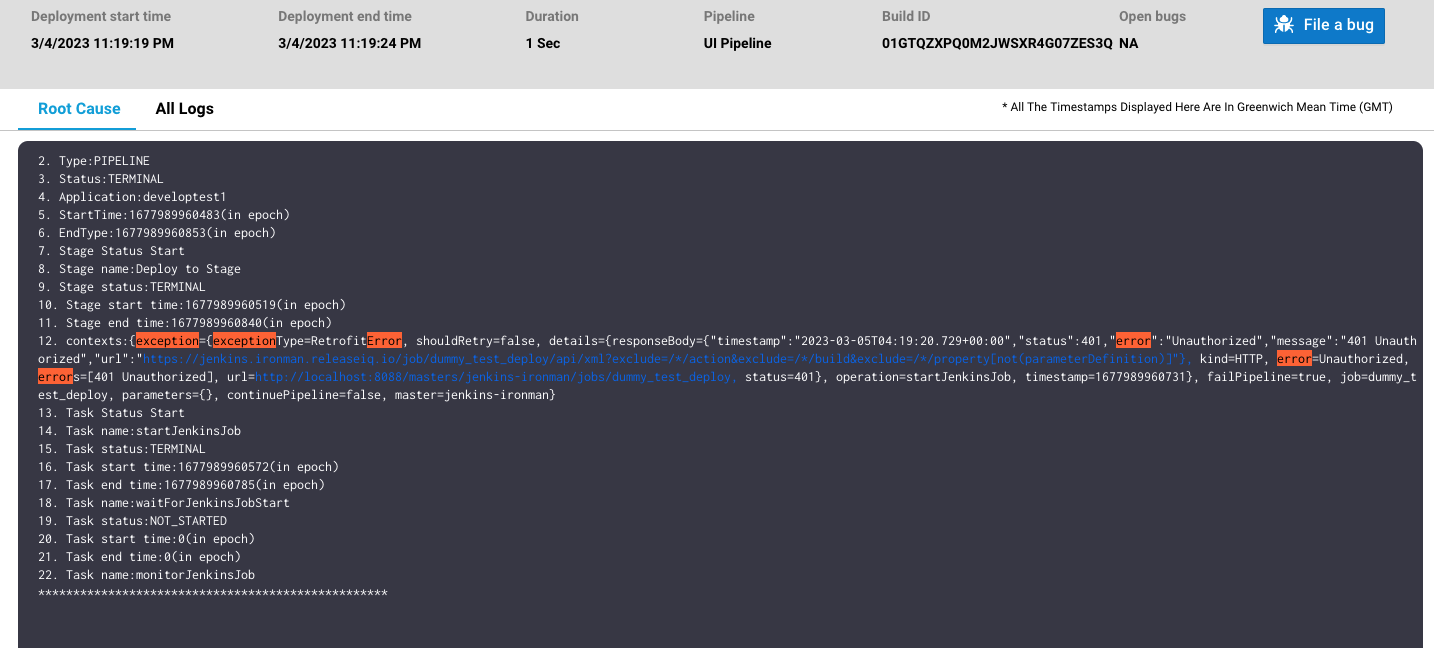
The log file from the completed pipeline stage is displayed in a new browser tab, and if the pipeline failed, the error is highlighted.
Accessing a test summary
The CloudBees Release Orchestration SaaS test summary provides testing duration, number of successful and failed test runs, and logs for each test.
To access test summary details:
-
From the CloudBees Release Orchestration SaaS Home page, select one of the following:
-
-
Select a build or commit.
-
Select a stage environment or select Expand. The test results are displayed as vertical bars.
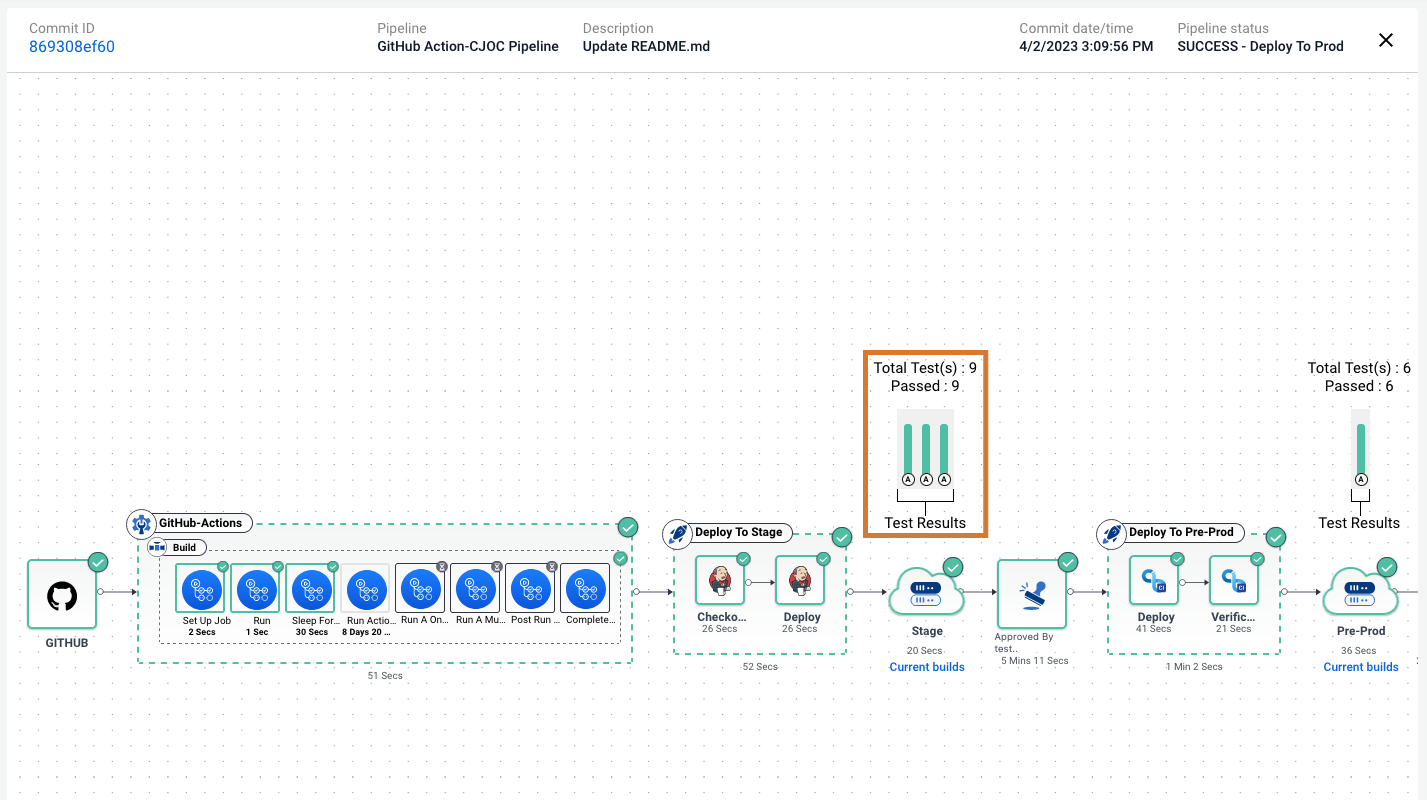 Figure 11. Test results highlighted above the environment
 -
Select a bar.
-
A green bar indicates passing tests.
-
A red bar indicates failed tests.
-
A gray bar indicates no data.
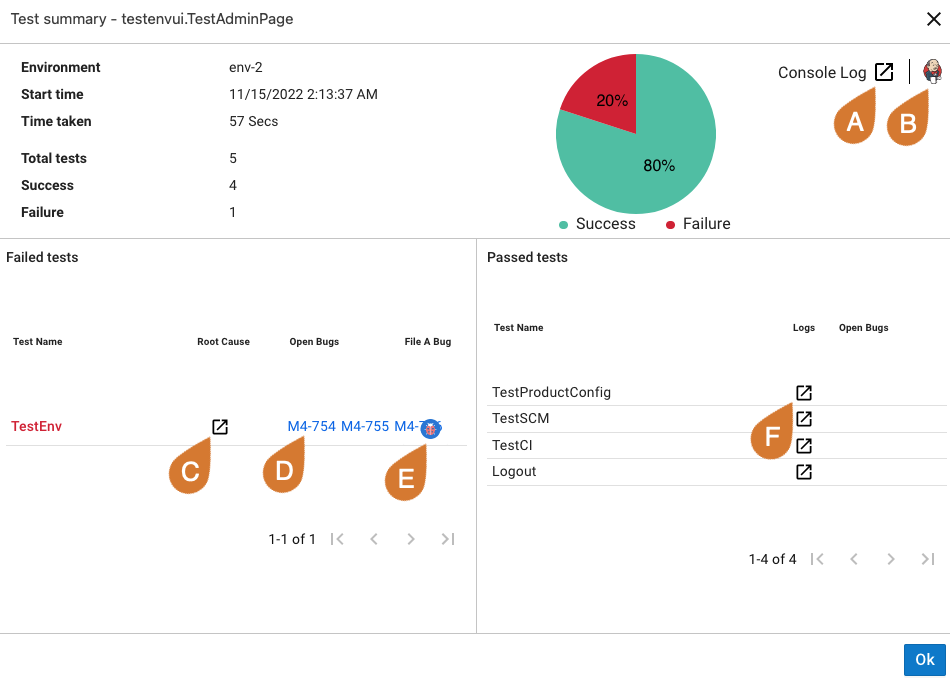 Figure 12. An example of test summary details
-
The test summary details are displayed. You can select:
-
The console log.
-
The job URL.
-
The root cause for a failed test.
-
An open bug.
-
 to file a bug.
 -
The log for a passing test.
Select OK to close the test summary details.
Identifying a rolled back commit
A red rollback icon next to Commit ID indicates that the current commit is rolled back to the previous commit. To learn more, refer to Enabling rollback.
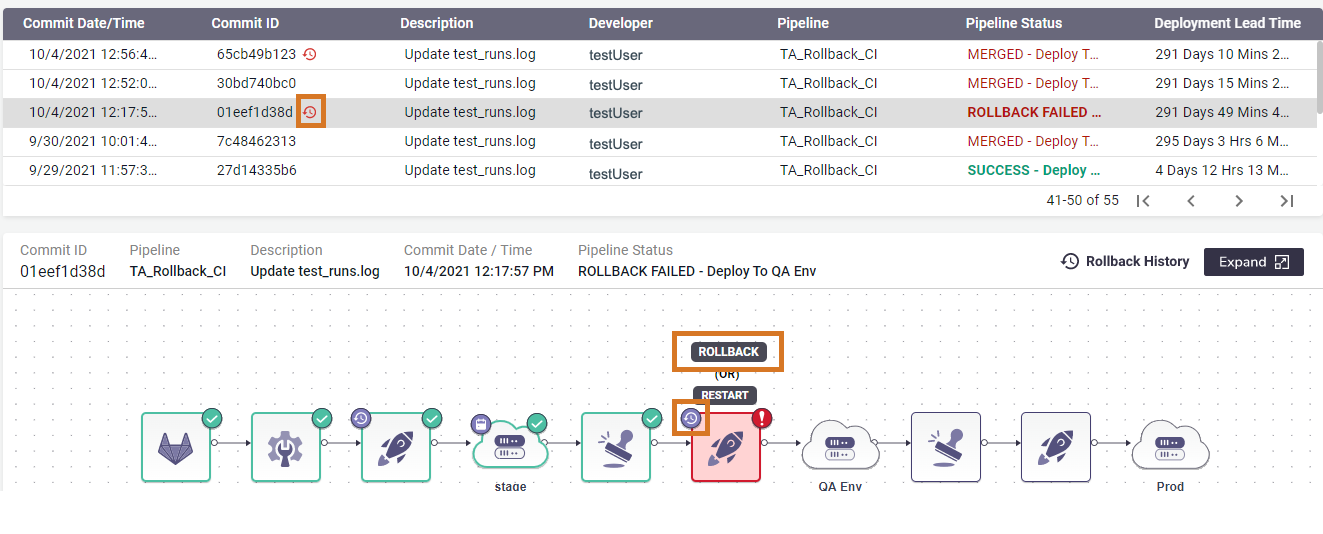
Select Rollback History to display the stage history, including:
-
The build ID for the commit that was rolled back
-
Current build ID
-
Time and date of rollback
-
Email of the person who did the rollback
-
Any comments
Identifying a hotfixed commit
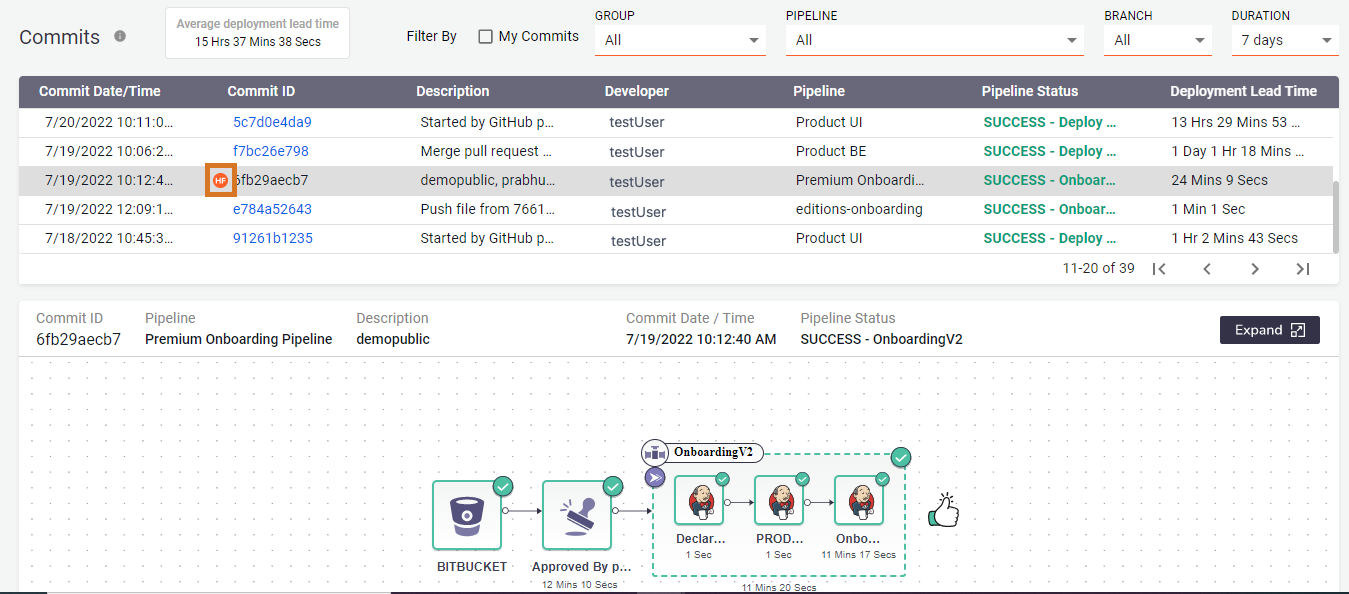
An orange HF icon next to the Commit ID indicates that the current commit is hotfixed. A hotfix is useful to modify a commit if there is an issue in an environment, but you still want to deploy a build.
Restarting a pipeline
If your pipeline fails, you may be able to restart it. Pipelines that can be restarted will have RESTART available above the failed stage.
To restart a pipeline:
-
From the CloudBees Release Orchestration SaaS Home page, select one of the following:
-
-
Select a commit with a FAILED pipeline status.
-
Select RESTART above the failed stage.
 Figure 15. Restarting a pipeline
 -
Select PROCEED.
Your pipeline restarts.
Verifying the deployment
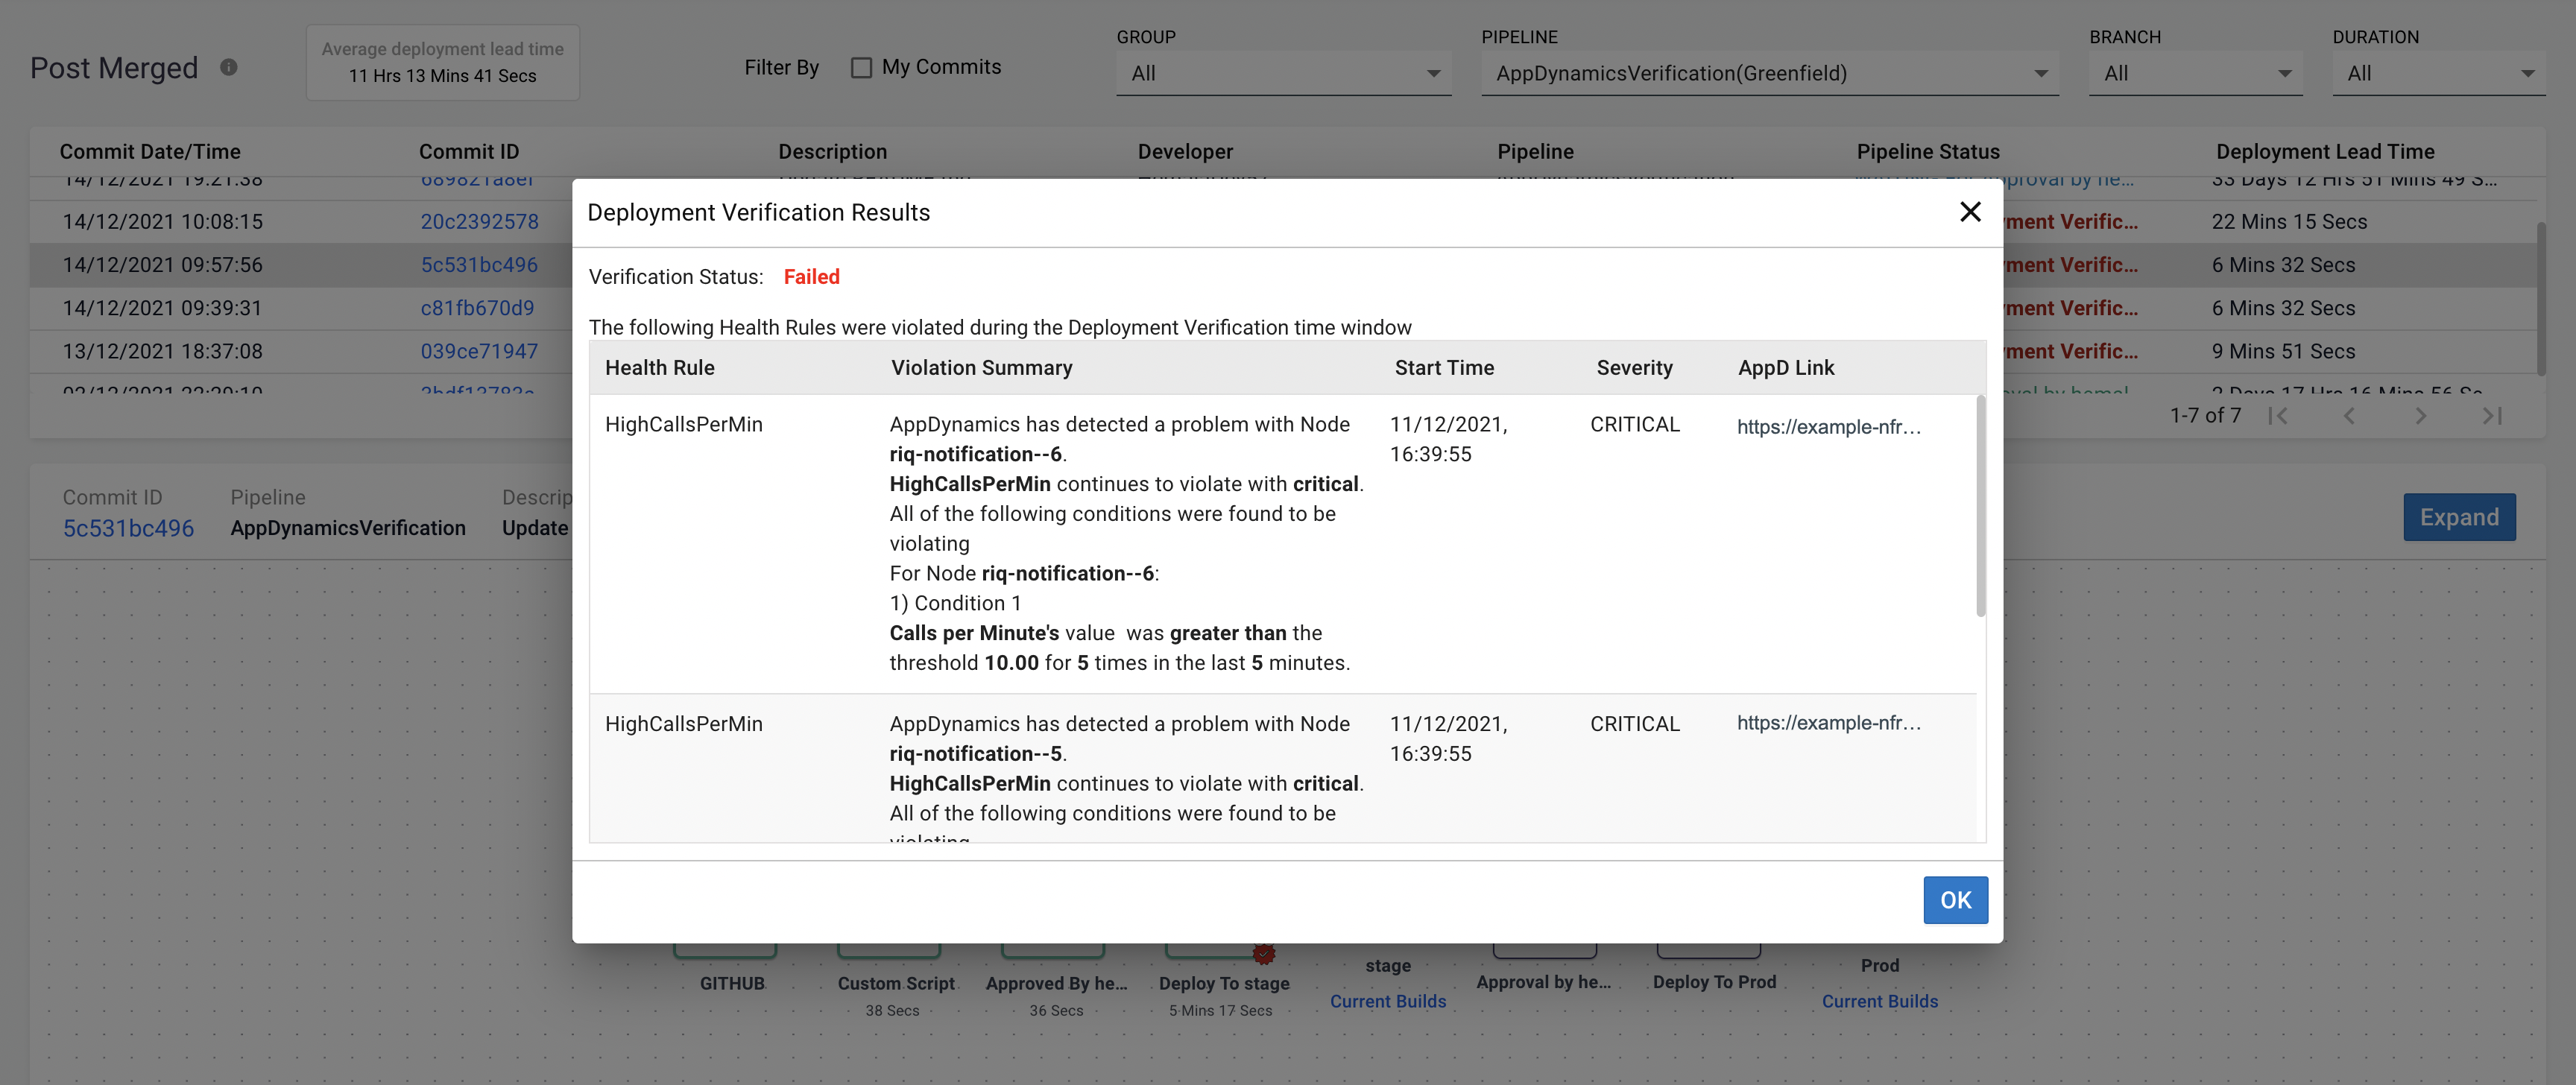
CloudBees Release Orchestration SaaS features deployment verification. Deployment verification determines if a critical problem is present after deployment. A red icon displays if there is a failure. For more information, refer to Verifying deployment.
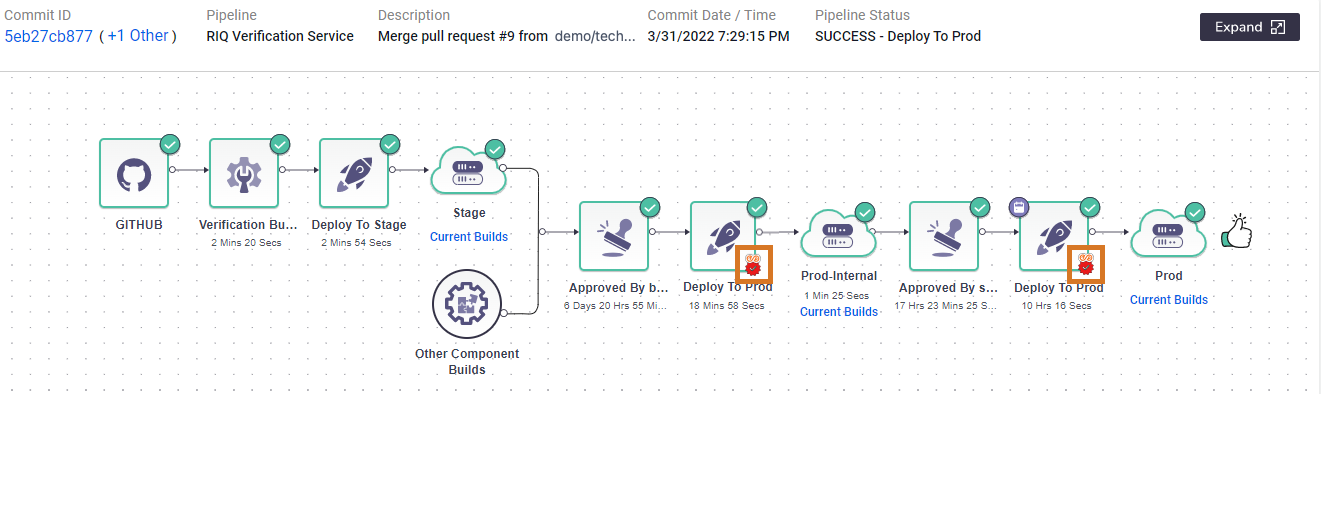
Selecting the failed deployment verification icon displays:
-
Health rules violated
-
Violation summary
-
Start time
-
Severity
-
AppD link
