Productivity in CloudBees Release Orchestration SaaS enables users, including both managers and developers, to understand pipeline group performance within a given timeline.
Filtering Productivity
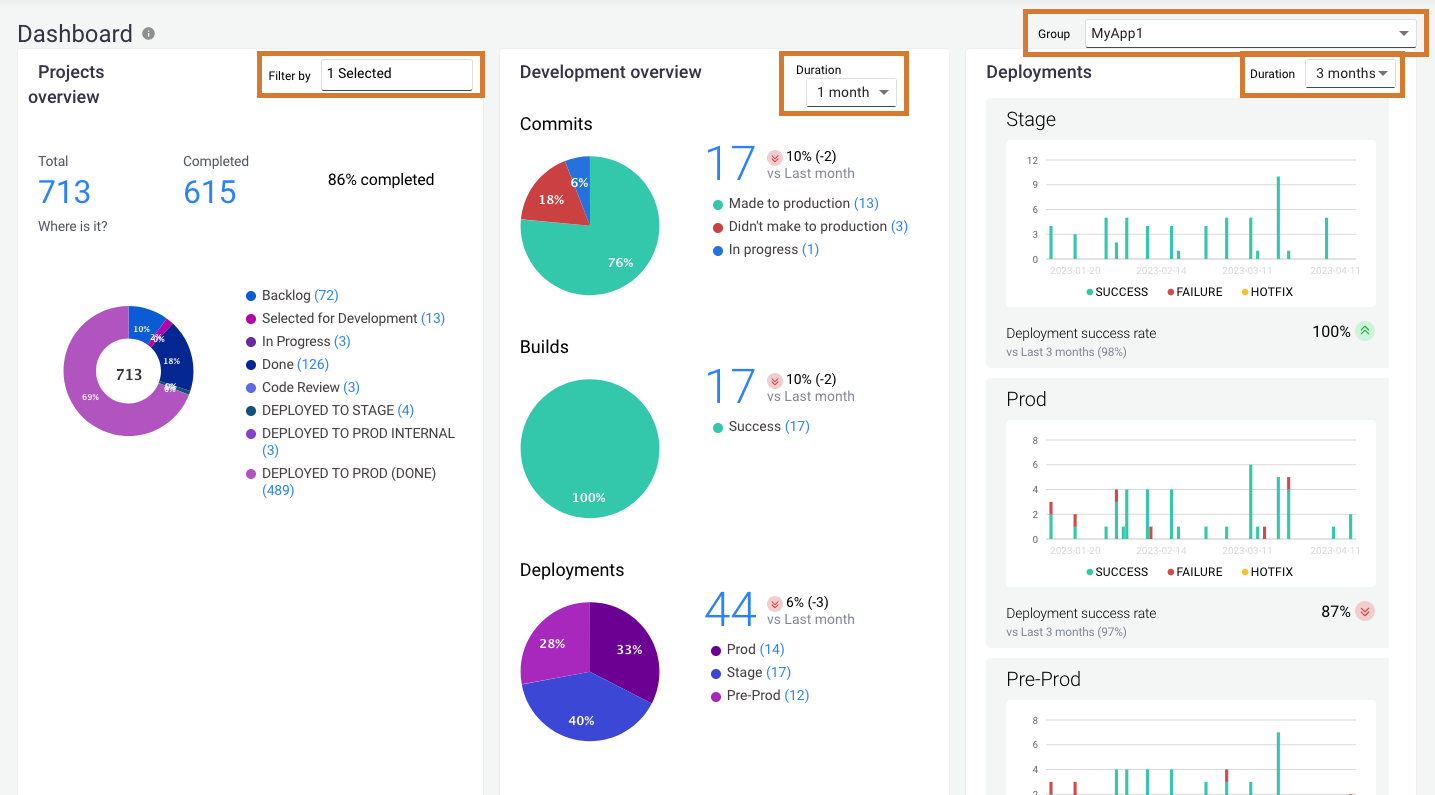
Productivity displays pipeline group performance within a given timeline. Select a pipeline group to filter the entire dashboard, and a timeline duration to filter most views.
In addition to filtering by duration, DORA metrics and Commits trend allow you to filter by comparing with other groups or by pipeline. You can also filter by the CloudBees Release Orchestration SaaS user (Engineer) in Commits trend.
Select the timeline duration to be any of the following:
-
24 hours
-
48 hours
-
7 days (default)
-
1 month
-
3 months
-
All time
| There is no filter for the Current builds view. |
To filter a Productivity view:
-
From the CloudBees Release Orchestration SaaS Home page, select .
-
Select a pipeline group from the Group options on the upper right of .
-
Select from the Duration options on the upper right of a given view.
-
If applicable, select one of the Filters options on the upper right of either the DORA metrics or Commits trend views. To learn more, refer to DORA metrics or Commits trend, respectively.
-
Select Compare with other groups to compare with other pipeline groups.
-
Select Pipeline to view graphs of commits to specific pipelines.
-
Select Engineer to view graphs of commits by specific users (for Commits trend view only).
-
You are displaying data filtered by your selections.
In Productivity, the following views are displayed:
| View and link to more information | Description | Filter(s) |
|---|---|---|
Items to do, in progress, and deployed for each JIRA project in the pipeline group |
JIRA Task, Epic, Bug and/or Story |
|
Successful, failed, and in-progress commits, builds, and deployments data |
Duration |
|
Number of success, failure, rollback, and hotfix deployments for each environment |
Duration |
|
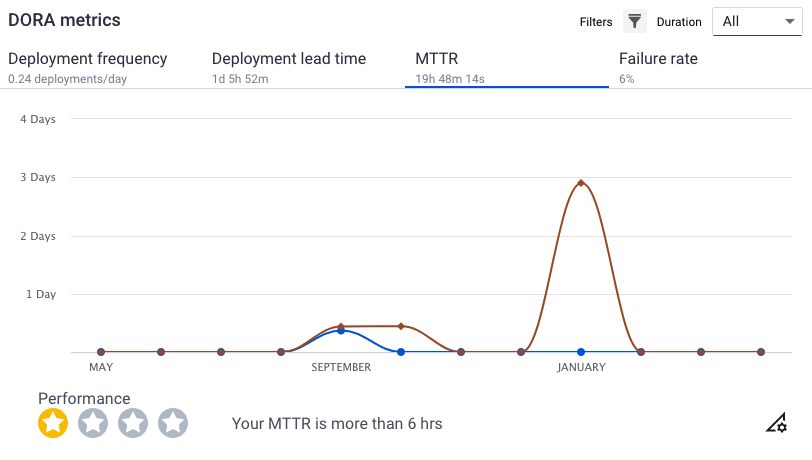
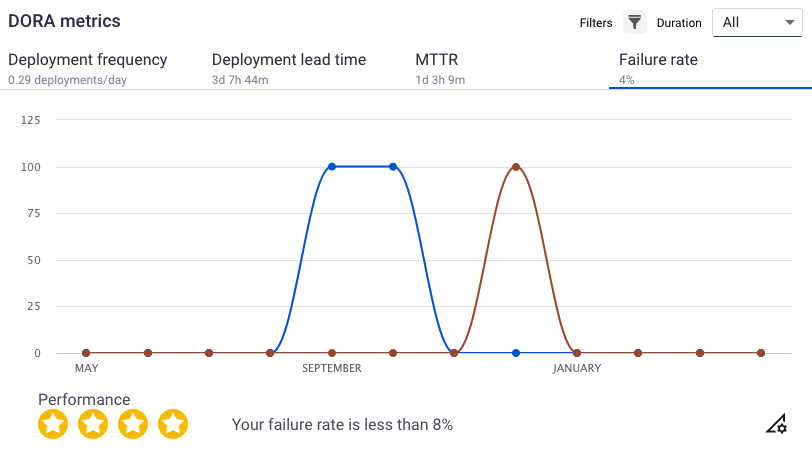
Deployment frequency, Deployment lead time, MTTR (mean time to recovery), and Failure rate |
Duration, Compare with other groups, Pipeline |
|
Number of commits by date |
Duration, Compare with other groups, Pipeline, Engineer |
|
Current pipeline builds with commits information |
None |
|
Meaningful findings from data analysis to provide more insight |
Duration |
Projects overview
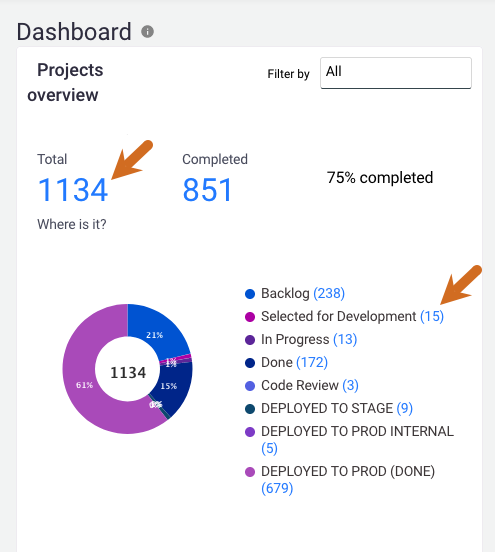
The Projects overview provides, for each project, a doughnut graph of number of issues to do, in progress, and deployed to each environment. The number and percentage of issues completed is also displayed.
Display All or filter by any combination of:
-
Task
-
Epic
-
Bug
-
Story
Each blue number links to an issue list displaying:
-
Issue ID
-
Issue type
-
Summary
-
Assignee
-
Status
Development overview
The Development overview provides the number and percentage of commits, builds, and deployments over a selected period of time, in pie graph format.
-
The commits graph summarizes how many commits went into production and how many are still in progress.
-
The builds graph summarizes successful and failed builds.
-
The deployments graph summarizes percentages of deployments to each environment.
-
The number next to
 Increase or
  Decrease is the percentage and number change from the previous timeframe.
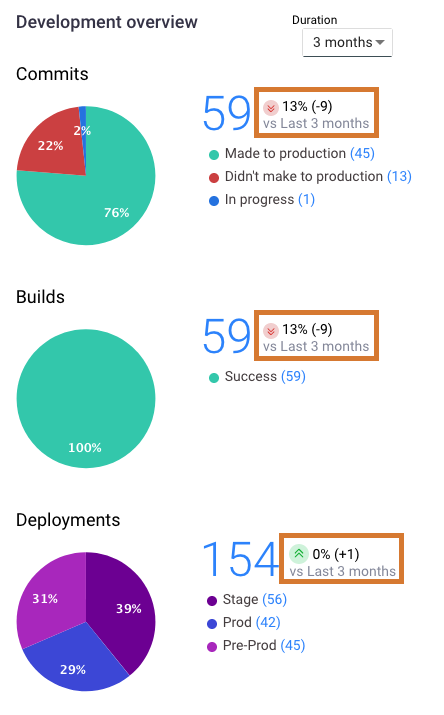 Figure 3. Development overview with comparison to previous duration highlighted
 -
Each blue number links to a summary list for that timeline.
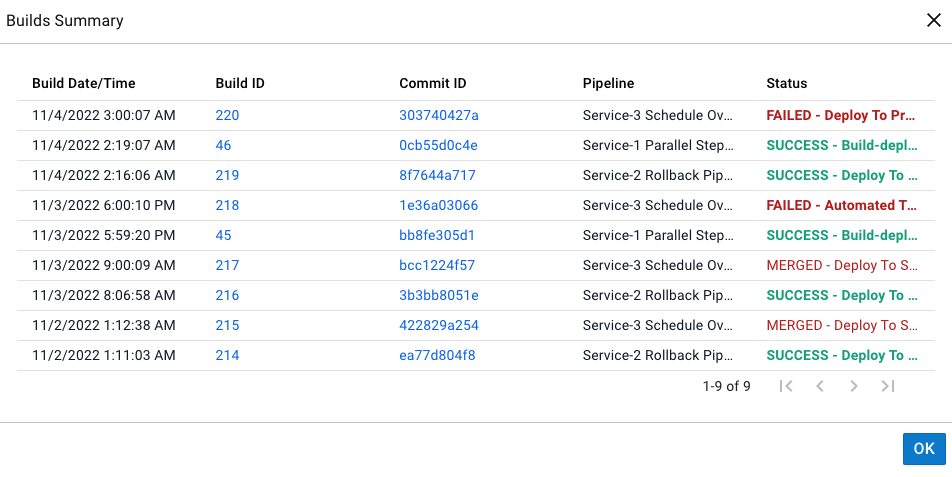 Figure 4. Development overview builds summary
Deployments
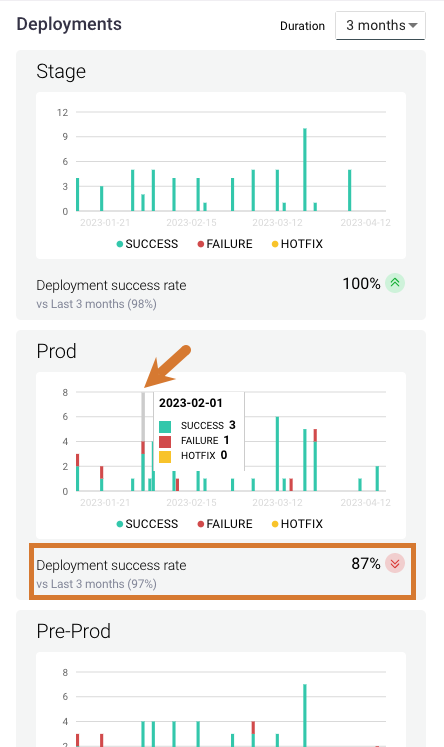
Deployments summarizes deployments with a bar graph for each environment. Successes, failures, and hotfixes are all displayed for the selected duration.
The number next to  Increase or
  Decrease is the percentage change in deployment success rate from the previous timeframe.
Select a bar on the graph to view the number of successful, failed, or hotfixed deployments for a given date.
DORA metrics
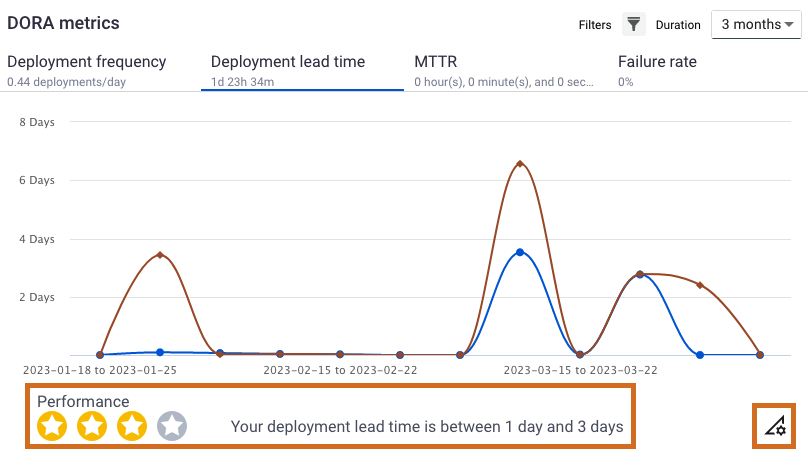
DevOps Research and Assessment (DORA) metrics can measure performance of DevOps teams, and CloudBees Release Orchestration SaaS incorporates these metrics into .
The four key DORA metrics are:
-
Deployment frequency
-
Deployment lead time
-
Mean time to recover (MTTR)
-
Failure rate
Each DORA metric view has a performance rating, from one to four  . Select the
 ![]() to configure the DORA metrics thresholds.
to configure the DORA metrics thresholds.
An example configuration for deployment frequency performance, as measured by the number of deployments over time, is:
| Star rating | Name | Definition |
|---|---|---|
|
Elite |
> One per day |
|
High |
Once daily to > once weekly |
|
Medium |
Once weekly to > once monthly |
|
Low |
Once monthly to > once every six months |
Accessing and filtering DORA metrics views
You can filter the four DORA metrics views by duration and by comparing with other groups or by pipeline. Select any number of options, or select All, and they are displayed separately on the graphs.
To access and filter DORA metrics views:
-
From the CloudBees Release Orchestration SaaS Home page, select .
-
Select a pipeline group from the Group options on the upper right of .
-
Select from the Duration options on the upper right of the DORA metrics view.
-
(Optional) Select one of the Filters options on the upper right. The default view displays commits from all pipelines and all users within a single pipeline group.
-
Select Compare with other groups to compare commits of the selected pipeline group with other pipeline groups. Hover on a graph point to view the date range, group name, and number of commits.
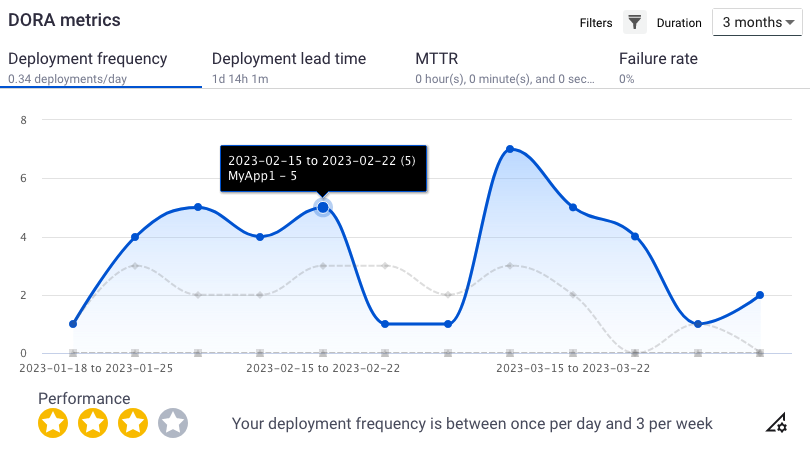 Figure 7. Deployment frequency compared with other groups
 -
Select Pipeline to view graphs of commits to specific pipelines in the group. Hover on a graph point to view the date range, pipeline name, and number of commits.
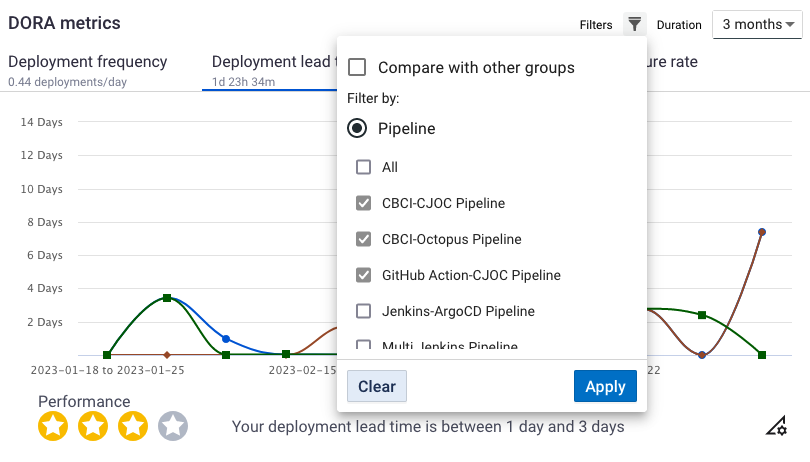 Figure 8. Deployment lead time filter and three pipelines selected
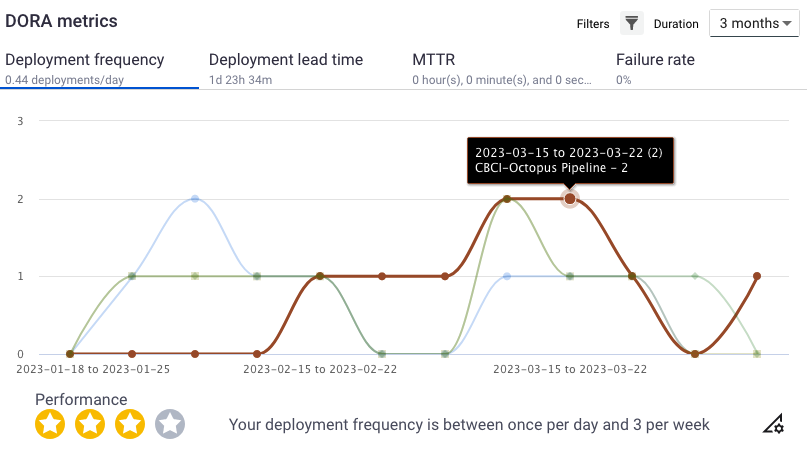 Figure 9. DORA metrics deployment frequency of different pipelines
 -
-
Select one of the following views from the top of DORA metrics:
-
Deployment frequency
-
Deployment lead time
-
MTTR
-
Failure rate
The average data for each view in DORA metrics is listed under the view name.
-
You are displaying a DORA metrics view of data filtered by your selections.
Frequency
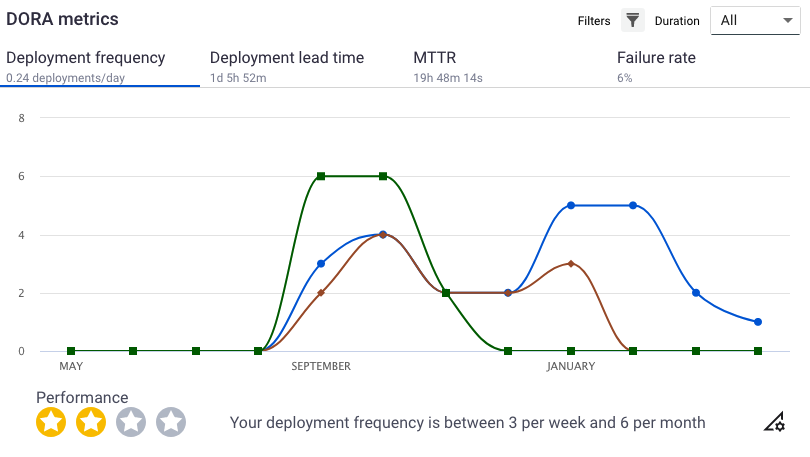
The deployment frequency view depicts the total number of commits that finish a CloudBees Release Orchestration SaaS pipeline and go into production over a selected timeframe.
Lead time
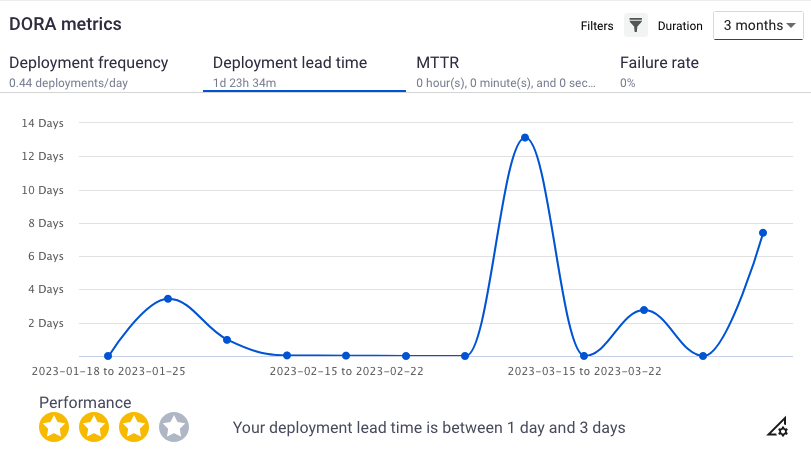
The deployment lead time view depicts on average how long it takes for commits finish a CloudBees Release Orchestration SaaS pipeline and go into production.
Commits trend
The Commits trend view displays a line graph of the number of commits in a given period of time. You can also compare with other pipeline groups, or filter by either Pipeline or Engineer (user). Select any number of options, or select All, and they are displayed separately on the graph.
To filter a Commits trend view:
-
From the CloudBees Release Orchestration SaaS Home page, select .
-
Select a pipeline group from the Group options on the upper right of .
-
Select from the Duration options on the upper right of the Commits trend view. Hover on a graph point to view the date range, pipeline group, and number of commits.
-
(Optional) You can select one of the Filters options on the upper right. The default view displays commits from all pipelines and all users within a single pipeline group.
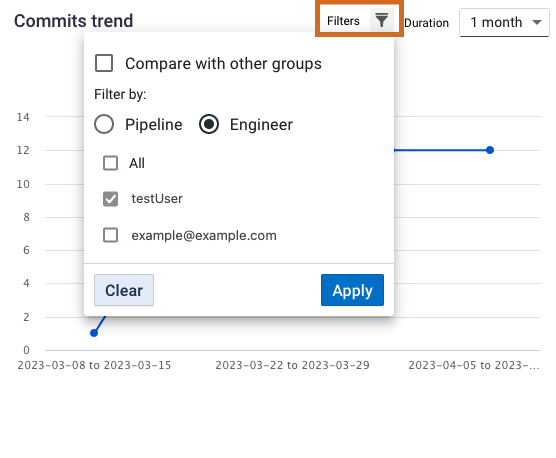 Figure 14. Commits trend pipeline filter highlighted and Engineer selected
-
Select Compare with other groups to compare commits of the selected pipeline group with other pipeline groups. Hover on a graph point to view the date range, group name, and number of commits.
-
Select Pipeline to view graphs of commits to specific pipelines in the group. Hover on a graph point to view the date range, pipeline name, and number of commits.
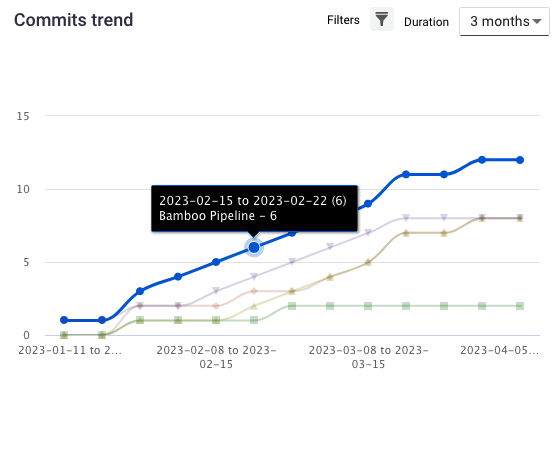 Figure 15. Pipeline filter selected and hovering on a data point
 -
Select Engineer to view graphs of commits by specific users. Hover on a graph point to view the date range, user name, and number of commits.
-
You are displaying Commits trend data filtered by your selections.
Current builds
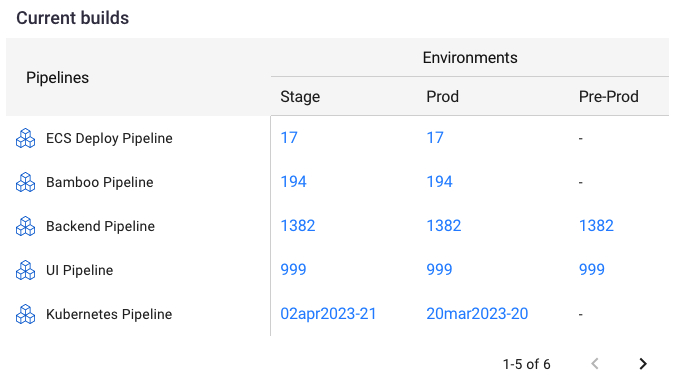
Current builds displays the latest builds deployed in each environment for all pipelines in the selected group. Select a link to display the commits information for the selected build.
Actionable insights
CloudBees Release Orchestration SaaS analyzes your pipeline group data and develops actionable insights. Actionable insights are helpful to determine what actions need to be taken or how one should think about an issue.
There are three types of insights:
-
Approvals
-
Test results
-
Pipeline stages
Select a link to get details of a specific component.

