Issue
-
I am experiencing a memory leak related to the Jolokia JMX Agent. Jenkins JVM heap utilization is unexpectedly climbing over time.
Users of the Jolokia Agent for JMX monitoring have reported a memory leak here: https://github.com/jolokia/jolokia/issues/399
From the reported issue:
If the CleanupThread encounters a non-daemon Thread which runs for a long time, then CleanupThread does not make any progress and keeps a reference to all other threads which might have terminated in the mean time. This is preventing GC from reclaiming memory.
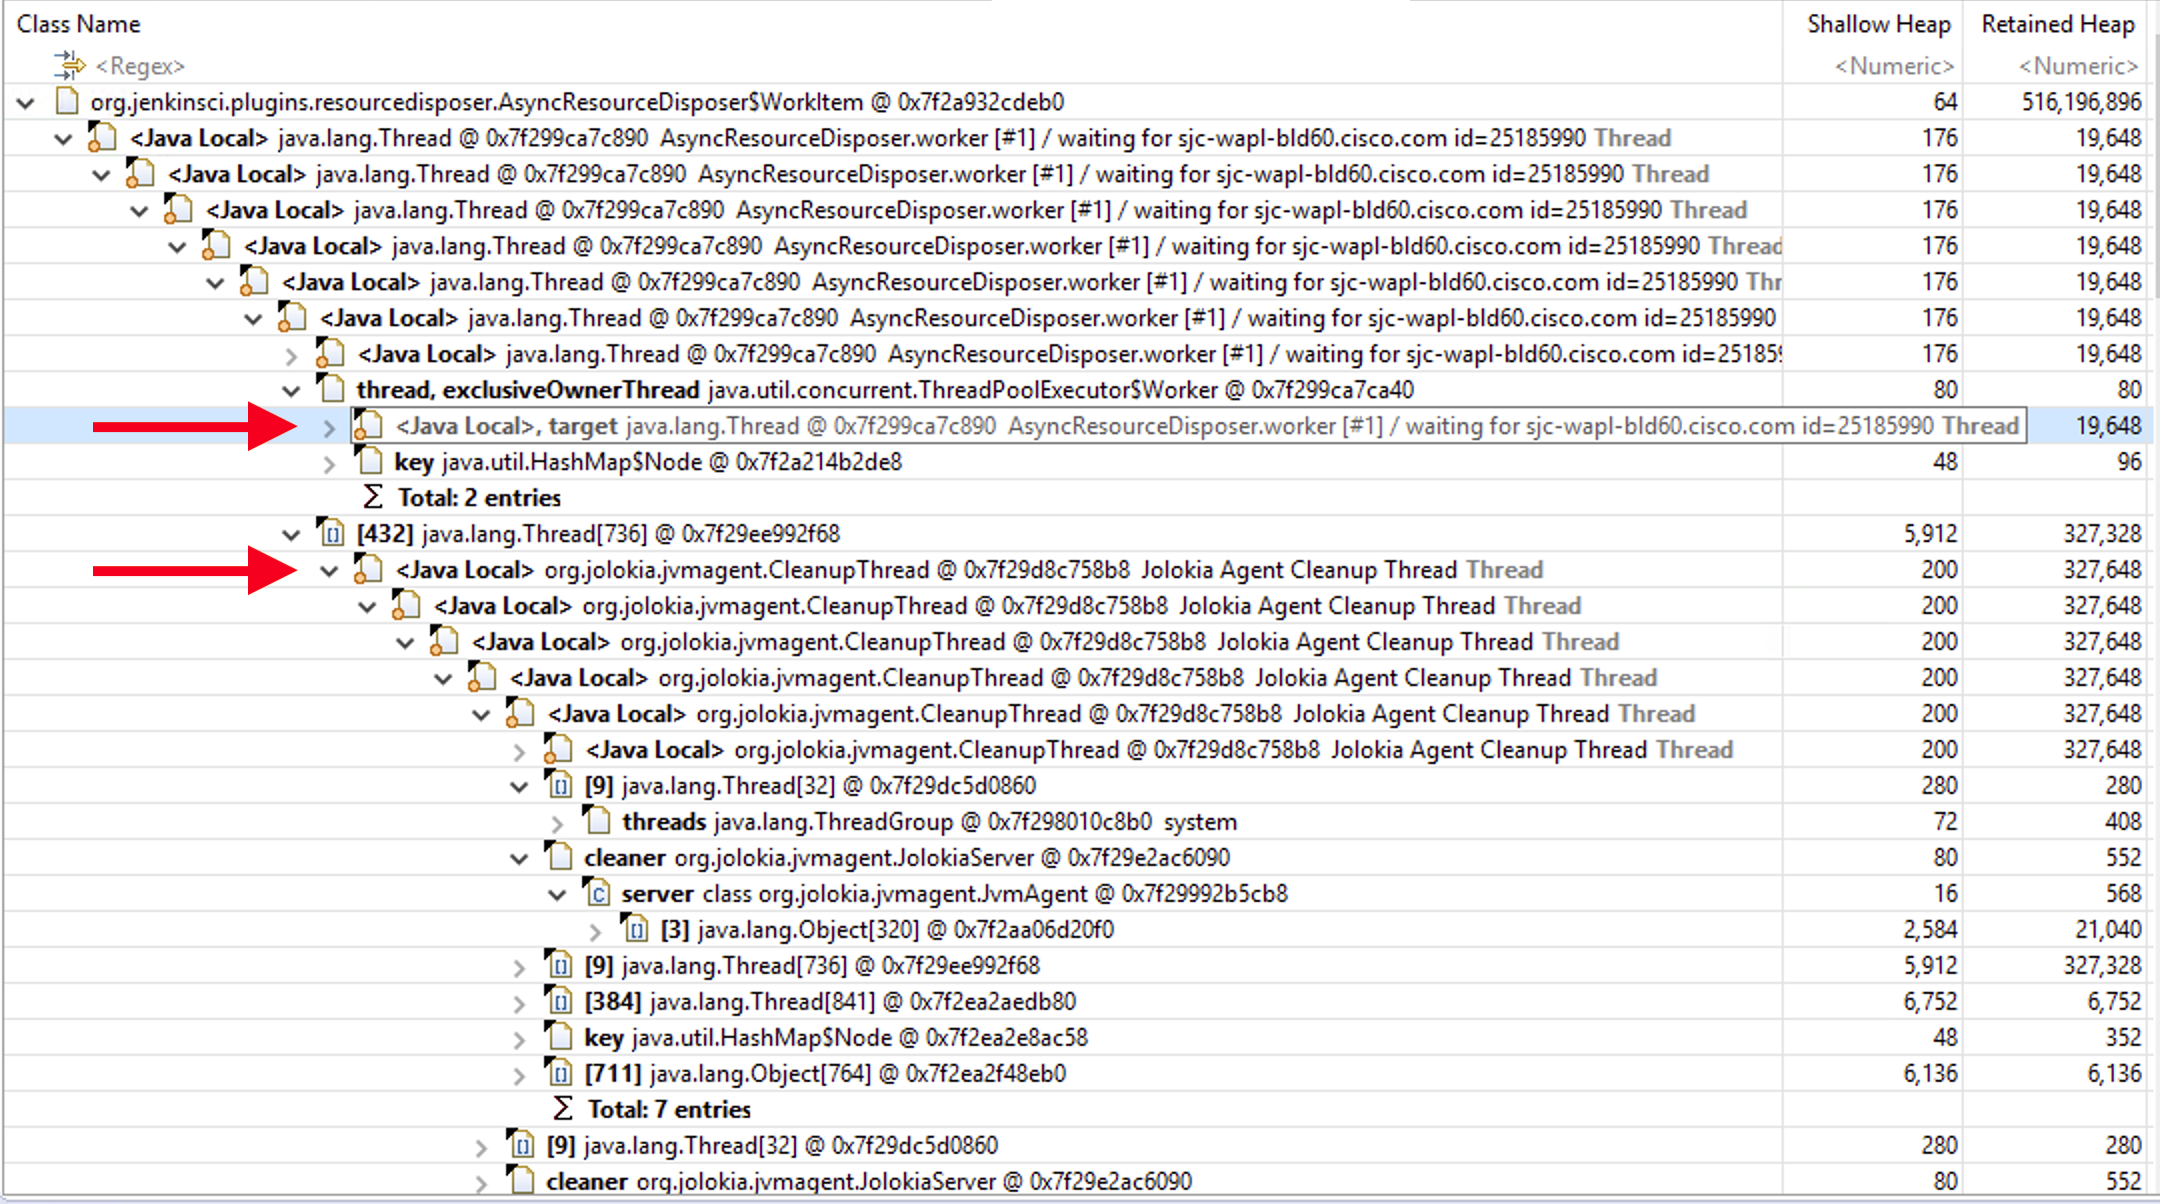
This may be exacerbated when using the Resource Disposer Plugin as it is attempting to remove directories, but is unable:

Note that this Jolokia CleanUpThread is present in every instance of this issue:

Environment
-
CloudBees Jenkins Enterprise (CJE)
-
CloudBees Jenkins Enterprise - Managed controller (CJE-MM)
-
CloudBees Jenkins Enterprise - Operations center (CJE-OC)
Resolution
Disabling the Resource Disposer may alleviate this issue, however, the root cause appears to be with the Jolokia JMX monitoring agent being invoked and as of this writing has not been addressed. Therefore, we recommend to disable Jolokia JXM Agent by removing the following JVM Arguments:
-Dcom.sun.management.jmxremote
-Dcom.sun.management.jmxremote.port=XXXX
-Dcom.sun.management.jmxremote.local.only=true/false