Required Data Analytics CJP
This article describes how to collect the minimum required information for Analytics on a CJP environment so that it can be efficiently troubleshooted.
If the required data is bigger than 50 MB you will not be able to use ZenDesk to upload all the information. On this case we would like to encourage you to use our upload service in order to attach all the required information.
Required Data check list
[ ] Confirm the version of Elasticsearch being used [ ] Upload the config/elasticsearch.yml [ ] Support bundle from OC and one CC [ ] Test connection screenshot from OC [ ] Proxy Configuration from CC and OC [ ] CC config.xml [ ] Elasticsearch quick health check [ ] Elasticsearch logs
Support bundles
A support bundle from both OC and one of the CCs which is supposed to report information to Elasticsearch. Please, follow the KB below in case you don’t know how to generate a support bundle.
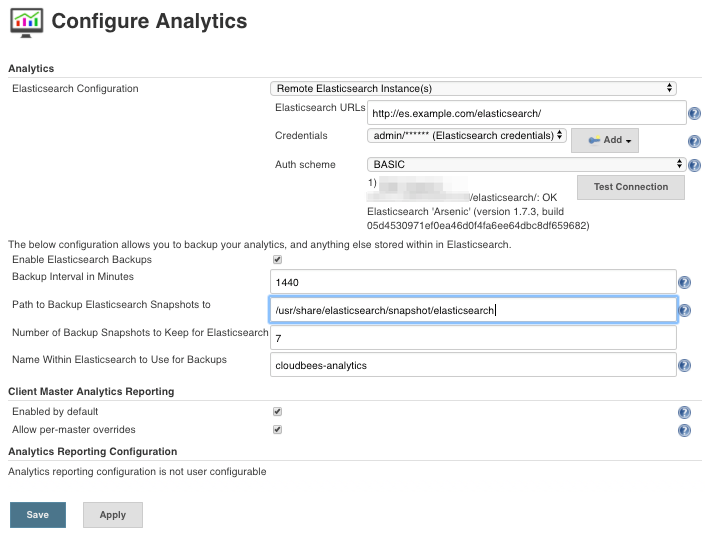
Test connection screenshot from OC
Go to Manage Jenkins -> Configure Analytics and hit the button Test Connection. After it, take a screenshot.

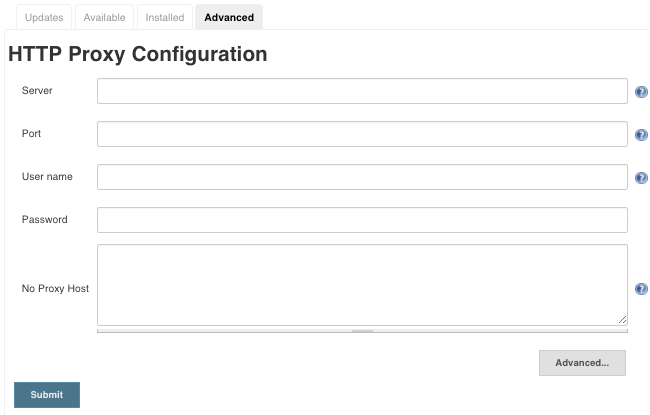
Proxy Configuration from CC and OC
Go to the CC and OC and take a screenshot of the Proxy configuration you can find under Manage Jenkins -> Manage Plugins [Advanced tab]. Notice, that if you are using a Proxy at OC level, then you need to add the hostname of the Elasticsearch instance in the Non Proxy host section. i.e: elasticsearch.jenkins.example.com.

CC config.xml
It is possible to access to the CC config.xml from OC UI. You just need to add at the end of the item URL config.xml. i.e https://<OC_URL>/job/Master-1/config.xml.
<com.cloudbees.opscenter.server.model.ManagedMaster plugin="operations-center-server@2.60.0.2">
<actions/>
<description/>
<id>0</id>
....
<com.cloudbees.opscenter.analytics.MasterReportingProperty plugin="operations-center-analytics@2.60.0.2">
<enabled>true</enabled>
</com.cloudbees.opscenter.analytics.MasterReportingProperty>
...