Symptoms
-
The Jenkins
javaprocess is being oom-killed. -
topanalysis shows unusual memory consumption outside of heap memory and metaspace memory.
Diagnosis/Treatment
-
Pre-conditions:
-
You have already confirmed heap utilization is normal through garbage collection log analysis.
-
You have already confirmed metaspace memory consumption is normal.
-
You are running a supported JDK which includes
jcmd. -
You are engaged with CloudBees Support via an existing support case.
Summary
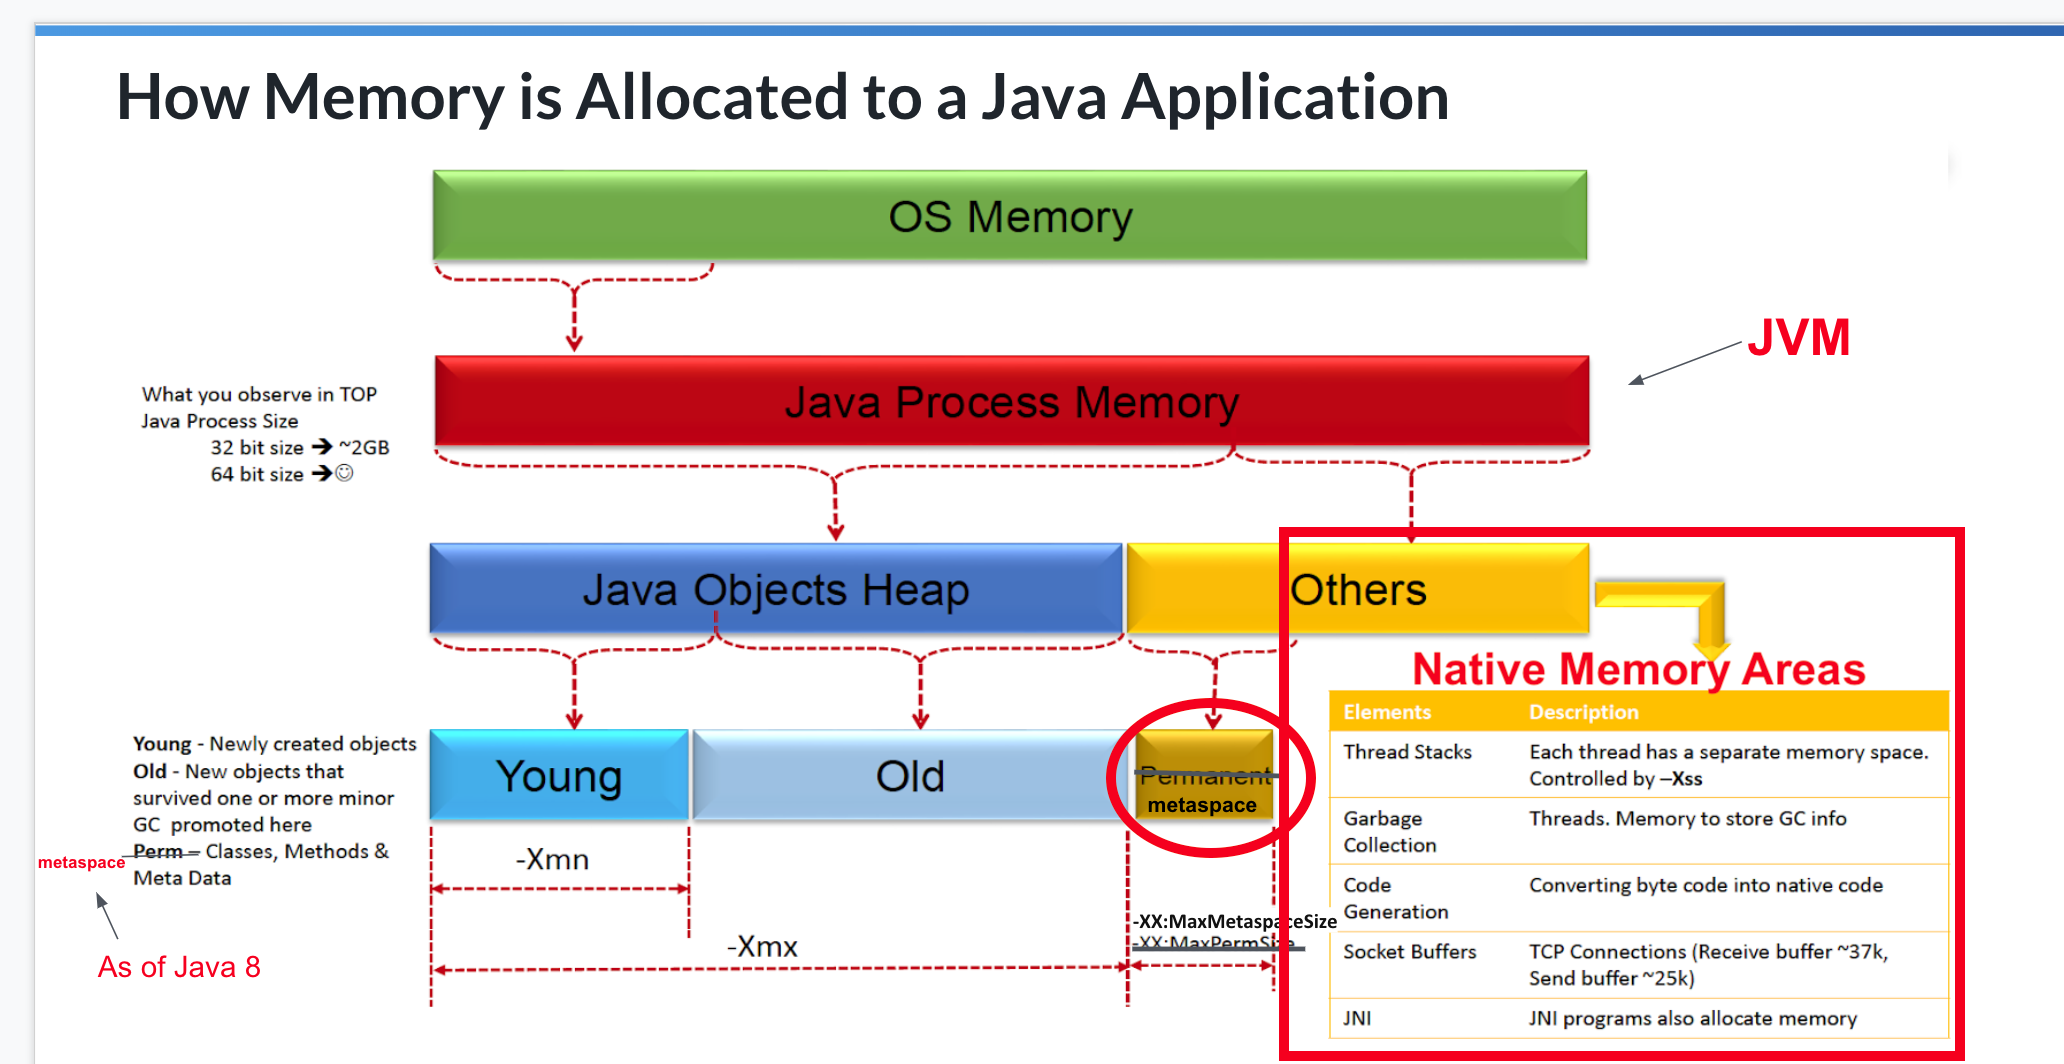
This article describes how to enable Java Native Memory Tracking to trace memory issues that may lie outside of the JVM Heap and Metaspace, as illustrated in the following picture:
Configure NMT Tracking
Step 1
First, you will need to add the JVM argument: -XX:NativeMemoryTracking=detail by following the instructions outlined here: How to add Java Arguments to Jenkins
In order for the new argument to take effect, the Jenkins java process must be restarted. It is recommended to do this during a scheduled maintenance window.
Step 2
To gather a summary, the following jcmd command can be run:
jcmd <pid> VM.native_memory summary
This will output a summary log similar to the following:
Native Memory Tracking:

Total: reserved=9769936KB +130080KB, committed=8644184KB +212676KB

-                 Java Heap (reserved=7340032KB, committed=7340032KB)
                            (mmap: reserved=7340032KB, committed=7340032KB)

-                     Class (reserved=1279073KB +47364KB, committed=262493KB +52484KB)
                            (classes #36038 +5114)
                            (malloc=9313KB +2308KB #183403 +54470)
                            (mmap: reserved=1269760KB +45056KB, committed=253180KB +50176KB)

-                    Thread (reserved=267357KB -41298KB, committed=267357KB -41298KB)
                            (thread #267 -40)
                            (stack: reserved=266176KB -41120KB, committed=266176KB -41120KB)
                            (malloc=870KB -132KB #1338 -200)
                            (arena=312KB -47 #529 -80)

-                      Code (reserved=278652KB +13258KB, committed=183820KB +90738KB)
                            (malloc=29052KB +13258KB #30409 +10291)
                            (mmap: reserved=249600KB, committed=154768KB +77480KB)

-                        GC (reserved=371875KB +18969KB, committed=371875KB +18969KB)
                            (malloc=66723KB +18969KB #364357 +127871)
                            (mmap: reserved=305152KB, committed=305152KB)

-                  Compiler (reserved=768KB -205KB, committed=768KB -205KB)
                            (malloc=637KB -205KB #3163 +746)
                            (arena=131KB #6)

-                  Internal (reserved=164392KB +103183KB, committed=164388KB +103179KB)
                            (malloc=164356KB +103179KB #69335 +8065)
                            (mmap: reserved=36KB +4KB, committed=32KB)

-                    Symbol (reserved=36296KB +3974KB, committed=36296KB +3974KB)
                            (malloc=31877KB +3623KB #359749 +42849)
                            (arena=4419KB +352 #1)

-    Native Memory Tracking (reserved=15871KB +3803KB, committed=15871KB +3803KB)
                            (malloc=43KB #500 +5)
                            (tracking overhead=15828KB +3804KB)

-               Arena Chunk (reserved=1284KB -18968KB, committed=1284KB -18968KB)
                            (malloc=1284KB -18968KB)

-                   Unknown (reserved=14336KB, committed=0KB)
                            (mmap: reserved=14336KB, committed=0KB)
Note that there are 11 different areas of memory consumption from the JVM. Most notably, "Java Heap" is the amount of heap space allocated to the JVM. Also, "Class" can be traced to metaspace, as this is where class metadata is stored. The other 9 areas should hover around 10-250MB, respectively. When we see areas of native memory above 1GB, it is considered abnormal.
Creating NMT summaries
Now that NMT Summarization is enabled, running the aforementioned jcmd command hourly should allow you to review any abnormalities of native memory.
With CloudBees CI on traditional platforms, this can be achieved programatically, either by running a simple script external to your instance, or by creating a job within the instance.
With CloudBees CI on modern cloud platforms, this can be achieved programatically by creating a job within the instance.
| Please keep in mind that collecting NMT data has roughly a 5-10% resource overhead cost to the JVM. |
Traditional Platforms
1.) Collecting the data with a Bash script
The following example will collect the data hourly when called from a cron trigger on the host OS.
#!/bin/bash
TSTAMP="$(date +'%Y%m%d_%H%M%S')"
jenkinsPid="$(pgrep -o java)"
nmtLog="$JENKINS_HOME/support/nmt.log"
echo $TSTAMP $JENKINS_CLUSTER_ID >> $nmtLog

jcmd $jenkinsPid VM.native_memory summary >> $nmtLog
Save this bash script as a file named nmtlogging.sh in $JENKINS_HOME/support.
Add the script to your crontab by running the following command:
crontab -e
Append the following entry:
0 * * * * JENKINS_HOME='/path/to/jenkins-home' $JENKINS_HOME/support/nmtlogging.sh
Replace /path/to/jenkins-home with the absolute path to your $JENKINS_HOME directory.
|
Save and close the file.
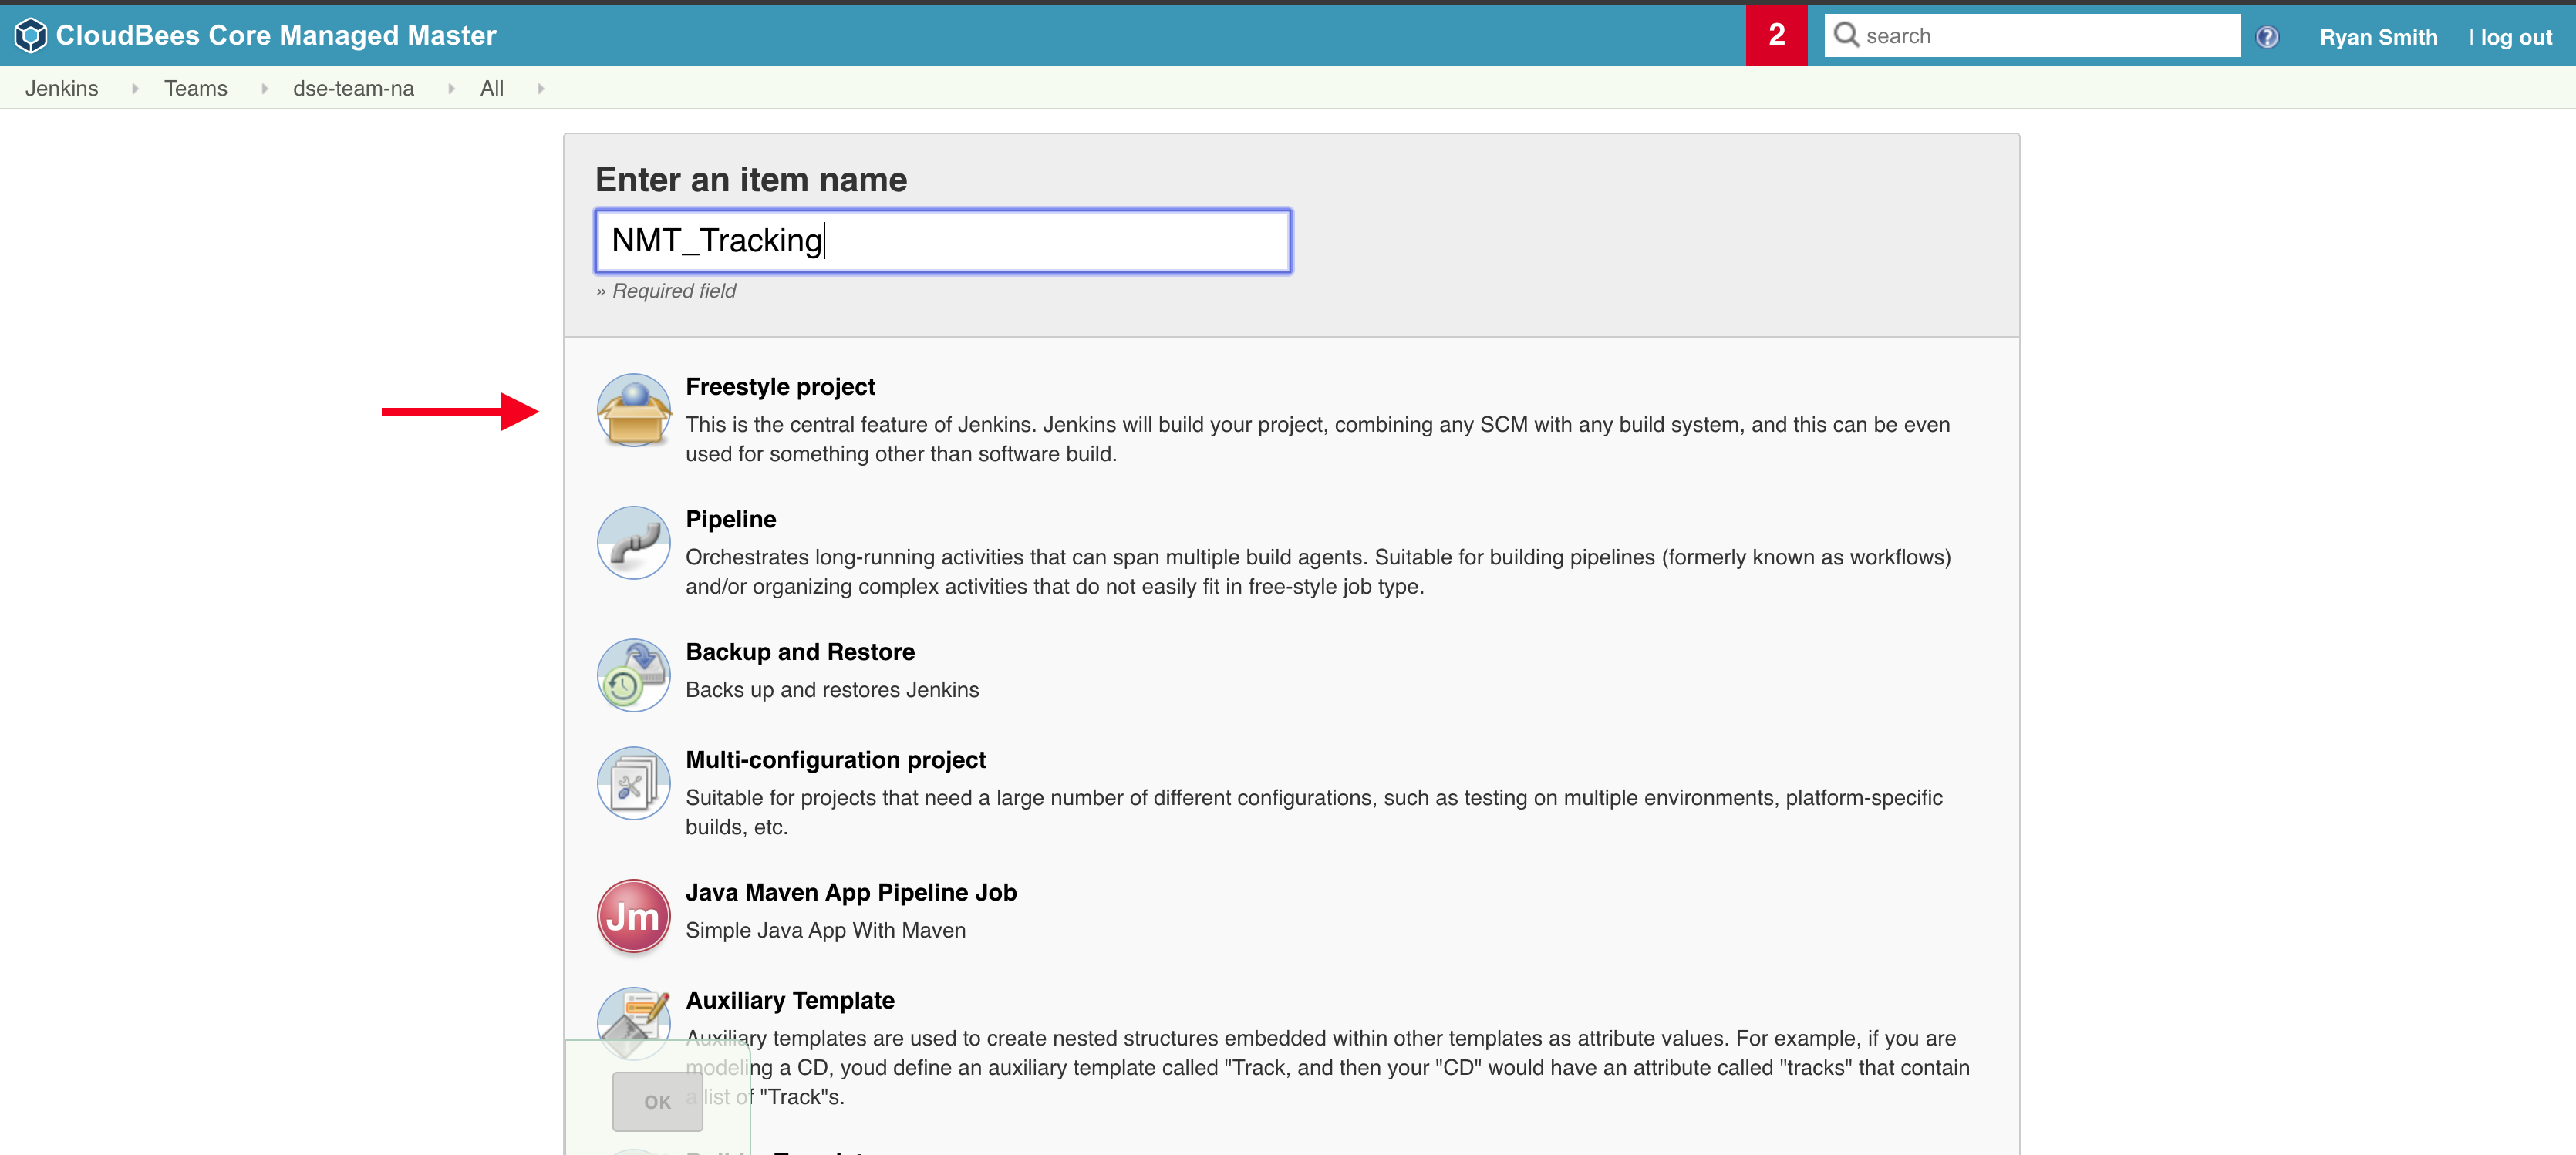
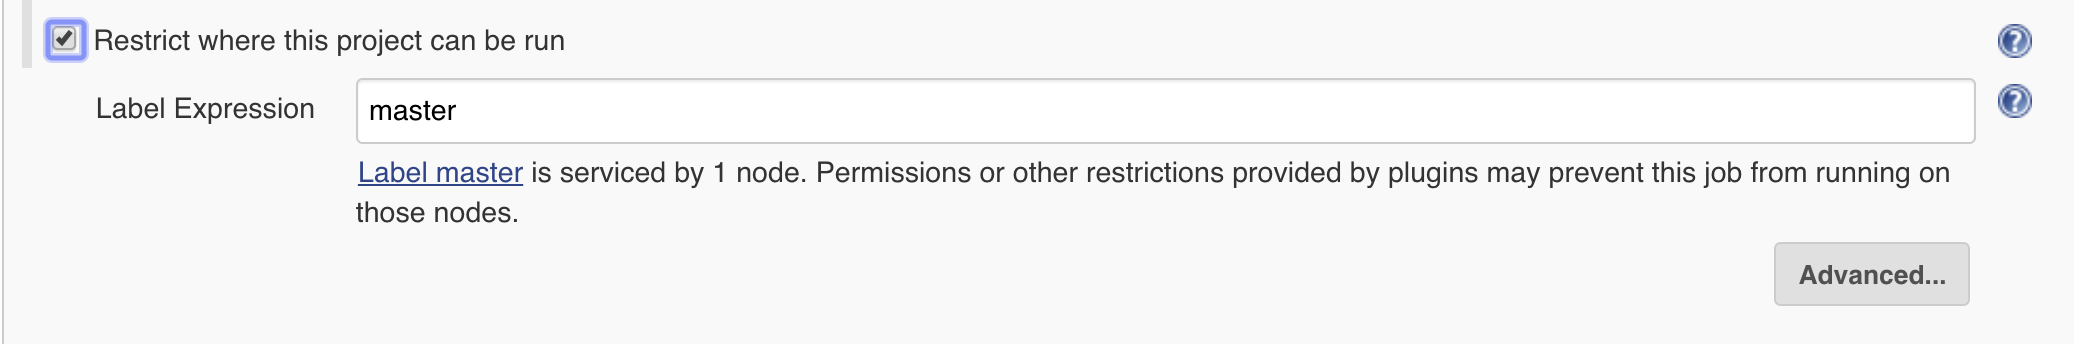
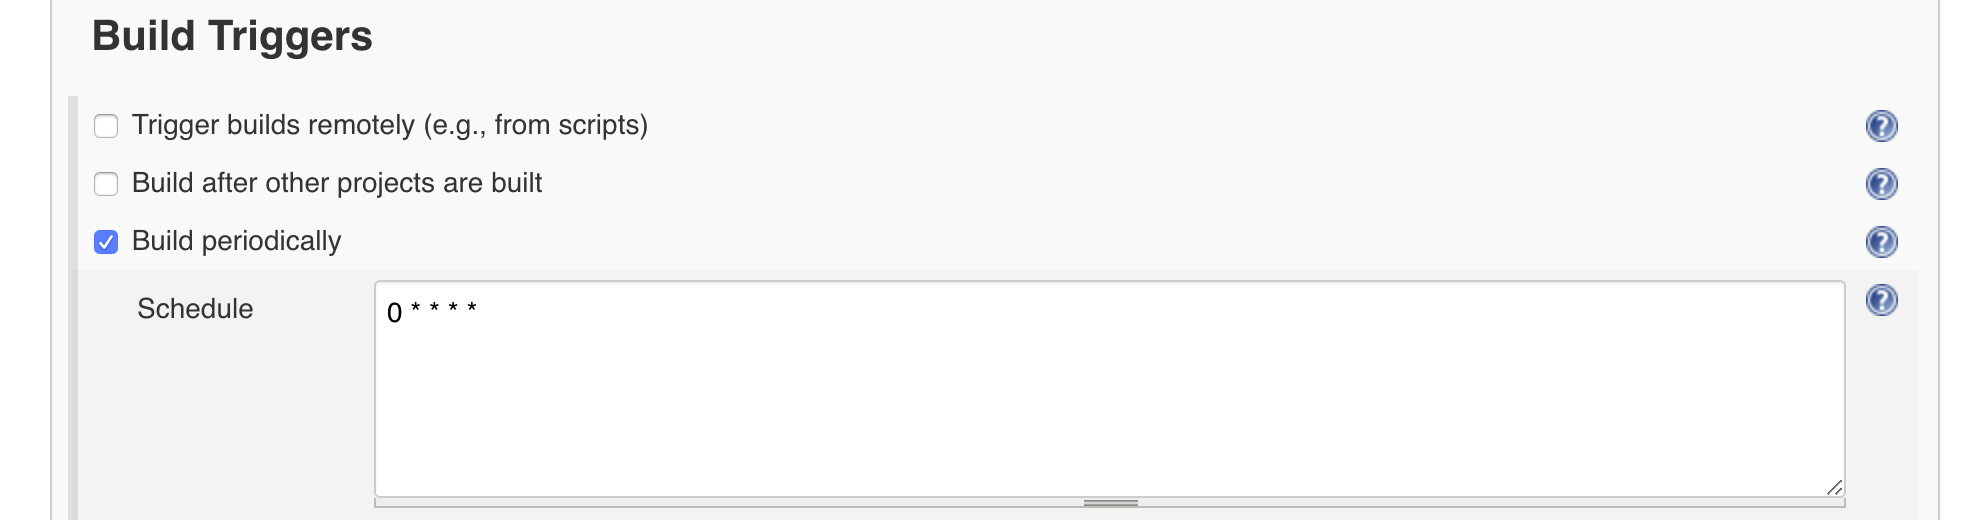
2a.) Collecting the data with a Freestyle job
Creating a new Freestyle job with a 'Build periodically' trigger will allow you to run the script above hourly as highlighted in the following screenshots:

2b.) Collecting the data with a Pipeline job
Creating a new Pipeline with the following Pipeline script will run the script above hourly.
pipeline {
    agent {
        // run on the built-in executor
        label 'main'
    }

    triggers {
        // run every hour
        cron('H * * * *')
    }

    stages {
        stage('Collect NMT summary') {
            steps {
                // modify path to JENKINS_HOME as needed
                sh '/var/jenkins_home/support/nmtlogging.sh'
            }
        }
    }
}
Modern Platforms
1.) Collecting the data with a Bash script and a job
The following example will collect the data hourly with a job that builds periodically.
#!/bin/bash
TSTAMP="$(date +'%Y%m%d_%H%M%S')"
jenkinsPid="$(jps | grep war | awk '{print $1}')"
nmtLog="$JENKINS_HOME/support/nmt.log"
echo $TSTAMP $JENKINS_CLUSTER_ID >> $nmtLog

jcmd $jenkinsPid VM.native_memory summary >> $nmtLog
In a local machine, save this bash script as a file named nmtlogging.sh.
Modify the script permissions with chmod 744 nmtlogging.sh.
Copy the script into $JENKINS_HOME/support. This typically can be done with the command kubectl cp -n NAMESPACE POD_NAME:/var/jenkins_home/support. Please replace NAMESPACE and POD_NAME according to your environment.
Follow the aformentioned steps in Collecting the data with a Freestyle job or Collecting the data with a Pipeline job to collect the data hourly.
Analyze NMT summaries
Once you have 24 hours of summary data appended to the $nmtLog, please upload them to your existing support ticket within CloudBees Support for review. If your archive is larger than 20Mb please use this service to send it to us. This service works best in Chrome or Firefox.
Tested product/plugin versions
CloudBees CI on modern cloud platforms - managed controller version 2.516.3.29358