Symptoms
-
Building times have increased since a particular build number
-
The builds are running slower than they used to
Diagnostic/Treatment
The following recommendations and techniques help to troubleshoot this issue and identify the root cause. They are based on experience with CloudBees customers.
Preconditions
-
The
Jenkinsfilehas not suffered any modification -
The source code has not changed around the time the build started to become slow.
-
The build process is slow across all the agents. Review the build history to find out if the build process is becoming slow on some agents and fast on others.
Environment
-
CloudBees CI (CloudBees Core) on modern cloud platforms - Managed controller
-
CloudBees CI (CloudBees Core) on modern cloud platforms - Operations Center
-
CloudBees CI (CloudBees Core) on traditional platforms - Client controller
-
CloudBees CI (CloudBees Core) on traditional platforms - Operations Center
Troubleshooting Process
There isn’t one simple way to troubleshoot a slow build, and the methods and tools you use will depend on what type of build you are running and the execution environment.
Stages
As starting point the Pipeline: Stage View helps you to identify the most time-consuming stage and how they have chnaged across the build numbers.

Agents
Executor starvation
If you see a little black clock icon in the build queue as shown below, it is an indication that your job is sitting in the queue unnecessarily (refer to Executor Starvation)
-
Make sure your agents follow Remoting Best Practices about number of executors
-
For Permanent Agents review Why are jobs on the queue when there are dedicated agents with free executors
-
For Shared Agents review Why do Shared Agents / Cloud show as suspended status while jobs wait in the queue
-
For Cloud Agent check things like Concurrency Limit (Cloud vs Container) or API limits.
-
For Kubernetes Agent review ResourceQuotas for the Namespace
-
The optimal scheduling mechanism depends on the use case per job:
-
Reuse Agent Workspaces as much as possible (SCM updates are more efficient than SCM checkouts): Default Jenkins Behavior. However since Kubernetes era, it is a better approach to optimize caching of dependencies (e.g. Decrease Maven Build times in OpenShift Pipelines using a Persistent Volume Claim)
-
Select idle nodes absolutely over nodes that are doing something: Even Loading Strategy (Requires the [ci-plugin:cloudbees-even-scheduler not found]).
-
Performance
-
Firstly, validate that the computer capabilities of the agent (especially the CPU) have not suffered from any modification. Note that in CloudBees CI on Modern the Pod spec of the agent can be constrained by its limits impacting negatively in the building performance times if it is not correctly configured.
-
While the build is running, collect data on the machine/container that is running that build by running:
a) If on a traditional virtual machine or bare metal machine, run:
mkdir slowBuildData cd slowBuildData while true; do top -w 300 -bc -n 1 > topOutput.$(date +%Y%m%d%H%M%S).txt vmstat -t > vmstat.$(date +%Y%m%d%H%M%S).txt sleep 5 done
(depending on the version of top installed on your machine, you may need to modify options that are not supported in your version of top)
b) If the build is running inside of Kubernetes:
export POD_ID=podThatIsRunningTheSlowBuild mkdir slowBuildData cd slowBuildData while true; do (kubectl exec $POD_ID -- top -w 300 -bc -n 1 ) > topOutput.$(date +%Y%m%d%H%M%S).txt (kubectl exec $POD_ID -- vmstat -t ) > vmstat.$(date +%Y%m%d%H%M%S).txt sleep 5 done
Once the build is complete, press ctrl-c to stop collecting data.
-
Now we can make use of that data to try to find possible reasons for a slow build. We will first check what the top 10 CPU utilizations were in the user process space by running:
grep '%Cpu' logs/topOutput.* | awk '{print $2 " " $3 " " $4 " " $5}' | sort -n | tail -10 5.0 us, 1.7 sy, 5.1 us, 0.0 sy, 5.1 us, 0.0 sy, 5.8 us, 2.5 sy, 6.1 us, 1.7 sy, 6.5 us, 1.6 sy, 6.7 us, 0.8 sy, 6.8 us, 1.7 sy, 7.6 us, 0.0 sy, 10.0 us, 0.0 sy,
In this case, we can see that we only got a peak of 10 % user CPU at the most, so this does not appear to be a root cause of the slow build.
-
Next we are going to check for Sys CPU (CPU time spent inside of the kernel), and it also barely peaked over 11 % sys CPU:
grep '%Cpu' logs/topOutput.* | awk '{print $4 " " $5 " " $2 " " $3}' | sort -n | tail -10 4.2 sy, 1.7 us, 4.2 sy, 2.5 us, 4.9 sy, 0.0 us, 5.0 sy, 3.3 us, 7.6 sy, 0.8 us, 8.3 sy, 1.7 us, 9.0 sy, 2.5 us, 9.8 sy, 0.8 us, 10.3 sy, 3.4 us, 11.6 sy, 0.8 us,
In my example, we took over 1326 samples, and the above shows the top 10 user CPU and sys CPU, and both of them peaked around 10-11%, so it seems this job is not CPU bound at all.
-
Next looking for IO wait, and we see that the top 10 'cpu wa' (cpu waiting for IO) entries are all zero:
head -2 logs/vmstat.20190201154336.txt | tail -1 | awk '{print $16}'; (for f in logs/vmstat*; do tail -1 $f; done) | awk '{print $16}' | sort | tail -10 wa 0 0 0 0 0 0 0 0 0 0
This is surprisingly low IO wait, so I’m checking for IO wait in the top output, and I also see there is almost no IO wait:
grep '%Cpu' logs/topOutput.* | awk -F',' '{ print $5}' | sort -n | tail -10 0.0 wa 0.0 wa 0.0 wa 0.0 wa 0.0 wa 0.0 wa 0.0 wa 0.0 wa 0.8 wa 0.8 wa
Hence I see no evidence of IO wait.
-
Checking if we were low on RAM during the build, I see no evidence of this at all:
grep 'MiB Mem' logs/topOutput.* | awk -F',' '{print $2}' | sort -n | head -10 3795.5 free 3796.1 free 3796.6 free 3796.7 free 3796.9 free 3797.2 free 3797.4 free 3797.8 free 3798.0 free 3798.0 free
For more analysis of Linux RAM usage, we need to look at the buff/cache ram as well, which I did not go into since there was enough free at this point. For more details please see https://www.linuxatemyram.com/ .
Steps
A couple of options here:
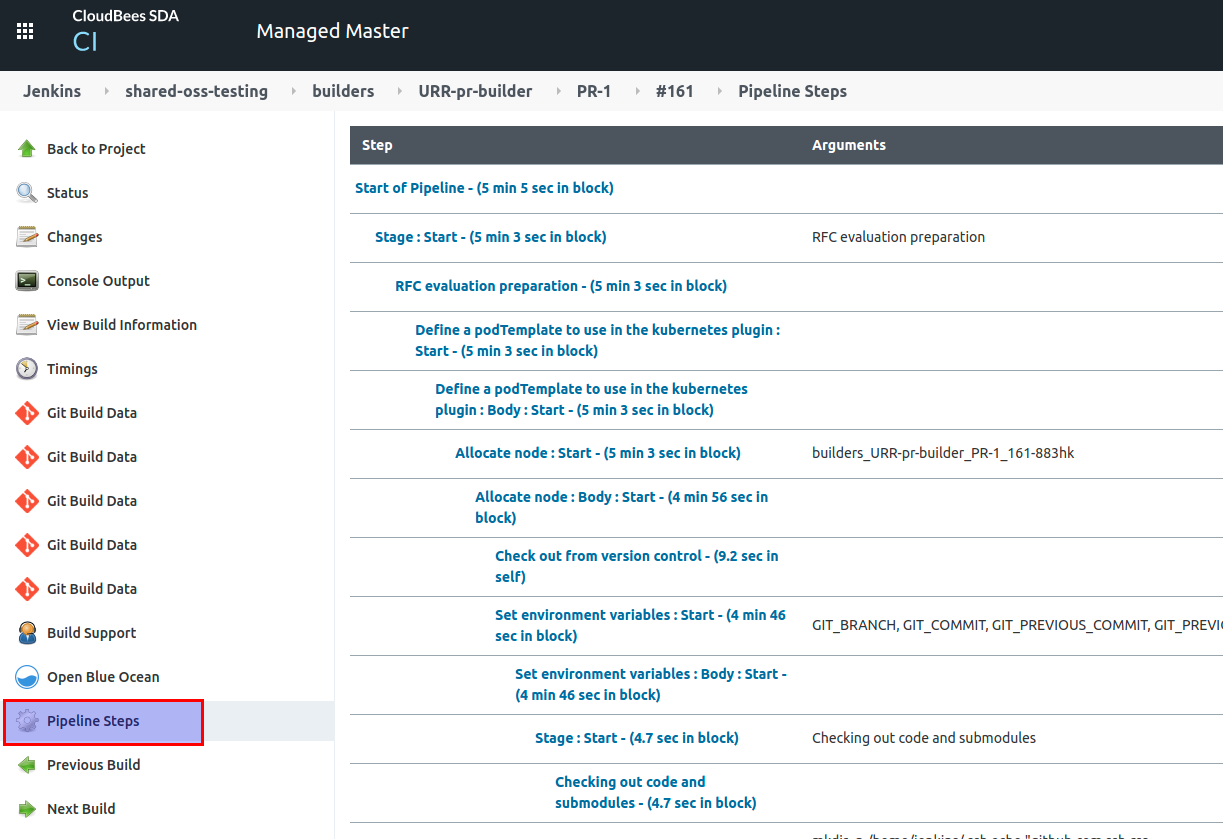
Pipeline Steps
The Pipeline Steps option in the left hand side of a build menu brings a list with times per step.

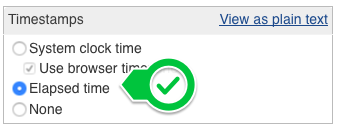
Timestamper
The Timestamper plugin elapsed time mode helps you to identify the most time-consuming steps.

Then look through the build log to look for when there are large gaps in the build log timings, and focus on the parts that took a long time:

Addtionally, you can sort the build steps by their times by importing the console output as *.CSV into a spreadsheet
-
Use delimiter to split the
Elapse Timefrom theEVENT(e.g.])
| Elapse Time | EVENT |
|---|---|
00:00:16.15 |
8mha:////4KP/4Pf+epvfkRScTh/Od/EhPv9bp+DJvtREVK8n7tRzAAAAm LCAAAAAAAAP9b85aBtbiIQTGjNKU4P08vOT+vOD8nVc83PyU1x6OyILUoJzMv2y |
00:00:00.15 |
> git rev-parse --is-inside-work-tree # timeout=10 |
00:00:00 |
Setting origin to ssh://git@example.com:7999/my-repos/my-projects.git |
… |
… |
00:01:52.76 |
> Task :compileKotlin |
… |
… |
-
After that, sort the table by the
Elapse Time:
| Elapse Time | EVENT |
|---|---|
00:01:52.76 |
> Task :compileKotlin |
00:01:22.82 |
[8mha:////4K5xCkOsmh9+gnIwabjnTGF4g/TnT1Q8ptTnVrhxTZdEAAAAqB+LCAAAAAAAAP9tjTEOwjAUQ3+LOrAycohUYoABMXWNsnCC0ISQNvq/ |
00:01:08.57 |
+ npm i |
… |
… |
Alternatively, you could calculate the elapsed time from timestamp as follows
-
Clean up the timestamp to get only the time for the event (T1)
-
Duplicate the time column and copy its value into a new column T2 but shifting up the first time record, in other words adding the starting time for the next event.
| T1 (this) | T2 (next) | T2-T1 | TIMESTAMP | EVENT |
|---|---|---|---|---|
18:56:19.358 |
18:56:35.508 |
00:00:16.15 |
2021-02-15T18:56:19.358Z |
8mha:////4KP/4Pf+epvfkRScTh/Od/EhPv9bp+DJvtREVK8n7tRzAAAAm LCAAAAAAAAP9b85aBtbiIQTGjNKU4P08vOT+vOD8nVc83PyU1x6OyILUoJzMv2y |
18:56:35.508 |
18:56:35.662 |
00:00:00.15 |
2021-02-15T18:56:35.508Z |
> git rev-parse --is-inside-work-tree # timeout=10 |
18:56:35.51 |
18:56:35.662 |
00:00:00 |
2021-02-15T18:56:35.662Z |
Setting origin to ssh://git@example.com:7999/my-repos/my-projects.git |
… |
… |
… |
… |
… |
19:03:43.094 |
19:05:35.853 |
00:01:52.76 |
2021-02-15T19:03:43.094Z |
> Task :compileKotlin |
… |
… |
… |
… |
… |