If you are experiencing issues accessing a CloudBees Core Operations Center running on modern platforms, we recommend reviewing:
Issues
-
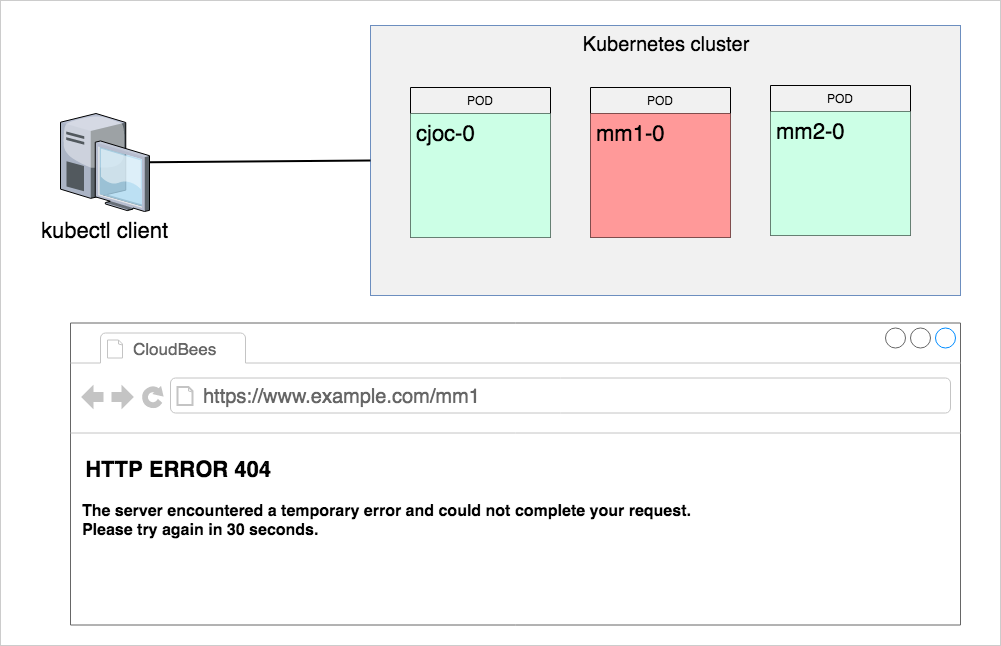
CloudBees managed controller running on Kubernetes reports HTTP ERROR 404 in the browser.
-
Unable to access Jenkins controller from the browser.
-
Jenkins controller fails to start after an upgrade on Kubernetes.
-
The server encountered a temporary error and could not complete your request. Please try again in 30 seconds.
The HTTP 404 Not Found error indicates that the web page you were attempting to access could not be found on the server. It is a client-side error, meaning that the server did not find anything matching the requested URI. There is no indication of whether this condition is temporary or permanent. This status code is often used when the server does not wish to disclose the reason for the refusal or when no other response is appropriate.
Description
This routing diagnostic guide helps to troubleshoot network issues relating to one of the members of the CloudBees Core on Modern Platforms, which means that you are running CloudBees Core on a Kubernetes cluster. We assume the reader has already followed the CloudBees installation guide, and that every component of the cluster was configured as recommended in the following guides:
For whatever reason, the questioned managed controller, say mm1, does not work as expected. Most likely, the issue is related to a Kubernetes network misconfiguration that prevents the controller from being provisioned, respond to requests, and being accessed in a browser. The following chart schematically shows the CloudBees Core running on a Kubernetes cluster, an administrative kubectl agent and a user browser that renders the problem.
General health-check tests
Answer the questions below to narrow down the root cause for the outage; it will save you time in fixing it. For the sake of illustration, we use mm1 managed controller in the diagnostic steps.
1.] Can you access the Operations Center (CJOC) from a browser?
No. Use kubectl to further troubleshoot the Kubernetes cluster. Validate the status of Operations Center (cjoc-0) pod. Most likely, the outage is more general and goes beyond a single controller.
2.] Can you access the questioned controller from a browser; have you tried the incognito mode?
The controller is not accessible from any browser.
3.] Is there any other CloudBees managed controller that you can access from a browser?
Yes. Try to access the questioned controller pod with kubectl. It is possible that the JENKINS_HOME folder is accessible. In this case, having an auto-generated support bundles from the JENKINS_HOME/support folder will help. Continue with this guide to get the explicit steps.
4.] Can you successfully provision a brand new managed controller?
Yes. The solution is therefore to identify the broken piece of configuration for the questioned controller.
5.] Does the Managed controller Configuration in the Operations Center (CJOC) UI show that the controller is started?
Check to see if the CJOC considers the service to be running by clicking the Configure option on the Managed controller.
Try to stop and start the managed controller and ensure there are no errors in the UI Provisioning log. After a start operation if any errors are returned you will need to select Acknowledge Error in the lefthand menu of this UI as well to see if connection is restored.
6.] Do the messages below show among the Operations Center (CJOC) while provisioning the controller?
Sample error Messages:
[Normal][PersistentVolumeClaim][your_controller_pod_name_here][ExternalProvisioning] waiting for a volume to be created, either by external provisioner "example.com/aws-efs" or manually created by system administrator
[Warning][Pod][your_controller_pod_name_here][FailedScheduling] pod has unbound immediate PersistentVolumeClaims
Yes. This is telling us that the PVC cannot be bound to the underlying PV, hence the pod cannot start. You should contact your Kubernetes support team for a deeper analysis as they will need to review the controller logs.
HTTP diagnostics with curl
You are going to run curl commands to send HTTP requests to the questioned master
curl -I https://example.com/mm1/login
         |       |           |
         |       |           |__ managed controller name, i.e. --prefix value
         |       |
         |       |__ external domain name, the one you use in a browser to access CloudBees Core
         |
         |__ http or https
When you send curl requests to a healthy CloudBees Core controller it responds with the HTTP/1.1 200 OK status.
HTTP/1.1 200 OK
1.] Check the questioned controller with curl
A healthy CloudBees Core controller should be accessible on the network. Open a Linux terminal on any appropriate desktop and run
curl -I https://example.com/mm1/login
The full output should be similar to
HTTP/1.1 200 OK
Server: openresty/1.15.8.1
Date: Mon, 23 Sep 2019 06:44:39 GMT
Content-Type: text/html;charset=utf-8
Content-Length: 1966
Connection: keep-alive
Vary: Accept-Encoding
X-Content-Type-Options: nosniff
Expires: Thu, 01 Jan 1970 00:00:00 GMT
Cache-Control: no-cache,no-store,must-revalidate
X-Hudson: 1.395
X-Jenkins: 2.176.3.2
X-Jenkins-Session: 6a97d870
X-Hudson-CLI-Port: 50001
X-Jenkins-CLI-Port: 50001
X-Jenkins-CLI2-Port: 50001
X-Frame-Options: sameorigin
X-Instance-Identity: MIIBIjANBgkqhkiG9w0BAQEFAAOCAQ8AM...
Set-Cookie: JSESSIONID.REDACTED;Path=/mm1;HttpOnly
HTTP/1.1 404
If the controller responds with HTTP ERROR 404 in the browser, most likely, you will see a similar response to curl requests
curl -I https://example.com/mm1/login
output from a non-responding master
HTTP/1.1 404 Not Found
Server: openresty/1.15.8.1
Date: Mon, 23 Sep 2019 04:56:50 GMT
Content-Type: text/html
Content-Length: 159
Connection: keep-alive
HTTP/1.1 503 Service Unavailable
The 503 Service Unavailable error is an HTTP status code that means the web server is not available right now. Most likely, the Jenkins instance is restarting, too busy, or is not ready to handle the request.
HTTP/1.1 503 Service Unavailable
Server: openresty/1.15.8.1
Date: Mon, 23 Sep 2019 05:03:46 GMT
Content-Type: text/html;charset=utf-8
Content-Length: 1056
Connection: keep-alive
X-Content-Type-Options: nosniff
Expires: 0
Cache-Control: no-cache,no-store,must-revalidate
Cluster level diagnostics with kubectl
1.] Check the status of the questioned controller pod. Is the pod running?
kubectl get pod mm1-0 -o wide
expected output
NAME      READY     STATUS    RESTARTS   AGE       IP           NODE
mm1-0     1/1       Running   0          1m        10.52.25.3   gke-cluster-example-core-controllers-72f5634a-txbz
2.] Pod events key (last section in the output)
Describe the controller pod and review the Events key (last section in the output)
kubectl describe pod mm1-0
3.] Check the location of JENKINS_HOME folder
The default (CloudBees Core 2.190.x.x) location of the JENKINS_HOME folder is /var/jenkins_home. Run
kubectl describe pod mm1-0 | grep jenkins_home
expected output
/var/jenkins_home from jenkins-home (rw)
4.] Check whether the pod responds to shell commands, and validate that the volumes are mounted
kubectl exec -ti mm1-0 -- df -h
expected output reads as follows
Filesystem      Size  Used Avail Use% Mounted on
overlay          95G  4.6G   90G   5% /
tmpfs            64M     0   64M   0% /dev
tmpfs           7.4G     0  7.4G   0% /sys/fs/cgroup
/dev/sda1        95G  4.6G   90G   5% /etc/hosts
/dev/sdc        9.8G  639M  8.7G   7% /var/jenkins_home
shm              64M     0   64M   0% /dev/shm
tmpfs           7.4G   12K  7.4G   1% /run/secrets/kubernetes.io/serviceaccount
tmpfs           7.4G     0  7.4G   0% /proc/acpi
tmpfs           7.4G     0  7.4G   0% /proc/scsi
tmpfs           7.4G     0  7.4G   0% /sys/firmware
5.] Verify that the JENKINS_HOME partition has available disk space
Yes. Jenkins instance has decent amount of available disk space. Access JENKINS_HOME folder inside the container. List the content of JENKINS_HOME folder.
kubectl exec mm1-0 -- ls /var/jenkins_home
6.] Check read/write access to the JENKINS_HOME folder
Validate that the persistent volume resource accepts read/write operations
kubectl exec -ti mm1-0 -- bash -c 'echo "OK" > /var/jenkins_home/~writeTest.log \
  && cat /var/jenkins_home/~writeTest.log \
  && rm /var/jenkins_home/~writeTest.log'
The expected output is OK.
7.] Can you get the Jenkins log?
kubectl logs -f --tail 100 mm1-0
Analyze the output. Does it provide additional clues? Use Ctrl + c to quit the log mode.
8.] What is the last trace/error in the log?
The log files could vary significantly between instances as different levels of verbosity are allowed. In addition, you may see traces related to controller configurations, installed plugins, and bootstrap scripts. The following traces are the most critical to assess healthiness of the provisioned managed controller.
[Mon Sep 23 06:40:36 GMT 2019] Requested provisioning successfully.
[Mon Sep 23 06:40:38 GMT 2019] Requested start successfully
[Mon Sep 23 07:41:38 GMT 2019][Normal][Pod][mm1-0][Pulled] Successfully pulled image "cloudbees/cloudbees-core-mm:2.176.3.2"
[Mon Sep 23 07:41:38 GMT 2019][Normal][Pod][mm1-0][Started] Started container jenkins
[Mon Sep 23 06:43:02 GMT 2019] Accepting initial connection from https://example.com/mm1/ on 10.52.25.3/10.52.25.3:39202 with identity f1:8d:d6:f6:5e:ed:fe:25:17:38:12:c0:cb:ce:a1:d6 (STORED)
[Mon Sep 23 06:43:14 GMT 2019] Connected
[Mon Sep 23 09:01:55 GMT 2019] Checking license validity...
[Mon Sep 23 09:01:55 GMT 2019] License will expire in 2 days 22 hr (not before next check)
[Mon Sep 23 09:01:55 GMT 2019] Current license is valid
9.] Does Jenkins log update in real time?
Yes. Analyze the output.
10.] Access (get a shell to a running container) the questioned controller pod.
kubectl exec -ti mm1-0 -- bash
To check whether Jenkins instance is started, i.e. java process is running, run
ps -eaf | grep java
expected output
jenkins        7       1 23 06:41 ?        00:03:05 java -Dhudson.slaves.NodeProvisioner.initialDelay=0 -Xbootclasspath/p:/usr/share/jenkins/alpn-boot.jar -Duser.home=/var/jenkins_home -Xmx2150m -Xms2150m -Djenkins.model.Jenkins.slaveAgentPort=50001 -Djenkins.install.runSetupWizard=true -Dhudson.lifecycle=hudson.lifecycle.ExitLifecycle -Duser.timezone=PST -DMASTER_NAME=mm1 -Dcb.BeekeeperProp.autoInstallIncremental=true -Djenkins.model.Jenkins.slaveAgentPortEnforce=true -DMASTER_GRANT_ID=0db2670e-c797-48b3-9042-e997207bf6be -Dcb.IMProp.warProfiles.cje=kubernetes.json -DMASTER_INDEX=0 -DMASTER_OPERATIONSCENTER_ENDPOINT=https://cjoc.example.svc.cluster.local/cjoc/ -Dcb.BeekeeperProp.noFullUpgrade=true -Dhudson.DNSMultiCast.disabled=true -DMASTER_ENDPOINT=https://example.com/mm1/ -XX:NativeMemoryTracking=summary -jar -Dcb.distributable.name=Docker Common CJE -Dcb.distributable.commit_sha=49e35b48176fc789078f52e12f8fb09382da938a /usr/share/jenkins/jenkins.war --webroot=/tmp/jenkins/war --pluginroot=/tmp/jenkins/plugins --prefix=/mm1/
jenkins     1334    1311  0 06:54 pts/0    00:00:00 grep java
Network diagnostics
1.] Start by identifying the internal IP address and ports of the questioned pod
kubectl describe pod mm1-0 | grep -E "IP|Ports"
expected output
IP:                 10.52.25.3
Ports:              8080/TCP, 50001/TCP
Host Ports:         0/TCP, 0/TCP
2.] Check network statistics for the questioned pod
kubectl exec -ti mm1-0 -- netstat -tupe
expected output shows established connections
Active Internet connections (w/o servers)
Proto Recv-Q Send-Q Local Address           Foreign Address         State       User       Inode      PID/Program name
tcp        0      0 mm1-0.mm1.cje-sup:39202 cjoc.cje-support-:50000 ESTABLISHED jenkins    97862      7/java
tcp        0      0 mm1-0.mm1.cje-sup:45014 kubernetes.default.:443 ESTABLISHED jenkins    97824      7/java
tcp        0      0 mm1-0.mm1.cje-supp:8080 10.52.25.1:35292        TIME_WAIT   root       0          -
tcp        0      0 mm1-0.mm1.cje-supp:8080 10.52.25.1:35248        TIME_WAIT   root       0          -
tcp        0      0 mm1-0.mm1.cje-sup:45018 kubernetes.default.:443 ESTABLISHED jenkins    99765      7/java
tcp        0      0 mm1-0.mm1.cje-supp:8080 10.52.21.8:49890        TIME_WAIT   root       0          -
tcp        0      0 mm1-0.mm1.cje-supp:8080 10.52.21.8:49876        ESTABLISHED jenkins    117321     7/java
tcp        0      0 mm1-0.mm1.cje-supp:8080 10.52.25.1:35272        TIME_WAIT   root       0          -
tcp        0      0 mm1-0.mm1.cje-supp:8080 10.52.25.1:35264        TIME_WAIT   root       0          -
tcp        0      0 mm1-0.mm1.cje-supp:8080 10.52.25.1:35256        TIME_WAIT   root       0          -
tcp        0      0 mm1-0.mm1.cje-supp:8080 10.52.21.8:49892        TIME_WAIT   root       0          -
tcp        0      0 mm1-0.mm1.cje-supp:8080 10.52.21.8:49880        TIME_WAIT   root       0          -
tcp        0      0 mm1-0.mm1.cje-supp:8080 10.52.21.8:49874        TIME_WAIT   root       0          -
tcp        0      0 mm1-0.mm1.cje-supp:8080 10.52.25.1:35280        TIME_WAIT   root       0          -
tcp        0      0 mm1-0.mm1.cje-sup:44990 kubernetes.default.:443 ESTABLISHED jenkins    99734      7/java
tcp        0      0 mm1-0.mm1.cje-supp:8080 10.52.21.8:49888        TIME_WAIT   root       0          -
Pod open ports
1.] Validate the configured ports are open on the questioned controller.
Run netcat tool on cjoc-0 pod to probe open ports of the questioned controller pod
kubectl exec -ti cjoc-0 -- nc -zv 10.52.25.3 8080
kubectl exec -ti cjoc-0 -- nc -zv 10.52.25.3 50001
expected outputs
10.52.25.3 (10.52.25.3:8080) open
10.52.25.3 (10.52.25.3:50001) open
Service diagnostics and routing
1.] Check the Service that defines access to the questioned controller pod. You should see Service of type ClusterIP
kubectl get services mm1 -o wide
the output
NAME      TYPE        CLUSTER-IP      EXTERNAL-IP   PORT(S)            AGE       SELECTOR
mm1       ClusterIP   10.55.249.188   <none>        80/TCP,50001/TCP   41m       com.example.cje.tenant=mm1
2.] Describe the service and validate that the TargetPorts are set correctly
kubectl describe service mm1 | grep -E "IP|Port"
the output
Type:              ClusterIP
IP:                10.55.249.188
Port:              http  80/TCP
TargetPort:        8080/TCP
Port:              agent  50001/TCP
TargetPort:        50001/TCP
3.] Validate the service object for the questioned controller
Validate that the TargetPort are open
kubectl exec -ti cjoc-0 -- nc -zv mm1 80
kubectl exec -ti cjoc-0 -- nc -zv mm1 50001
expected outputs
mm1 (10.55.249.188:80) open
mm1 (10.55.249.188:50001) open
4.] Describe the ingress object for the questioned controller
Describe the ingress object and review Address and Host values
kubectl describe ing mm1
expected output
Name:             mm1
Namespace:        cje-example
Address:          35.190.219.203
Default backend:  default-http-backend:80 (<none>)
Rules:
  Host                            Path  Backends
  ----                            ----  --------
  example.com
                                  /mm1/   mm1:80 (10.52.31.29:8080)
Annotations:
  ingress.kubernetes.io/proxy-body-size:                50m
  ingress.kubernetes.io/proxy-request-buffering:        off
  ingress.kubernetes.io/ssl-redirect:                   true
  kubernetes.io/ingress.class:                          nginx
  nginx.ingress.kubernetes.io/proxy-body-size:          50m
  nginx.ingress.kubernetes.io/proxy-request-buffering:  off
  nginx.ingress.kubernetes.io/ssl-redirect:             true
Events:                                                 <none>
and validate that the controller pod can be reached from the CJOC pod
kubectl exec -ti cjoc-0 -- curl -I 10.52.31.29:8080/mm1/login | head -n1
kubectl exec -ti cjoc-0 -- curl -I example.com/mm1/login | head -n1
The output should be HTTP/1.1 200 OK.
Advanced Network Troubleshooting
1.] Utility pod
To further troubleshoot the routing issues, we need tools such as ping, curl, netcat, telnet, dnsutils. You are going to create a diagnostic pod with the listed packages installed. On a Debian based test pod, run
apt-get update && apt-get install iputils-ping iproute2 curl telnet netcat net-tools -y
Create a new utility-pod pod
kubectl create deployment utility-pod --image=nginx
kubectl get pods | grep utility-pod
output
utility-pod-7b45c4f7dd-dj8gv 1/1 Running 0 85s
Open an interactive session on a utility-pod and install the tools.
kubectl exec -ti utility-pod-7b45c4f7dd-dj8gv -- bash

apt-get update && apt-get install iputils-ping iproute2 curl telnet netcat net-tools -y
Good troubleshooting guides include
Once the issue is resolved, remove the utility-pod deployment
|
kubectl delete deploy utility-pod
2.] Involve k8s support team
Contact your corporate k8s support team for further troubleshooting.
Submit a CloudBees Support request and a CloudBees engineer will schedule a call with you. https://support.cloudbees.com/hc/en-us/requests/new