Issue
-
Why are new Shared Agents and Clouds not being provisioned for my jobs in the queue when I have agents that are suspended?
-
How does the
NodeProvisionerwork?
Environment
-
CloudBees Jenkins Enterprise - Managed controller
-
CloudBees Jenkins Enterprise - Operations center
Resolution
Starting points
Jenkins maintains a NodeProvisioner for every label. The NodeProvisioner maintains statistics about:
-
How many executors are valid for that label
-
How many executors are available for building jobs requiring that label
-
And how many jobs are in the queue needing that label
The NodeProvisioner is tasked with going and provisioning new agents when there are "none available", with the aim in such cases of provisioning enough nodes that the queue will tend to zero.
The NodeProvisioner implementation is essentially unchanged from when this was introduced. This is mentioned because the reason for the initial implementation was EC2. The concern was that the end-users want to spin up lots of nodes just for a queue spike as then they would have them running for the rest of the hour and costing money.
So what happens is that the NodeProvisioner uses exponentially weighted averages of the statistics, and the limits that are used against those statistics are biased to inhibit provisioning as the number of agents provisioned against the label increases. There are a number of system properties that control this calculation, and they can be can tweak them to alter provisioning behaviour.
Now, one of the things that end-users don’t want to happen is that the first run of the NodeProvisioner goes and requests a load of agents be provisioning, they get provisioned, they are in the middle of connecting to Jenkins and the NodeProvisioner runs again, sees that there are no available agents and provisions some more. For reasons that are lost in the depths of time, Jenkins thus counts agents that are in the process of connecting as being available (i.e. it assumes they will be available shortly) but they are not counted amongst the total number of agents… the net result is that when you look at the load statistics graph for a label, you can… and do… see a negative number of busy executors:
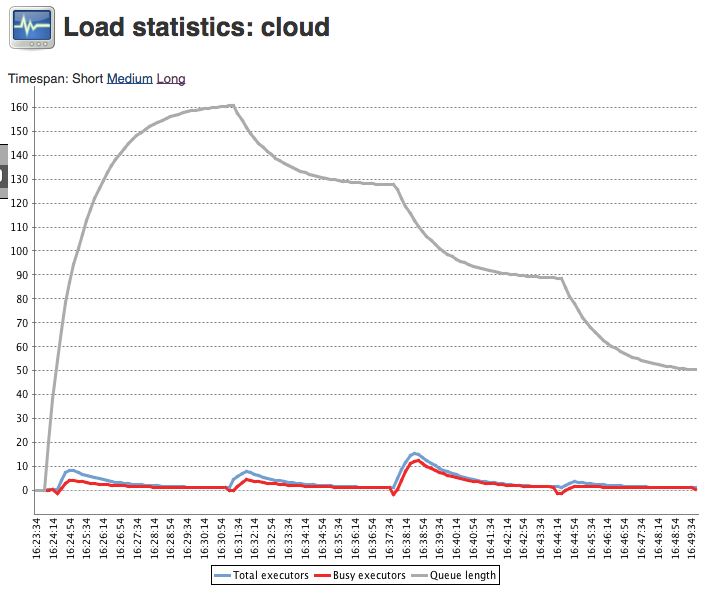
More specifically, play close attention to the part of the graph near zero:

The reason for this weird behaviour is that (at least prior to 1.607) Jenkins decided that the number of busy executors could be derived from the total number of on-line executors by subtracting the number of available executors (which from before was the number of on-line idle executors plus the number of connecting executors). So this negative busy count means that there are some executors in the process of connecting.
A little further digging reveals that in essence these executors coming on line end up poisoning the statistics that are used for provisioning. If you use the default LoadStatistics.CLOCK the poisoning takes about 5-6 minutes to clear out… (On the other hand there is a special case that ignores the statistics if you have absolutely no nodes matching the label).
So what you end up seeing is that the nodes get provisioned in batches, the provisioning poisons the statistic and blocks provisioning until the spike decays away, at which point the provisioning can allocate another bunch of nodes.
This behaviour is really only evident when using a non-monopolising retention strategy as with a monopolising strategy the provisioned agents will keep building jobs. But as other plugins implementing the Jenkins Cloud API have found (e.g. the Docker plugin) it is really a bug in Jenkins' core provisioning logic.
A number of fixes has been committed in this area:
-
In Jenkins 1.588, made the provisioning strategy plugable was fixed as well as fixing the busy count and introducing an on-line count so that new strategies can decide to use the on-line count in place of the available count.
-
In Jenkins 1.607, fixed the statistics used to decide on provisioning
The load graphs seen when running on 1.607 (though beware JENKINS-27708 and JENKINS-27871 which I fixed towards 1.610) result in much better provisioning behaviour.
So, there is no additional provisioning because you have more than zero executors which means that provisioning is based on the average number of available executors being close to zero and the provisioning of the executor you do have resulting in poisoning of that statistic which will take approximately 6 minutes to clear - or if the node is released and you then have zero executors available then the provisioning logic will switch back to the special case handling.
What can I do about all this?
For operations-center-cloud < 1.8.4
There are some workarounds that will keep the system performing closer to how it should behave.
In that regard, there are a number of system properties that can be configured in the controller. These system properties only affect the controller that you set them on. These properties can be tweaked differentially on different controller to understand the aggregate effect.
So without further ado, here are the properties:
-
hudson.agents.NodeProvisioner.MARGINwhich is a number between 0 and 100. Default value: 10 -
hudson.agents.NodeProvisioner.MARGIN0which confusingly is a number between 0.0 and 1.0 (to compare it withhudson.agents.NodeProvisioner.MARGINyou need to dividehudson.agents.NodeProvisioner.MARGINby 100). Default value 0.5 -
hudson.agents.NodeProvisioner.MARGIN_DECAY. Default value: 0.5
The above properties are mentioned in the tutorial where we suggest starting withhudson.agents.NodeProvisioner.MARGIN=50 andhudson.agents.NodeProvisioner.MARGIN0=0.85
When the average number of available executors falls below m(x)then provisioning is triggered. So by raising the effective value ofm(x) you will reduce the effect of poisoning of the statistic by the agents that are in the process of connecting for 5-10 seconds.
Doing this, though, be aware that you risk over-provisioning as the number of agents to provision is the average excess workload plus m(x) and then rounded down to a whole number. In effect you can end up provisioning more agents than are needed if you push these properties too high. Those agents will be returned to JOC automatically after 30-60 seconds, but during that period other client controllers will be unable to use them.
-
hudson.model.LoadStatistics.clockwhich is a number of milliseconds. Default value 10000. With JOC we do not recommend using values lower than 3000. -
hudson.model.LoadStatistics.decaywhich is a number. Default value 0.9
The above two properties control the time scale that the averaging of the statistics works over and how rapidly the averages decay. The half-life of a poison spike will beclock*log(0.5)/log(decay). So a spike of 1 will be at 0.5 after 1 minute, 0.25 after 2 minutes, 0.125 after 3 minutes and then shortly after that the default m(1) value will be crossed and a second node will be provisioned.
Changing the decay is most likely the easiest parameter to adjust as it should have the least side-effects. The clockcauses issues using a value less than about 3 seconds. I recommend that 5 seconds is the absolute lowest safe value to use.
For operations-center-cloud > 1.8.4
The latest 1.8.x series release of OC-cloud has switched to using its own NodeProvisioner.Strategy: OperationsCenterNodeProvisioningStrategy which provides much faster provisioning response. This means that nodes are requested as soon as possible for nodes that can be provisioned from CJOC, no need to fiddle with system properties anymore.
As the extension point required is only available in Jenkins 1.609+ it currently is restricted to the 1.8.x series of OC- plugins, but it will likely be back ported to the 1.7.100+ series.
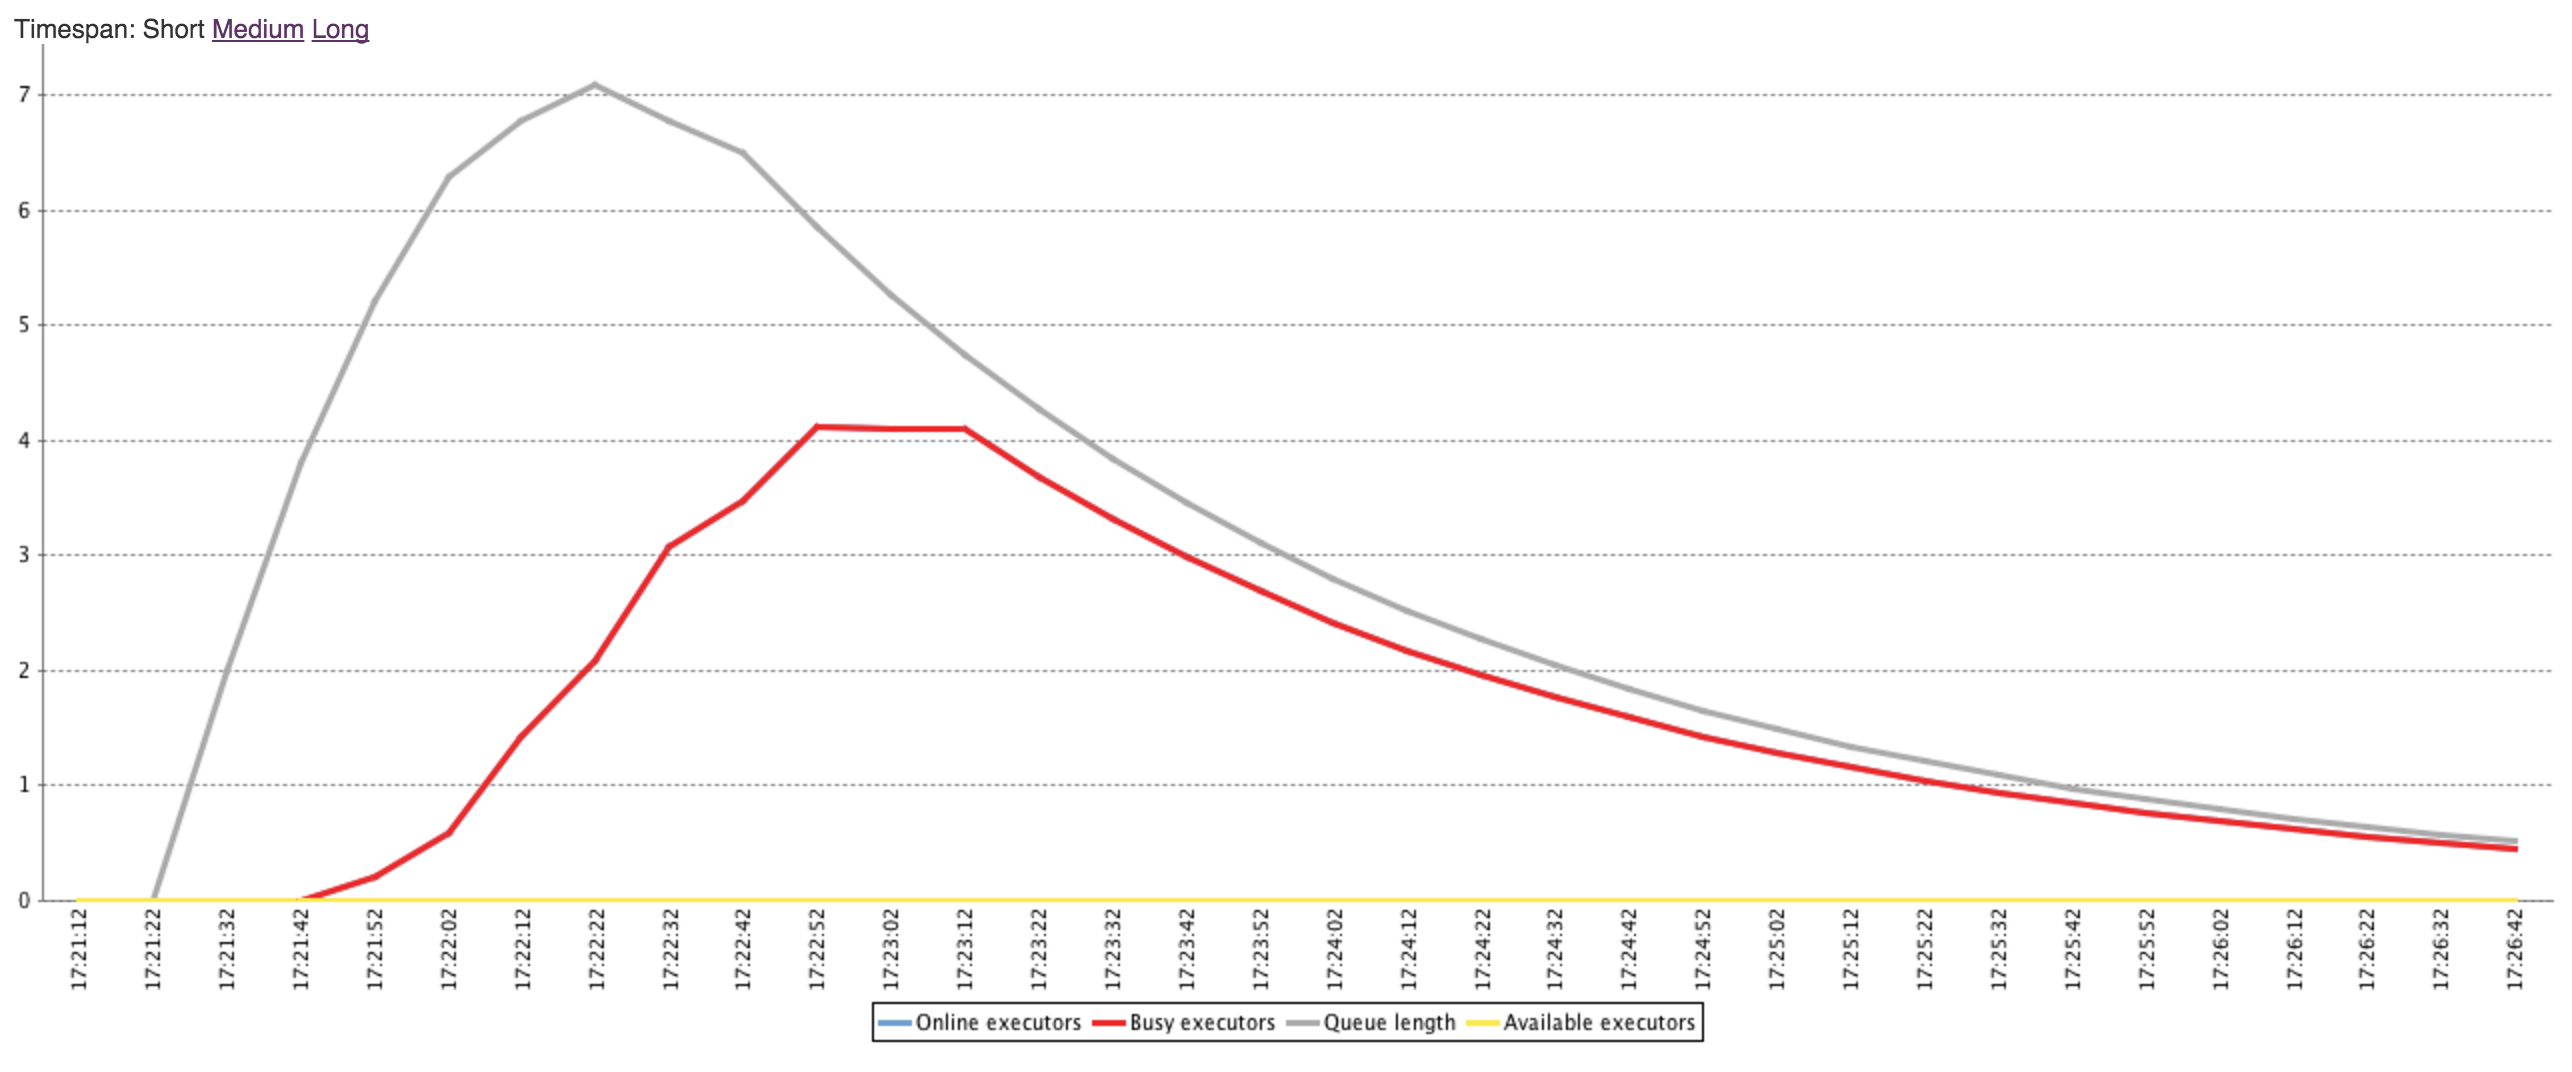
Here is a load statistics profile with this strategy disabled:
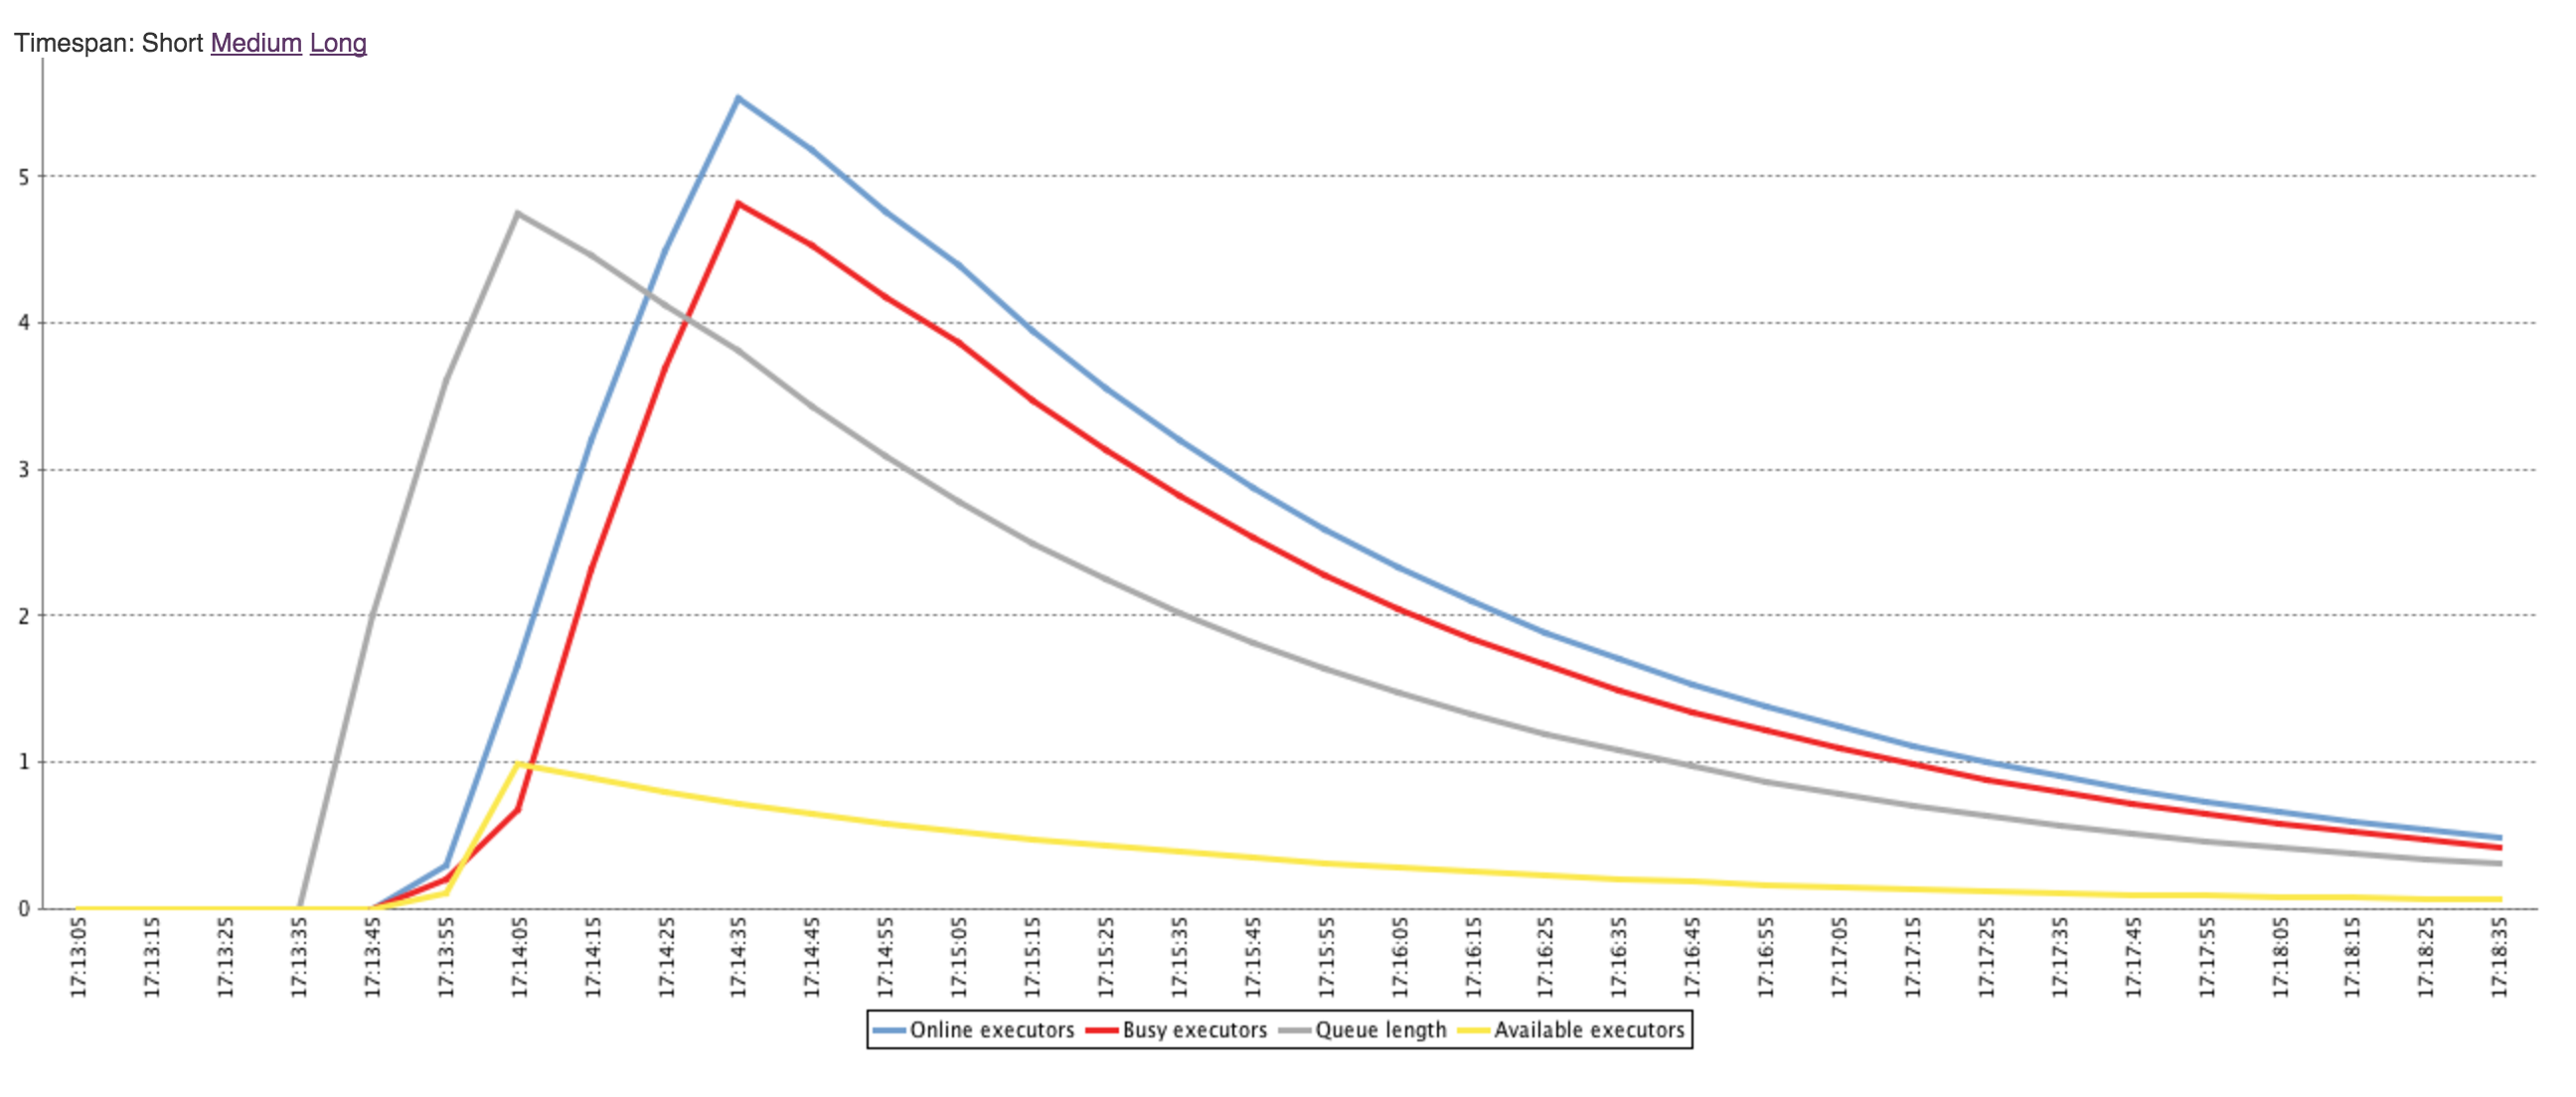
Here is a load statistics profile for the same workload with this strategy enabled:
-
When enabled, the time to maximum average queue length is 30 seconds and the max average is approx 5
-
When disabled, the time to maximum average queue length is 100 seconds and the max average is approx 7
This means that the jobs are waiting in the queue a lot longer with the strategy disabled.
-
When enabled, the time to maximum average number of executors is 60 seconds where the max is 5
-
When disabled, the time to maximum average number of executors is 100 seconds where the max is 4
This means that the available resources are less utilized with the strategy disabled as it is being conservative in provisioning.
The OperationsCenterNodeProvisioningStrategy is enabled by default only when following the single shot mode - which is the only time where its assumptions are safe to make without risking over-provisioning.
You can do enable/disable this strategy by adding the following as Java arguments in the Client controller/s:
com.cloudbees.opscenter.client.cloud.OperationsCenterNodeProvisioningStrategy.enabled=true