Issue
As explained in CloudBeesCD System health monitoring, CloudBees CD/RO is instrumented to publish system health metrics to a StatsD server.
In this article we will explain how to configure a test environment with StatsD and Grafana to check some predefined dashboards.
Environment
CloudBeesCD System health monitoring is included from CloudBees CD (CloudBees Flow) 10.1
Resolution
Prerequisites: You will need to have Docker installed in your destination StatsD - Grafana system.
The following image has not been validated by CloudBees and is used as an example. We recommend you review its content before using it and only in not production environments.
To configure your test environment with StatsD - Grafana, please configure the kamon/grafana_graphite docker image:
docker pull kamon/grafana_graphite
This image will use the ports:
-
80/TCP: the Grafana web interface.
-
81/TCP: the Graphite web port
-
2003/TCP: the Graphite data port
-
8125/TCP/UDP: the StatsD port.
-
8126/TCP: the StatsD administrative port.
To start a container this image you can do it with two approaches:
Using make
You will need to have docker-compose, and make installed on your machine.
-
To start a container with this image you just need to run the following command:
$ make up -
To stop the container
$ make down -
To run container’s shell
$ make shell -
To view the container log
$ make tail
Using docker run
-
To start a container with this image you just need to run the following command:
$ docker run --name grafana -d -p 80:80 -p 81:81 -p 2003:2003 -p 8125:8125/tcp -p 8125:8125/udp -p 8126:8126 kamon/grafana_graphite -
To stop the container
$ docker stop grafana -
To run again the container
$ docker start grafana -
To view the container log
$ docker logs grafana
Once configured, you will need to configure the CloudBeesCD System health monitoring
In your CloudBees CD instance, go to
-
CloudBees CD Main Menu - Administration - Configurations - System health monitoring.
-
Make sure the
Enabledcheckbox is selected and in theHost Namefield appears the configured StatsD Grafana system IP or Host Name. -
Confirm the port is the UDP StatsD port (8125 by default).
-
Click Save.
Additional information about all the other options can be found in the CloudBeesCD System health monitoring documentation.
Once the StatsD - Grafana service is running and CloudBees CD configured, you can access to Grafana using the url https://GrafanaHostName and log in using the admin/admin credentials
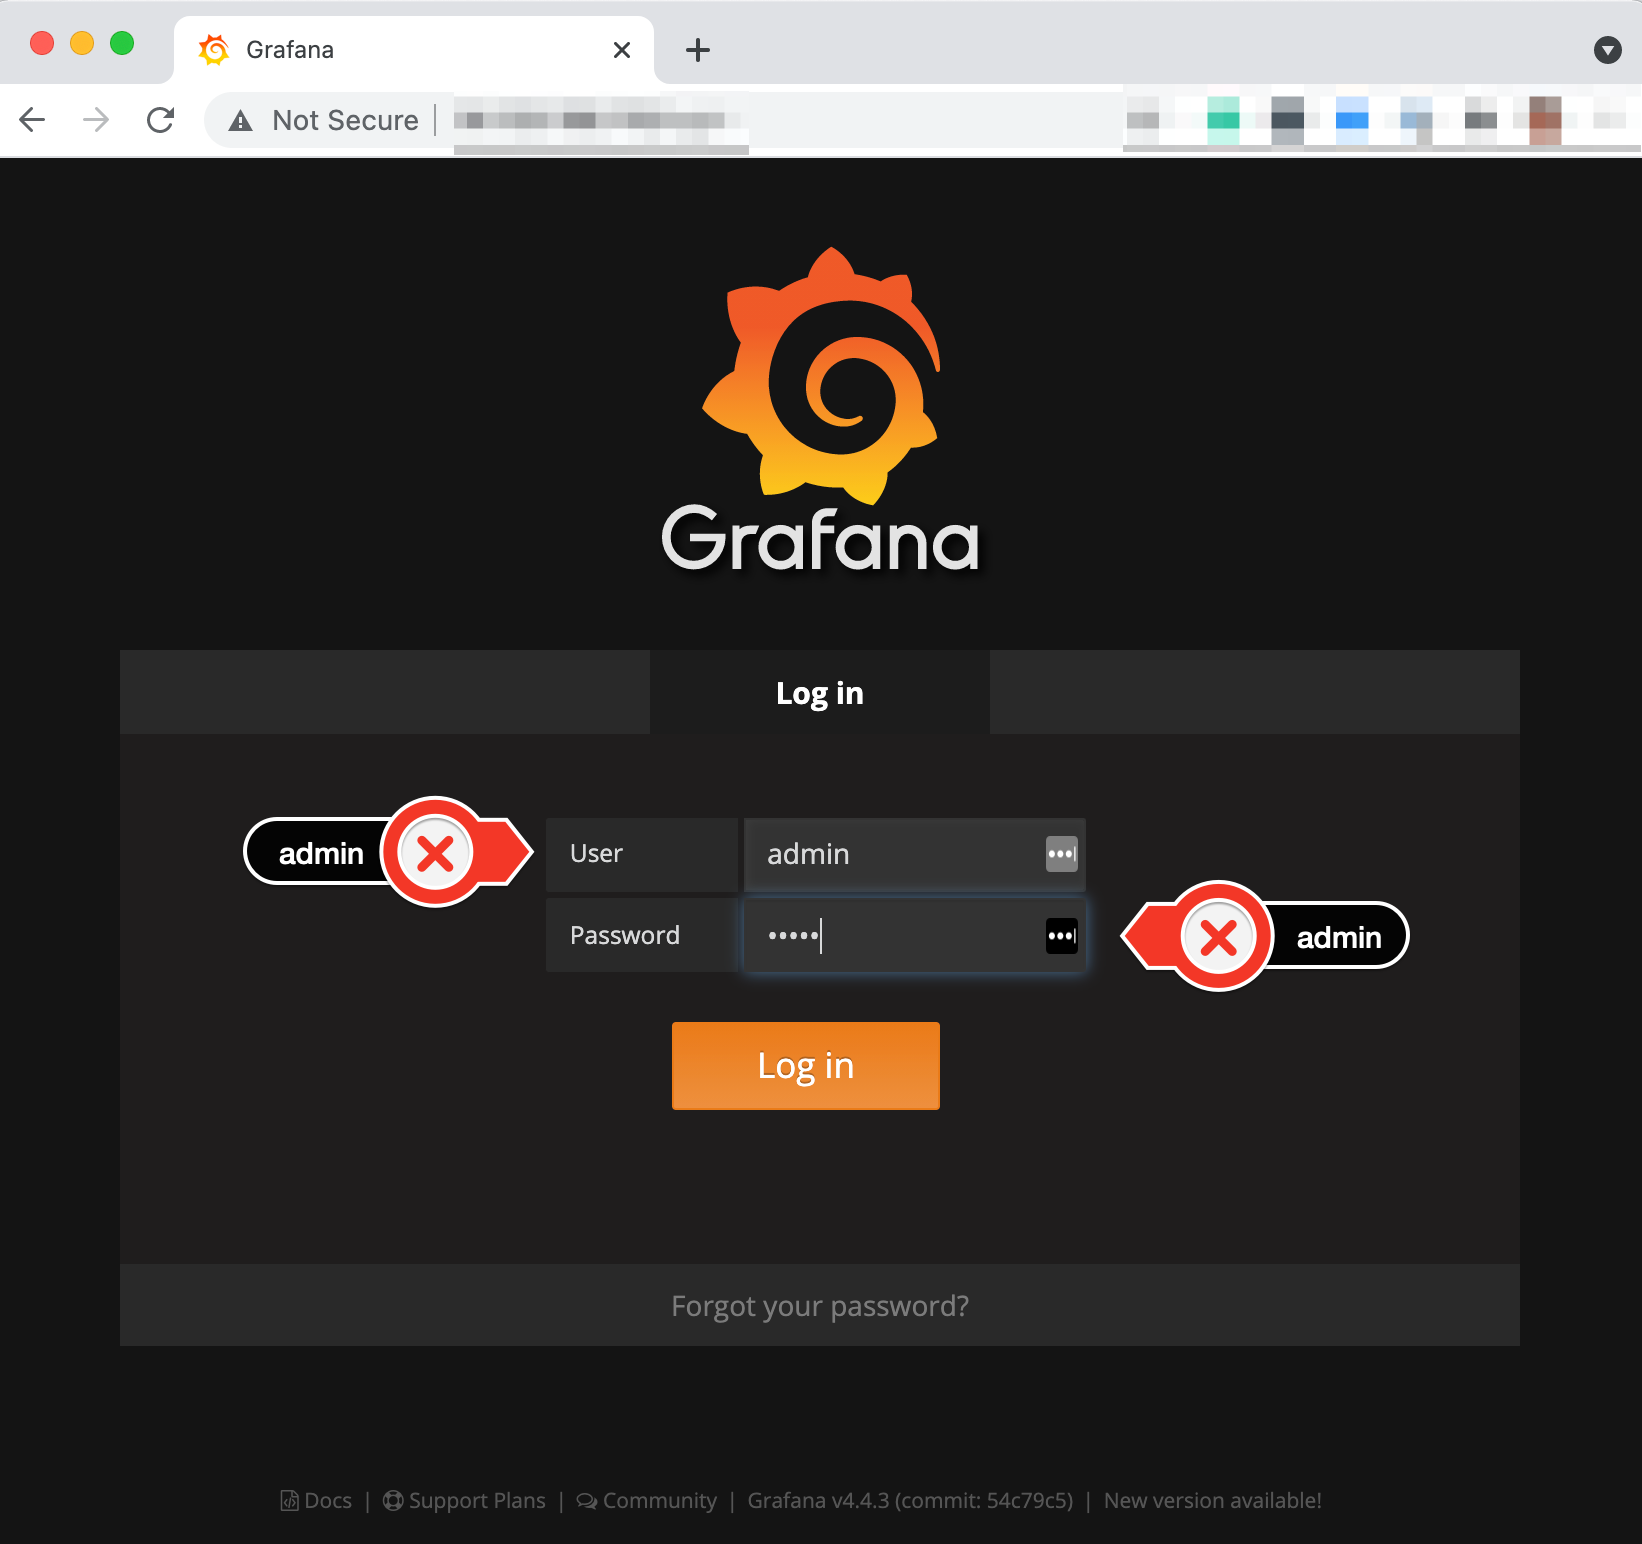
Once in Grafana, we need to import the grafana-dashboard-example.json, downloading this file, and pasting its content in Grafana,
To do so:
-
Click on Home
-
Import DashBoard

-
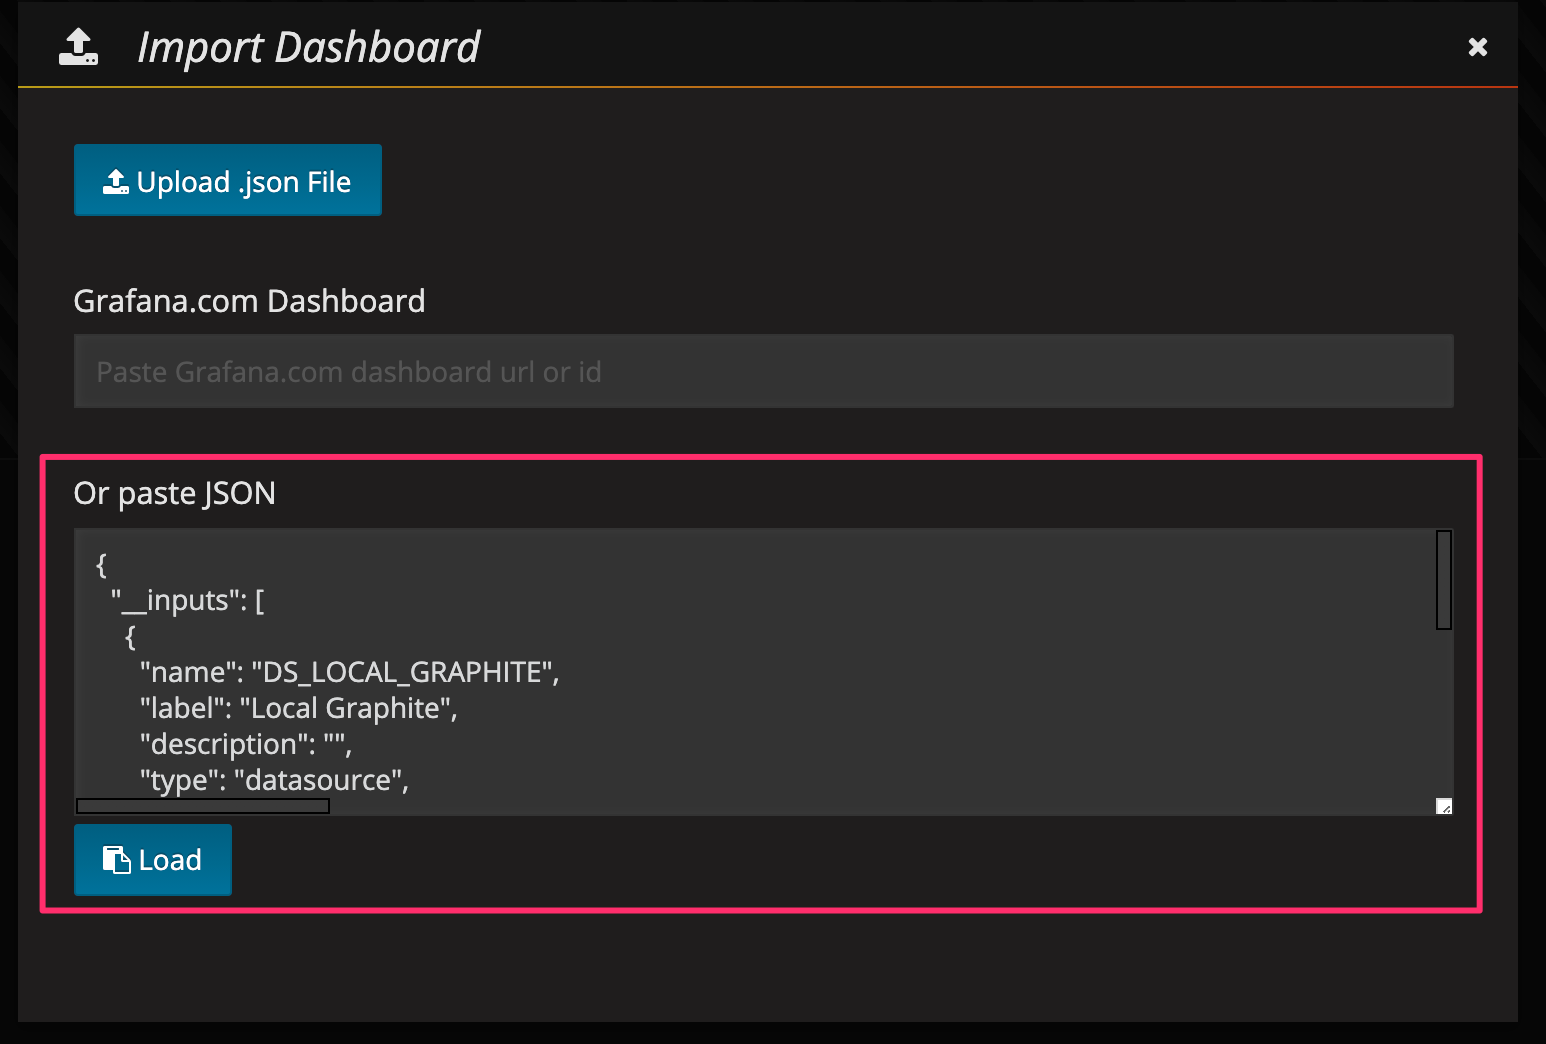
Paste the grafana-dashboard-example.json file content in
Or paste JSONfield and click Load
-
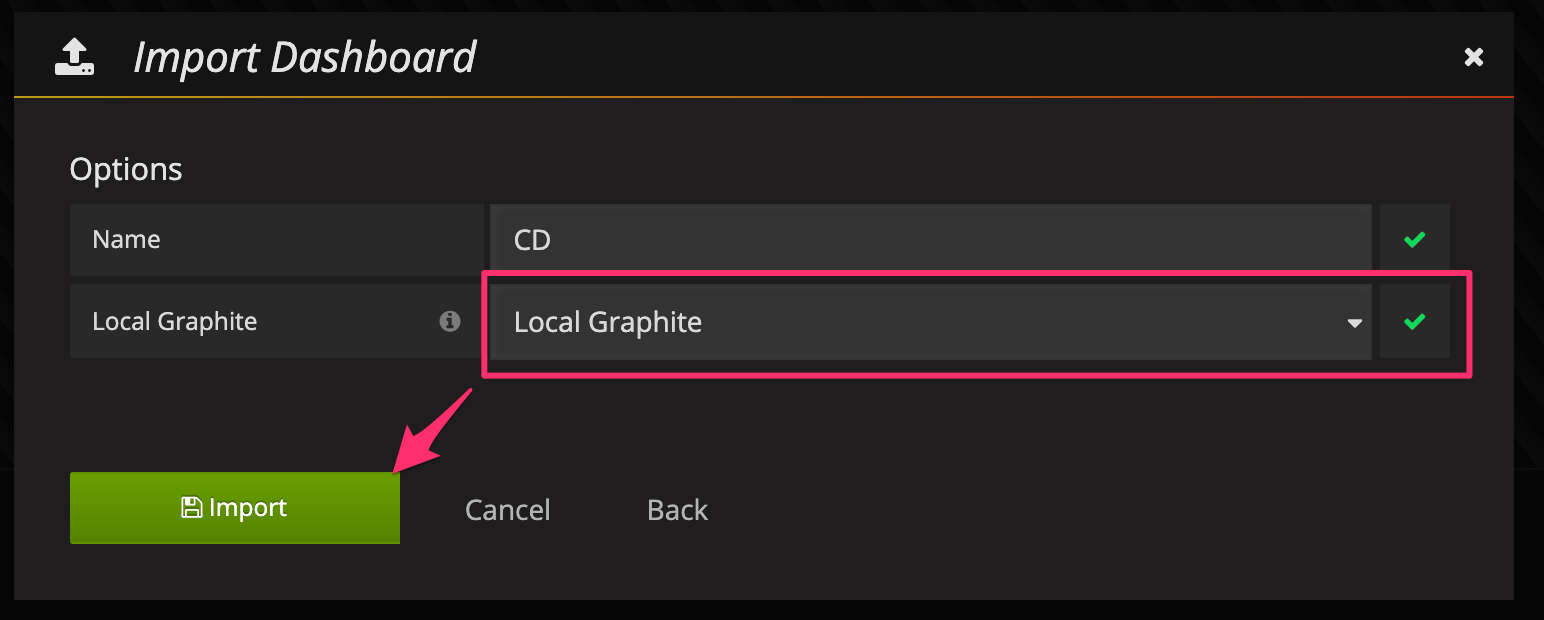
Provide a Dashboard Name (for example CD) and in Local Graphite, select Local Graphite. Once done, please click Import.
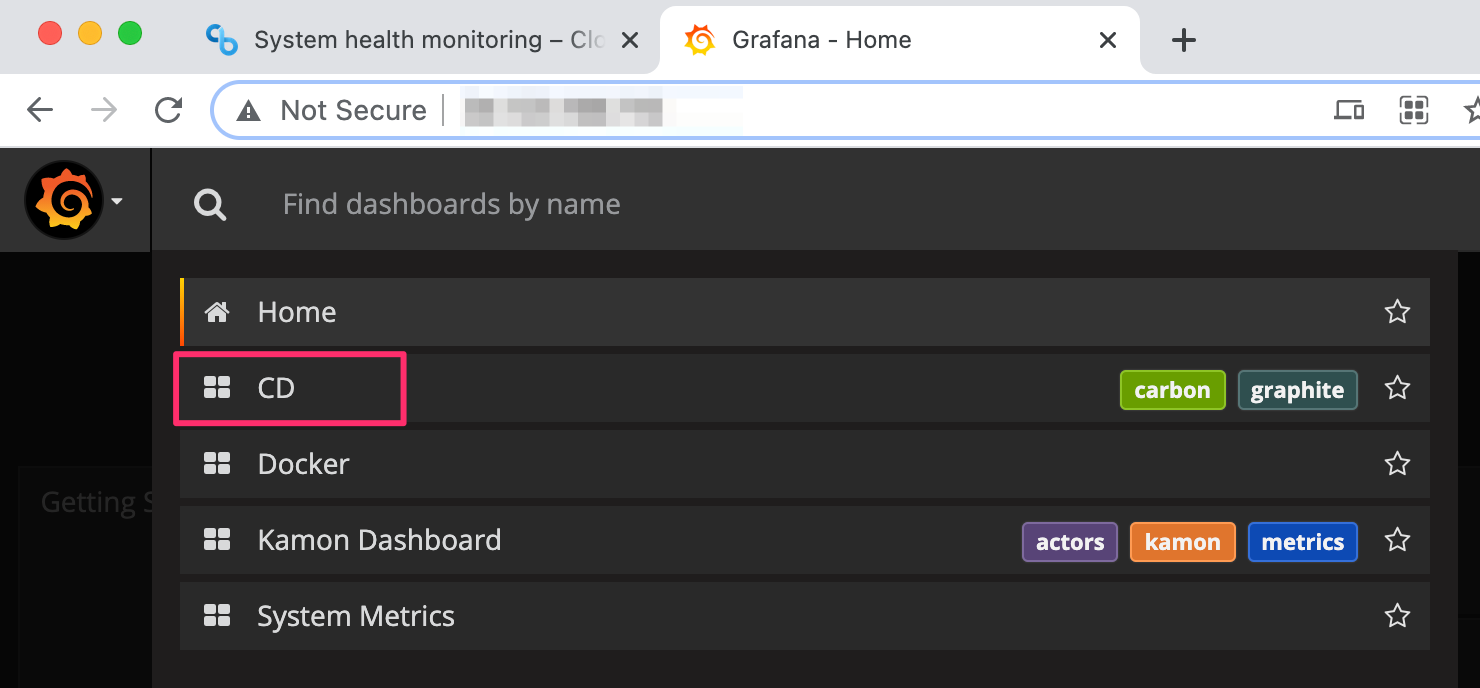
Once imported, you will be able to see this new CDdashboard in the Grafana Home menu.
And there, you will be able to see the CloudBees CD real time statistics:
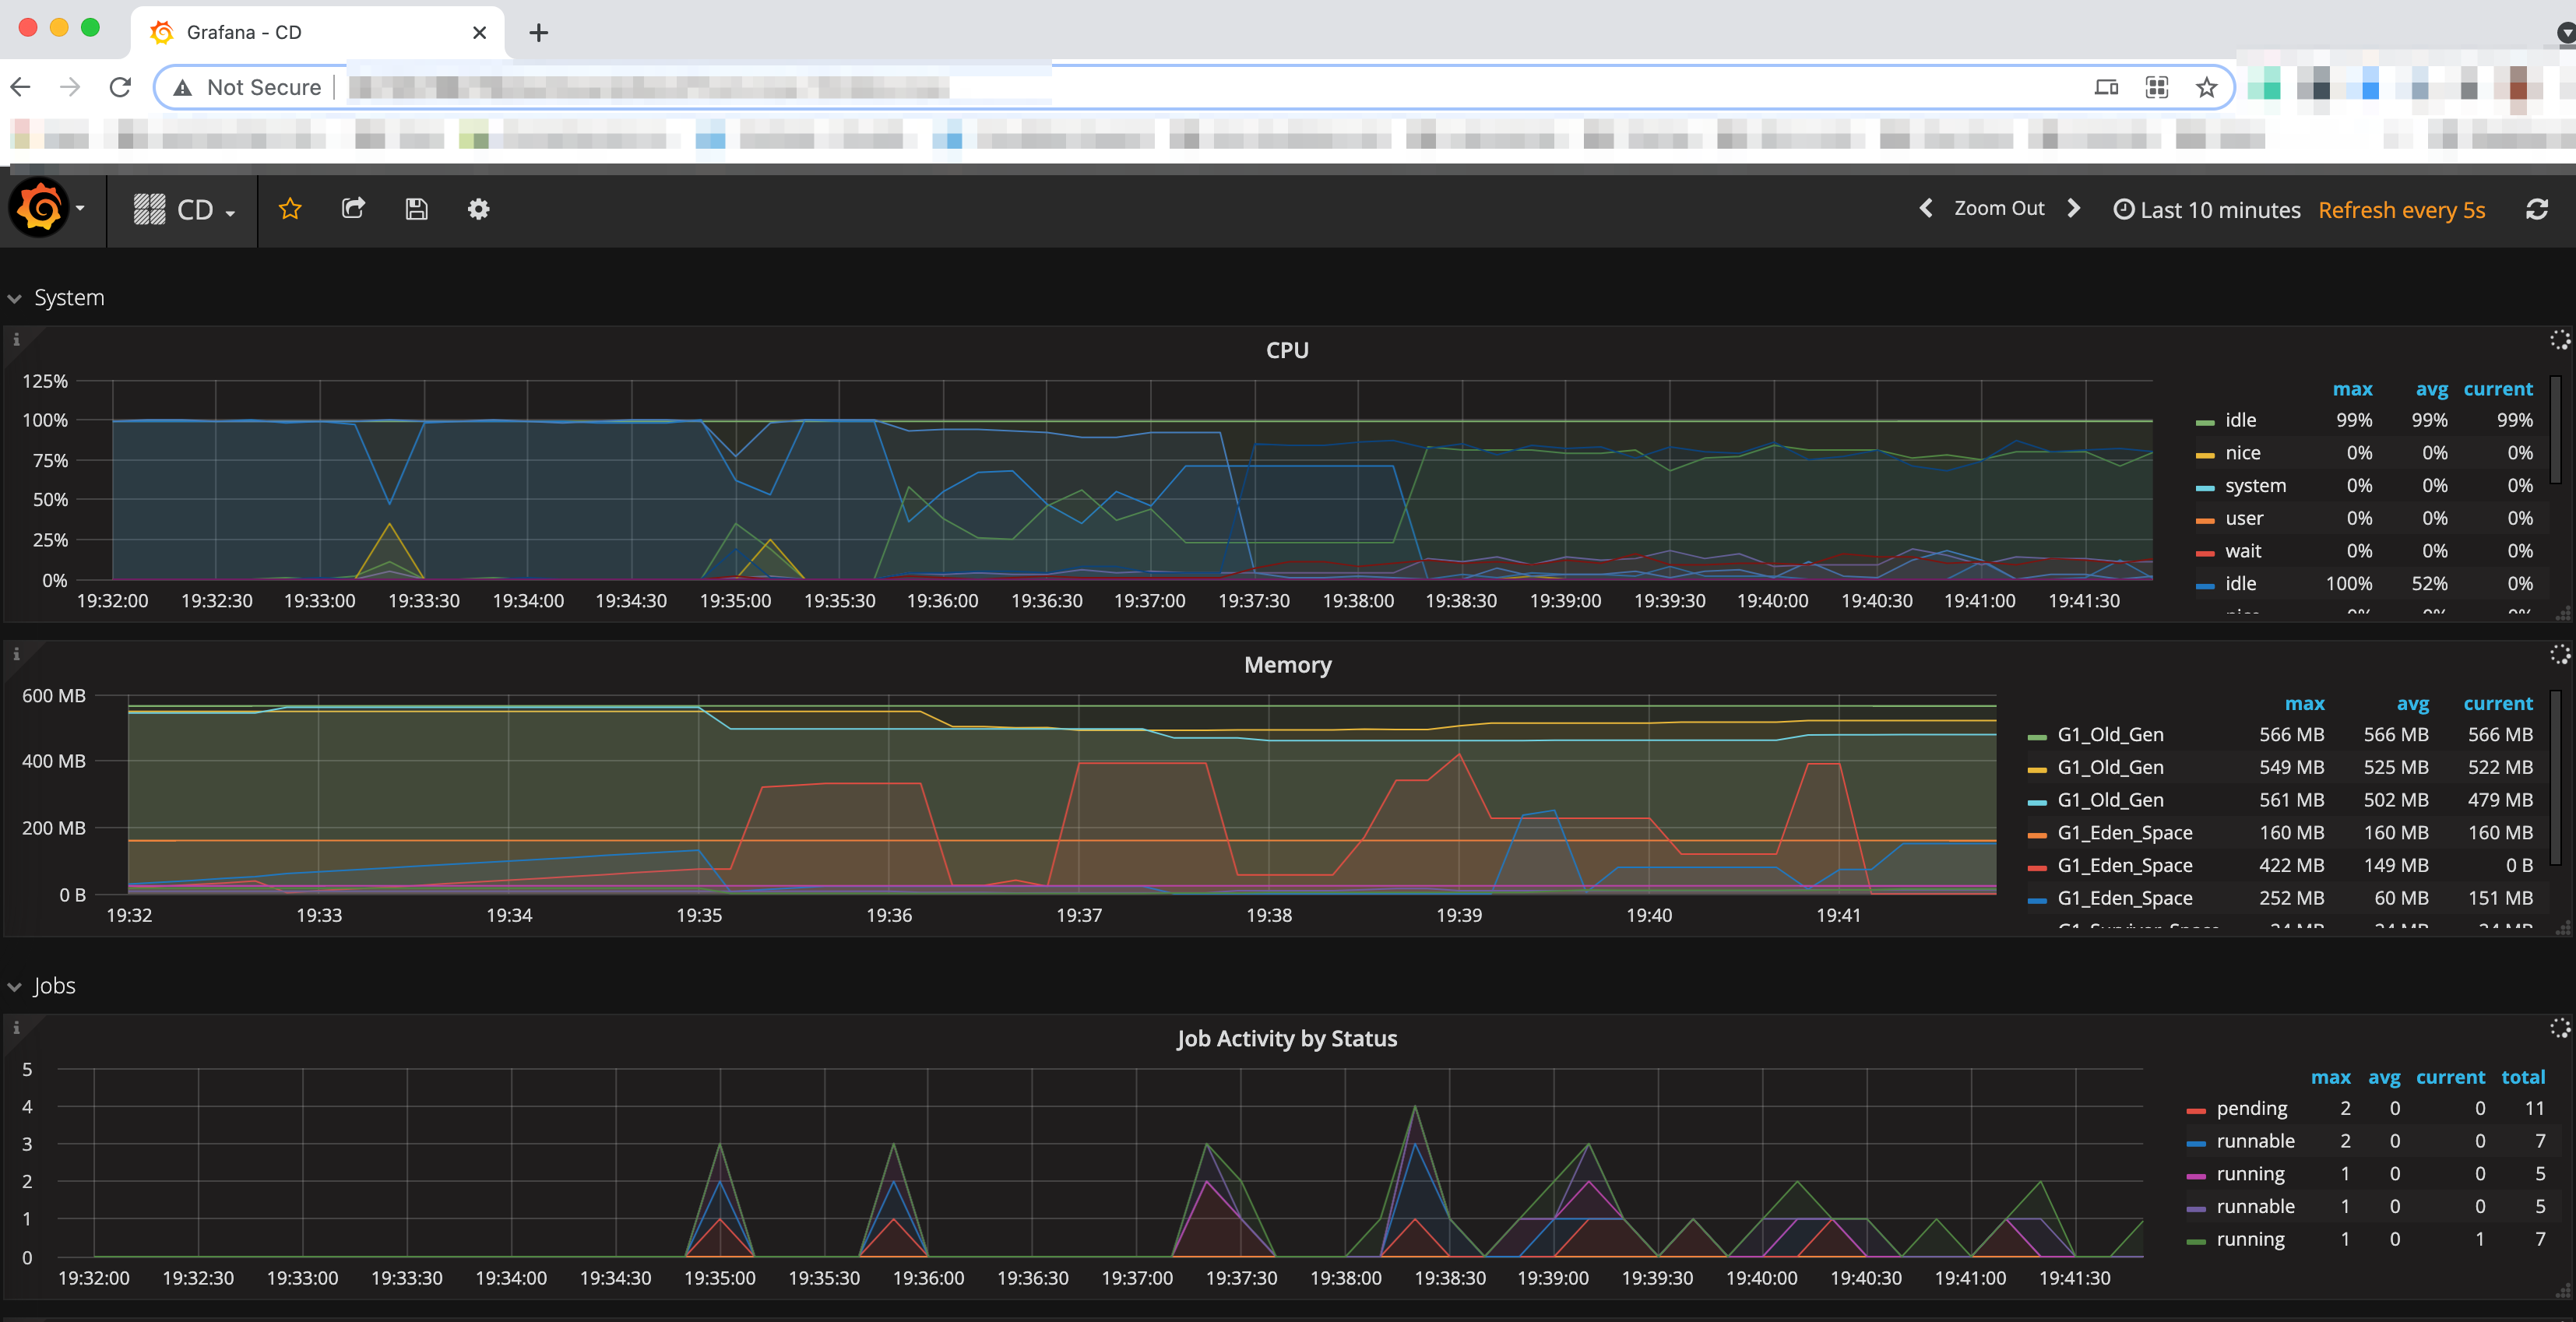
In this Dashboard you will be able to check:
-
System Health Monitoring metrics: System CPU usage, JVM Memory stats, Database transaction retry delays
-
Application Health Monitoring metrics: Job & Step Outcomes, Step Scheduler Stats, API response times, Message Service Times for state machine performance
-
Hibernate Metrics: Designed for development Engineer to understand DB usage, performance
== Additional information
This is just an example of a CloudBees CD monitoring dashboard, but Grafana is not the only option to generate CloudBees CD monitoring dashboards.
The foundations of the CloudBees CD System Health Monitoring are based on StatsD.
StatsD is a standard used to send, collect, and aggregate custom metrics from any application.
CloudBees CD is sending metrics to StatsD of type:
-
Counter Metrics e.g. Number of runnable steps
-
Gauge Metrics e.g. Memory Consumption, CPU consumption (0-Max)
-
Timer Metrics e.g. API response times, Garbage collection timers, Message Service response times, Hibernate response times
Detailed list of counters, gauges and timer events tracked
-
Count of aborted jobs
-
Count of SAML logins
-
Count of started jobs
-
Count of completed jobs
-
Count of each type of job outcome
-
Gauge of runnable job steps
-
Gauge of license usage
-
Count of completed steps
-
Count acl cache hits/misses
-
Count of each API call
-
Gauge of active API calls
-
Count of string expander cache hits/misses
-
Count of logins
-
Count of logouts
-
Count of session manager cache hits/misses
-
Gauge of admin session usage
-
Gauge of open files/filemax
-
Gauge of cpu usage
-
Gauge of memory usage
-
Logins/logouts.
-
Transaction commit times
-
Number of API calls.
-
JVM memory
-
Count of runnable steps.
-
Flow metrics like Number of APIs , wait time for them
-
All timers kept by the system are emitted ( every api call as multiple timers, same as the content in dumpStatics)
-
So you can manually create your own dashboard on Grafana, or any other monitoring dashboard tool based on StatsD.
In addition, if your company is using monitoring based on Prometheus, you will need to configure a StatsD Server to collect the current metrics from CloudBees CD, but you can migrate them to Prometheus by running the Prometheus StatsD Exporter or Prometheus Graphite Exporter