The Release Command Center dashboard provides a "birds-eye" view of a product or release across all of its pipeline phases. These phases include initial planning with tools (such as JIRA or Rally) to groom the backlog, target stories, and tasks.
Drilling Down into Phases
Drill-down lets you take a "closer look" at the data in the Release Command Center dashboard. You can drill down into the Planning, Dev, Build, and Deploy pipeline phases. Drill-down for these phases is implemented using either bundled plugins or the CloudBees CD (CloudBees Flow) Deploy UI itself. Drill-down details for phases with drill-down capability are provided below.
Planning Phase
| Cell | Description |
|---|---|
Planning Complete |
Percentage of release stories that have story points assigned. This metric includes a trend indicator arrow. |
Stories |
Total count of release stories. |
Stories Estimated |
Total count of release stories with story points. |
Drill-down in the Planning phase collects data from the EC-JIRA plugin. Clicking any cell in this phase opens a customized JIRA page. For example:

Dev Phase
| Cell | Description |
|---|---|
Development Complete |
Percentage of release stories that have exited development. |
Stories Resolved |
Percentage of release stories that are development complete. |
Unit Test Success Rate |
Percentage of successful unit tests out of the total unit tests run through CI builds for the release in the last 10 days. |
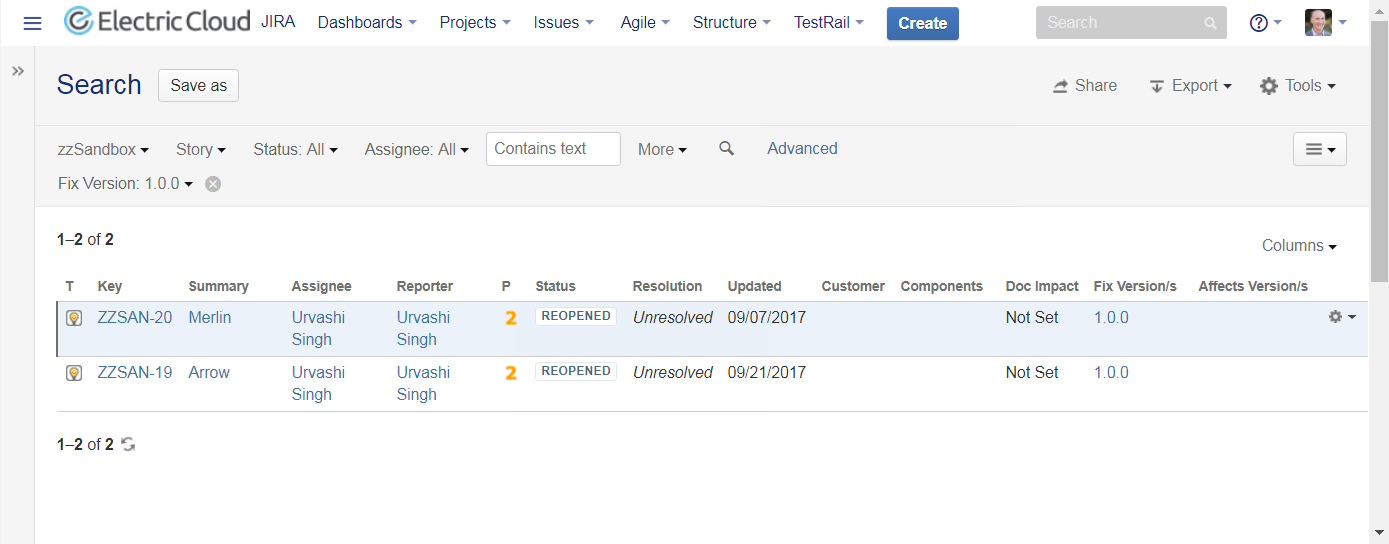
Drill-down in the Dev phase collects data from the EC-JIRA plugin. Clicking any cell in this phase opens a customized JIRA page. For example:
Build Phase
| Cell | Description |
|---|---|
Build Success Rate |
Percentage of successful builds out of the total builds for the release in the last 10 days. This metric includes a trend indicator arrow. |
Successful Builds |
Number of successful builds out of the total builds for the release in the past 10 days. |
Time to Build |
Average time taken by builds associated with the current release to complete in the past 10 days. |
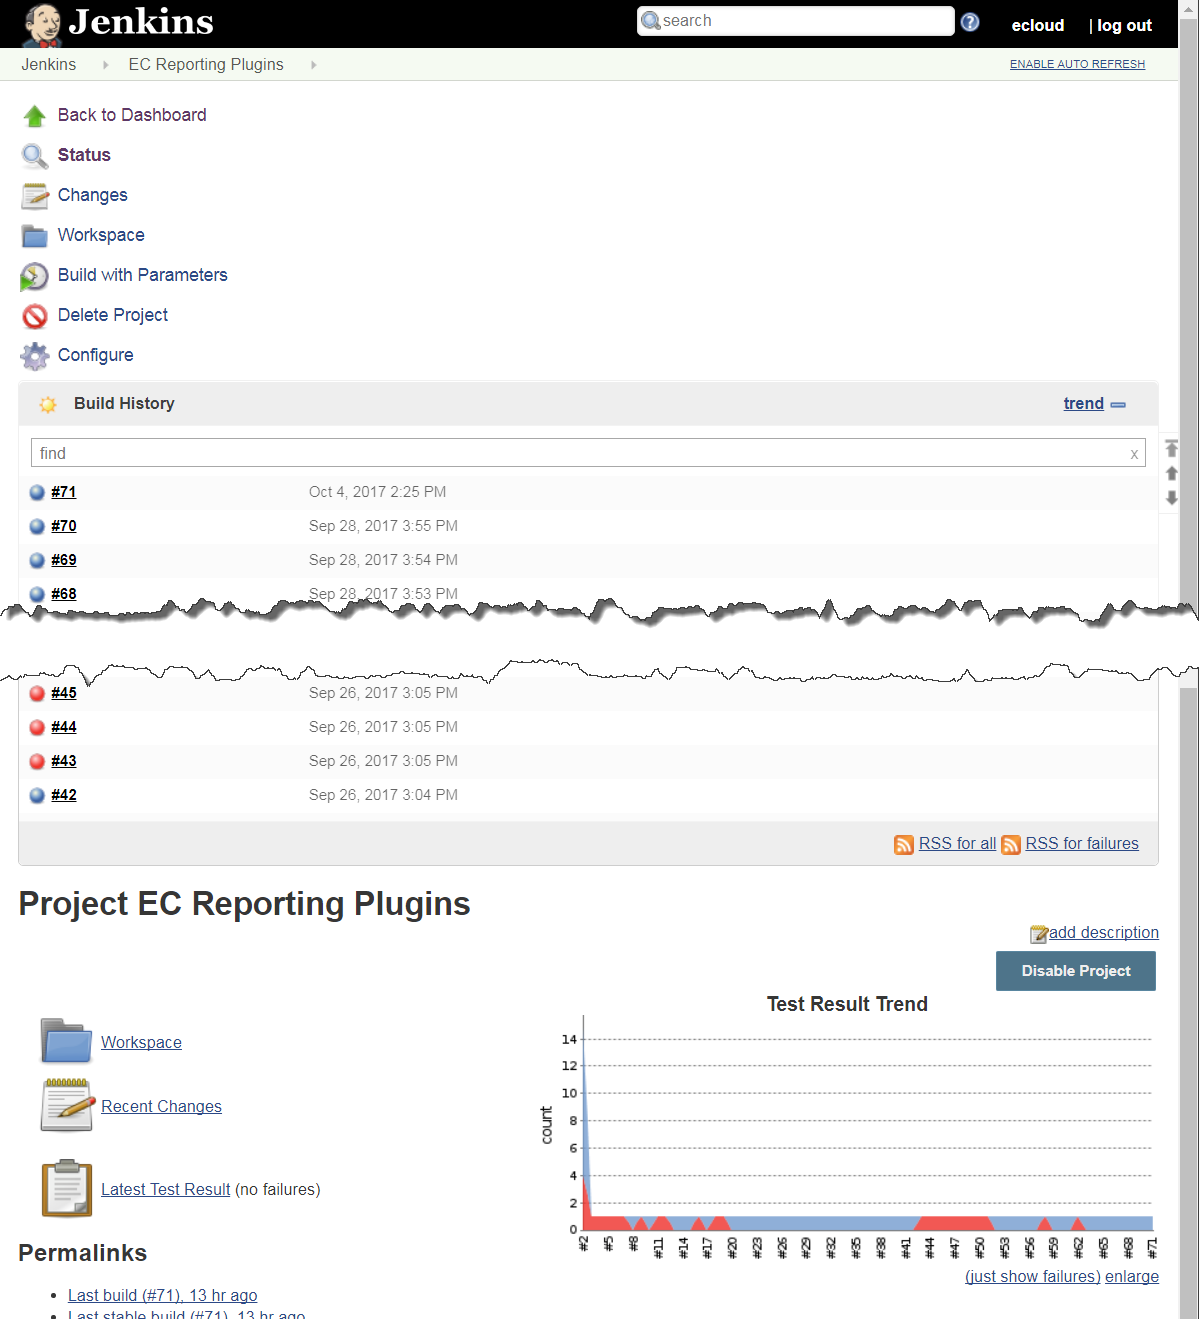
Drill-down in the Build phase collects data from the EC-Jenkins plugin. Clicking any cell in this phase opens a customized Jenkins jobs page in another browser tab to show all the builds. For example:
Test Phase
| Cell | Description |
|---|---|
Test Success Rate |
Percentage of successful tests out of the total tests that were run for the release in the last 10 days. This metric includes a trend indicator arrow. |
Automated Tests |
Percentage of automated tests out of total tests that ran for the release. |
Time to Test |
Average test duration in the last 10 days. |
Deploy Phase
| Cell | Description |
|---|---|
Success Rate |
Percentage of successful deployments in the past 10 days. This metric includes a trend indicator arrow. |
Successful Deployments |
Number of successful deployments out of the total completed deployments in the past 10 days. |
Average Time to Deploy |
Average deployment time for successful deployments in the past 10 days. |
Drill-down in the Deploy phase opens the Application Deployments page. You can access this page by clicking any cell in the Deploy phase for a specific release (this filters by the selected application and the selected cell) or by clicking Applications > Application Deployments from the Home menu (this shows all deployments for all applications by default).
Following is an example of the Application Deployments page when opened from the Release Command Center:

This is a page that is filtered by successful deployments for the selected application.
Following is an example of the Application Deployments page when opened from the Home menu:
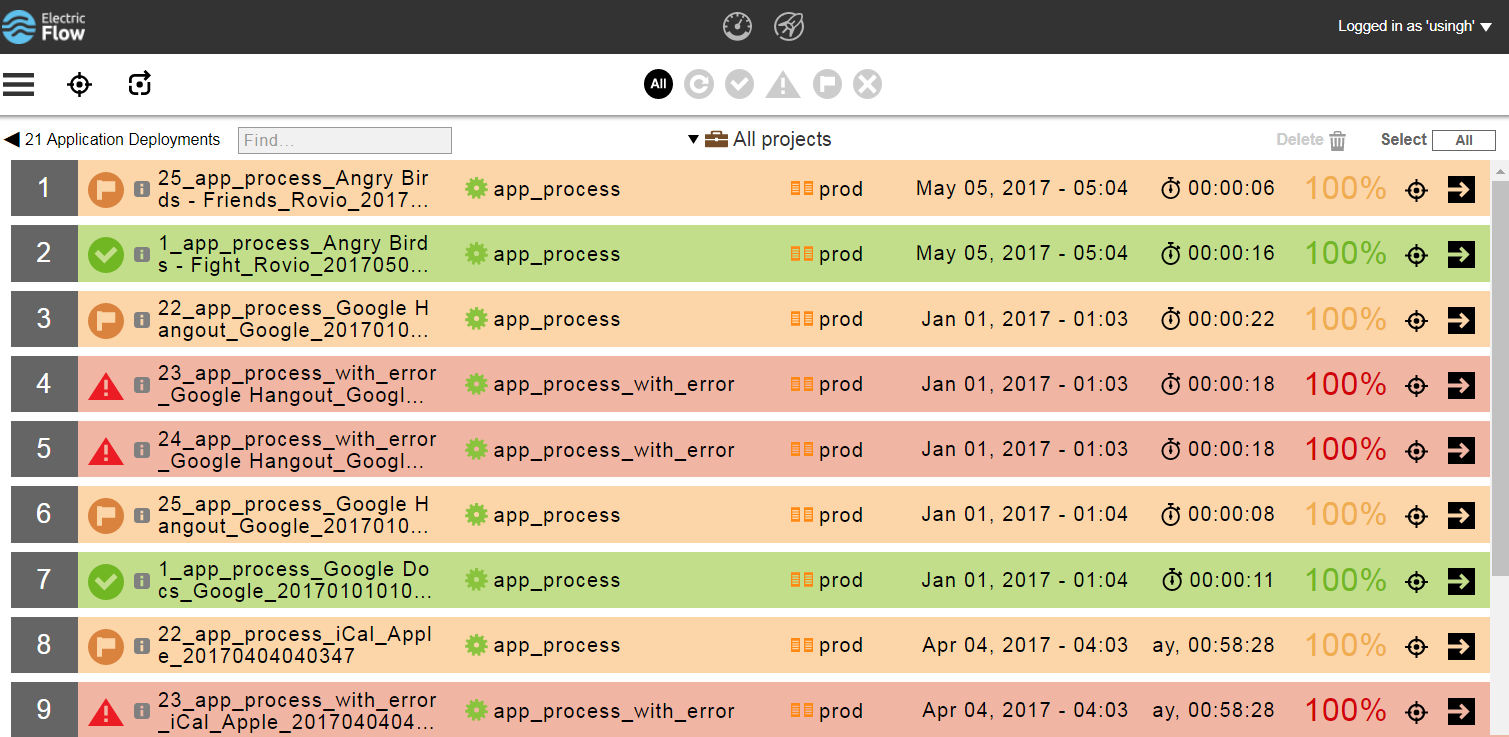
You can filter the list of deployments according to status by using the following buttons:
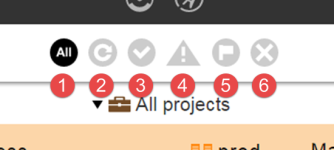
Following are descriptions of the filters:
1 |
All deployments |
2 |
Running deployments (gray highlighting) |
3 |
Successful deployments (green highlighting) |
4 |
Deployments that stopped because of one or more errors (red highlighting) |
5 |
Deployments that finished with one or more warnings (yellow highlighting) |
6 |
Aborted deployments (gray highlighting) |
For example, you can view only the successful deployments by clicking the  (Successful) button:
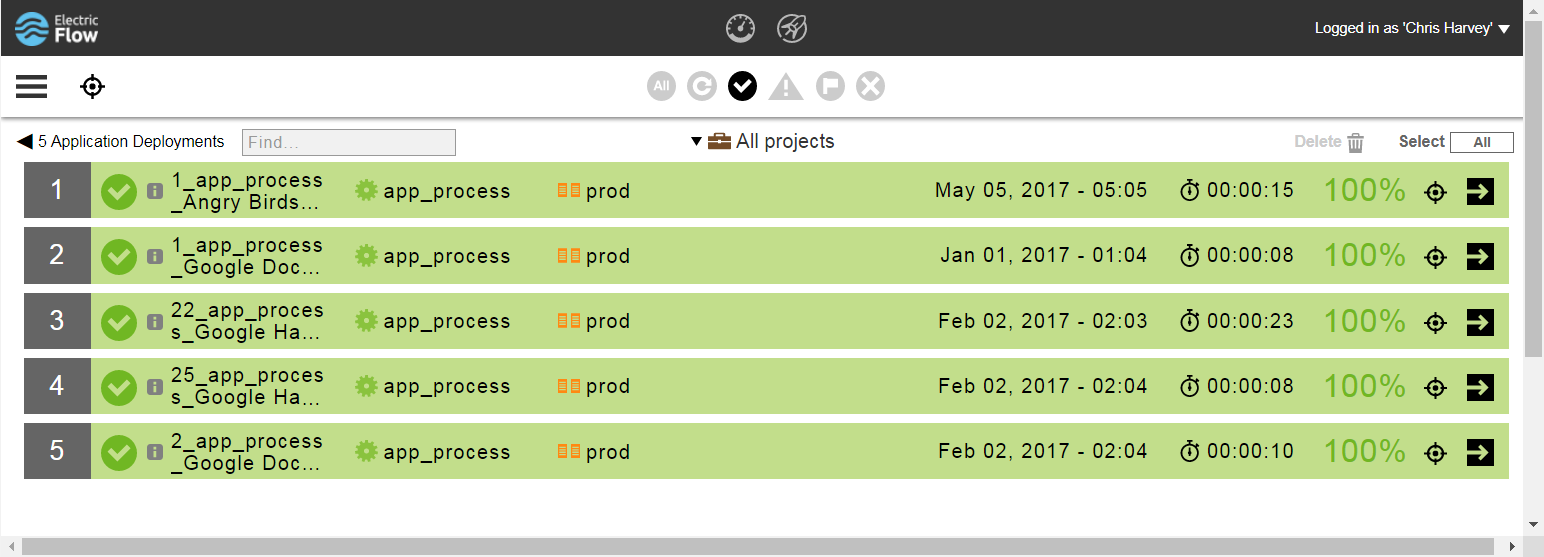
To view the details of a deployment, click the deployment, which opens the Applications / View Run page.
Operate Phase
The Operate phase shows incident metrics associated with the deployed release (post-production). This phase collects data periodically from the EC-ServiceNow plugin. The plugin procedure provides a general field mapping parameter (as do other DevOps Insight enabled plugins), which lets you map any field from the ServiceNow incident table to the incident report object type in the DevOps Insight server.
| Cell | Description |
|---|---|
Total Incidents |
Total number of incidents opened against the release. |
Resolved Incidents |
Number of resolved incidents out of total incidents for the release. |
Average Time to Resolve |
Average time to resolve an incident for the release. |