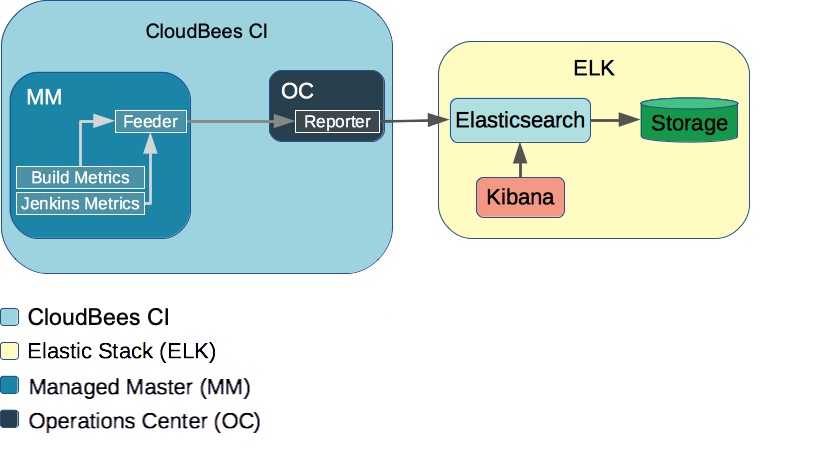
Elasticsearch Reporter is a set of Jenkins plugins that provides connectivity to remotely hosted Elasticsearch 6.x/7.x servers for CloudBees products — providing insight into your usage of Jenkins and the health of your Jenkins cluster by storing data into an Elasticsearch 6.x/7.x cluster that you must provide. Once you have installed and configured the Elasticsearch Reporter plugins, then each managed controller will report events and metrics to operations center, and in turn to Elasticsearch. Then you can use Kibana and other tools that you devise to visualize and analyze that data.
Elasticsearch Reporter can help answer questions such as:
-
How many builds are running on a given controller at any given point in time?
-
What is the size of a build queue on any given controller?
-
What are the JVM statistics (CPU/RAM) of a given controller?
This document explains how to install the Elasticsearch Reporter and configure CloudBees CI to collect analytics data in Elasticsearch and how to visualize that data in Kibana.
Prerequisites
These instructions assume you have a working CloudBees CI installation, an Elasticsearch 6.x/7.x cluster and Kibana 6.x/7.x running and accessible to each other via TCP/IP networking.
Deploying an Elasticsearch Cluster and Kibana
If you do not have Elasticsearch and Kibana installed, there are a variety of ways to install them. The Elasticsearch Setup Guide explains how to install via RPM and DEB packages for Linux, MSI for Windows, Docker, as well as Puppet, Chef and Ansible. Also, you can find a good examples about how to install a Elasticsearch cluster on Kubernetes (Elasticsearch for Kubernetes and kubernetes-elasticsearch-cluster).
The Kibana Setup Guide covers the same installation options. For Kubernetes, you can find an example here.
Managing an Elasticsearch cluster
Managing a production Elasticsearch cluster is not a trivial task. For most purposes, you will want to run a cluster of three or more Elasticsearch nodes. Expect to spend some time learning how to properly deploy, configure, and maintain Elasticsearch cluster.
The Elasticsearch cluster needs at least 3 nodes of 32GB RAM each and Elasticsearch allocated 16GB of heap memory (Xmx) in order to not experience any slowness or degraded performance while running Elasticsearch Reporter.
An index curator should usually be installed to manage storage growth. An index curator removes expired indices and aggregates data.
Elasticsearch Reporter data is stored in Elasticsearch using time-stamped index names. Below is the recommended retention period and the estimated disk space usage:
Name Pattern |
Recommended Retention Period |
Contents |
Disk usage expectation |
metrics-* |
3 days |
Metric reports from Jenkins controllers, which are submitted every 10 seconds. |
450 MB (stable) per connected controller |
builds-* |
1 year |
Builds reported for indexing by managed controllers. Contains minimal data fields needed for reporting. Does not include console logs or artifacts. Starting from Elasticsearch Reporter 1.8.100 does not include detailed info about nodes, this data has been moved to the nodes-* index. |
2k per build |
nodes-* |
1 year |
Node configuration changes reported for indexing by managed controllers. Event examples: node config save, creation/deletion of nodes. Such data will be recorded for all node types including ephemeral and cloud-provisioned nodes. |
1k per configuration change |
items |
Forever |
Minimal information about each job and folder. |
1k per job or folder |
|
Example of disk usage.
On a CloudBees CI and cluster with 3 managed controllers this would use about 2GB of disk space used per day. (operations center + 3 x managed controllers) * 450 = 1.8GB (1000 x builds) = 2MB (100 x nodes changes) = 100k (100 x items changes) = 100k |
Elasticsearch Reporter configuration
To enable and configure Elasticsearch Reporter, log into operations center, upload a set of plugins, and then configure those plugins to connect to your existing Elasticsearch cluster. Then, perform similar steps for each of your managed controllers.
The configuration is grouped into two sections, "Elasticsearch Reporter" and "managed controller Elasticsearch Reporter Reporting" (with the Elasticsearch Reporter Reporting Configuration shown but not user configurable). These sections are explained below.
Step 1: Get Elasticsearch and Kibana information
You will need to have this information ready before you start:
-
URL of Elasticsearch
-
Username and Password for connecting to Elasticsearch
-
URL of Kibana
-
Username and Password for connecting to Kibana
-
Ensure that Elasticsearch 6.x/7.x is up and running
-
Ensure that Kibana 6.x/7.x is up and running
Step 2: Install Elasticsearch Reporter plugins in operations center
| Operations Center Analytics MUST be disabled to be able to install Elasticsearch Reporter. In Manage Jenkins / Manage Plugins, go to the Installed tab and ensure that all Operations Center Analytics* plugins are either not installed or disabled. |
Sign in to operations center, select Manage Jenkins and then Manage Plugins.
Go to the Available tab then search and install these four plugins:
-
Elasticsearch Reporter
-
Elasticsearch Reporter Configuration
-
Elasticsearch Reporter Feeder
-
Elasticsearch Reporter Reporter
|
In case you do not see these plugins in the Available tab, make sure you refresh the update center metadata by clicking on the Check now button at the bottom of the page. If, after a metadata refresh, you still do not see the plugins, go to the Advanced tab and use Upload Plugin to upload each of these plugins:
|
Restart. When you install the last of those plugins, select the checkbox that says Restart Jenkins because the operations center must be restarted before the plugins can be used.
Step 3: Install Elasticsearch Reporter plugins in managed controllers
Log in to managed controller, select Manage Jenkins and then Manage Plugins.
Go to the Available tab then search and install these two plugins:
-
Elasticsearch Reporter Configuration
-
Elasticsearch Reporter Reporter
|
In case you do not see the plugins in the Available tab, make sure you refresh the update center metadata by clicking on the Check now button at the bottom of the page. If, after a metadata refresh, you still do not see the plugins, go to the Advanced tab and use Upload Plugin to upload each of these plugins:
|
Restart. Same as you did for operations center, when you install the last of those plugins, select the checkbox that says Restart Jenkins because the managed controller must be restarted before the plugins can be used.
Step 4: Configure Elasticsearch Reporter in operations center
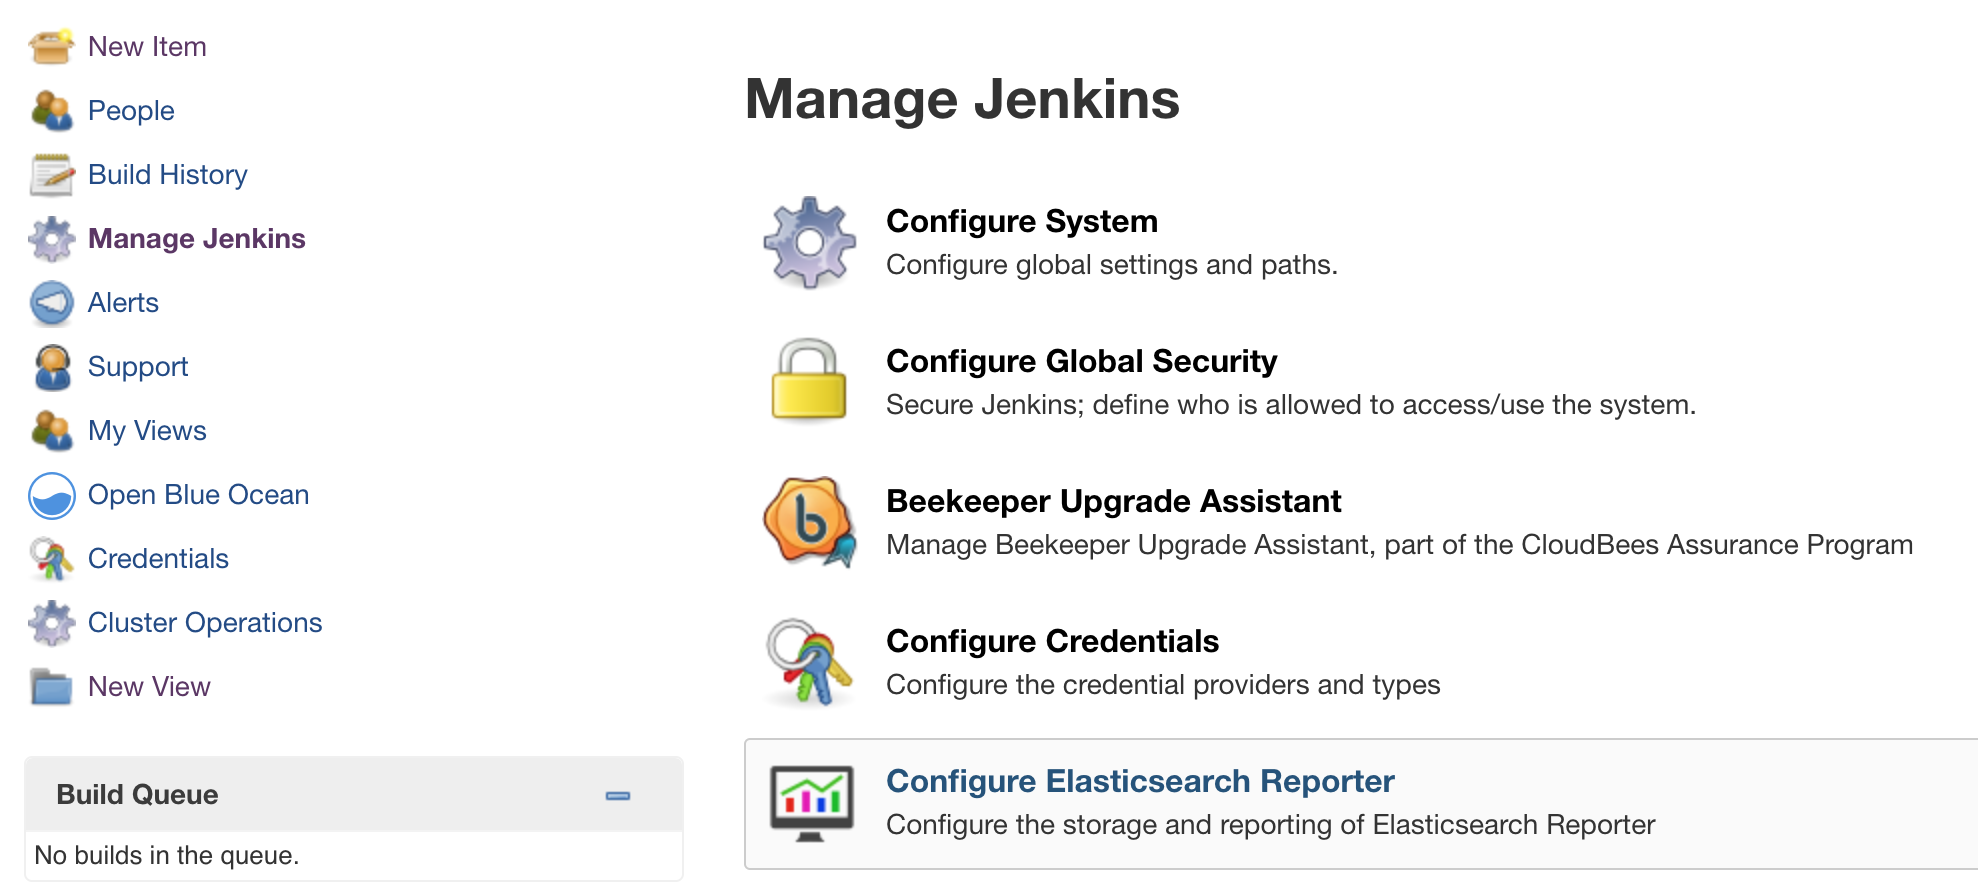
Log in to operations center again, select Manage Jenkins and then Configure Elasticsearch Reporter.
Elasticsearch Reporter
These settings are on Manage Jenkins/Configure Elasticsearch Reporter page.
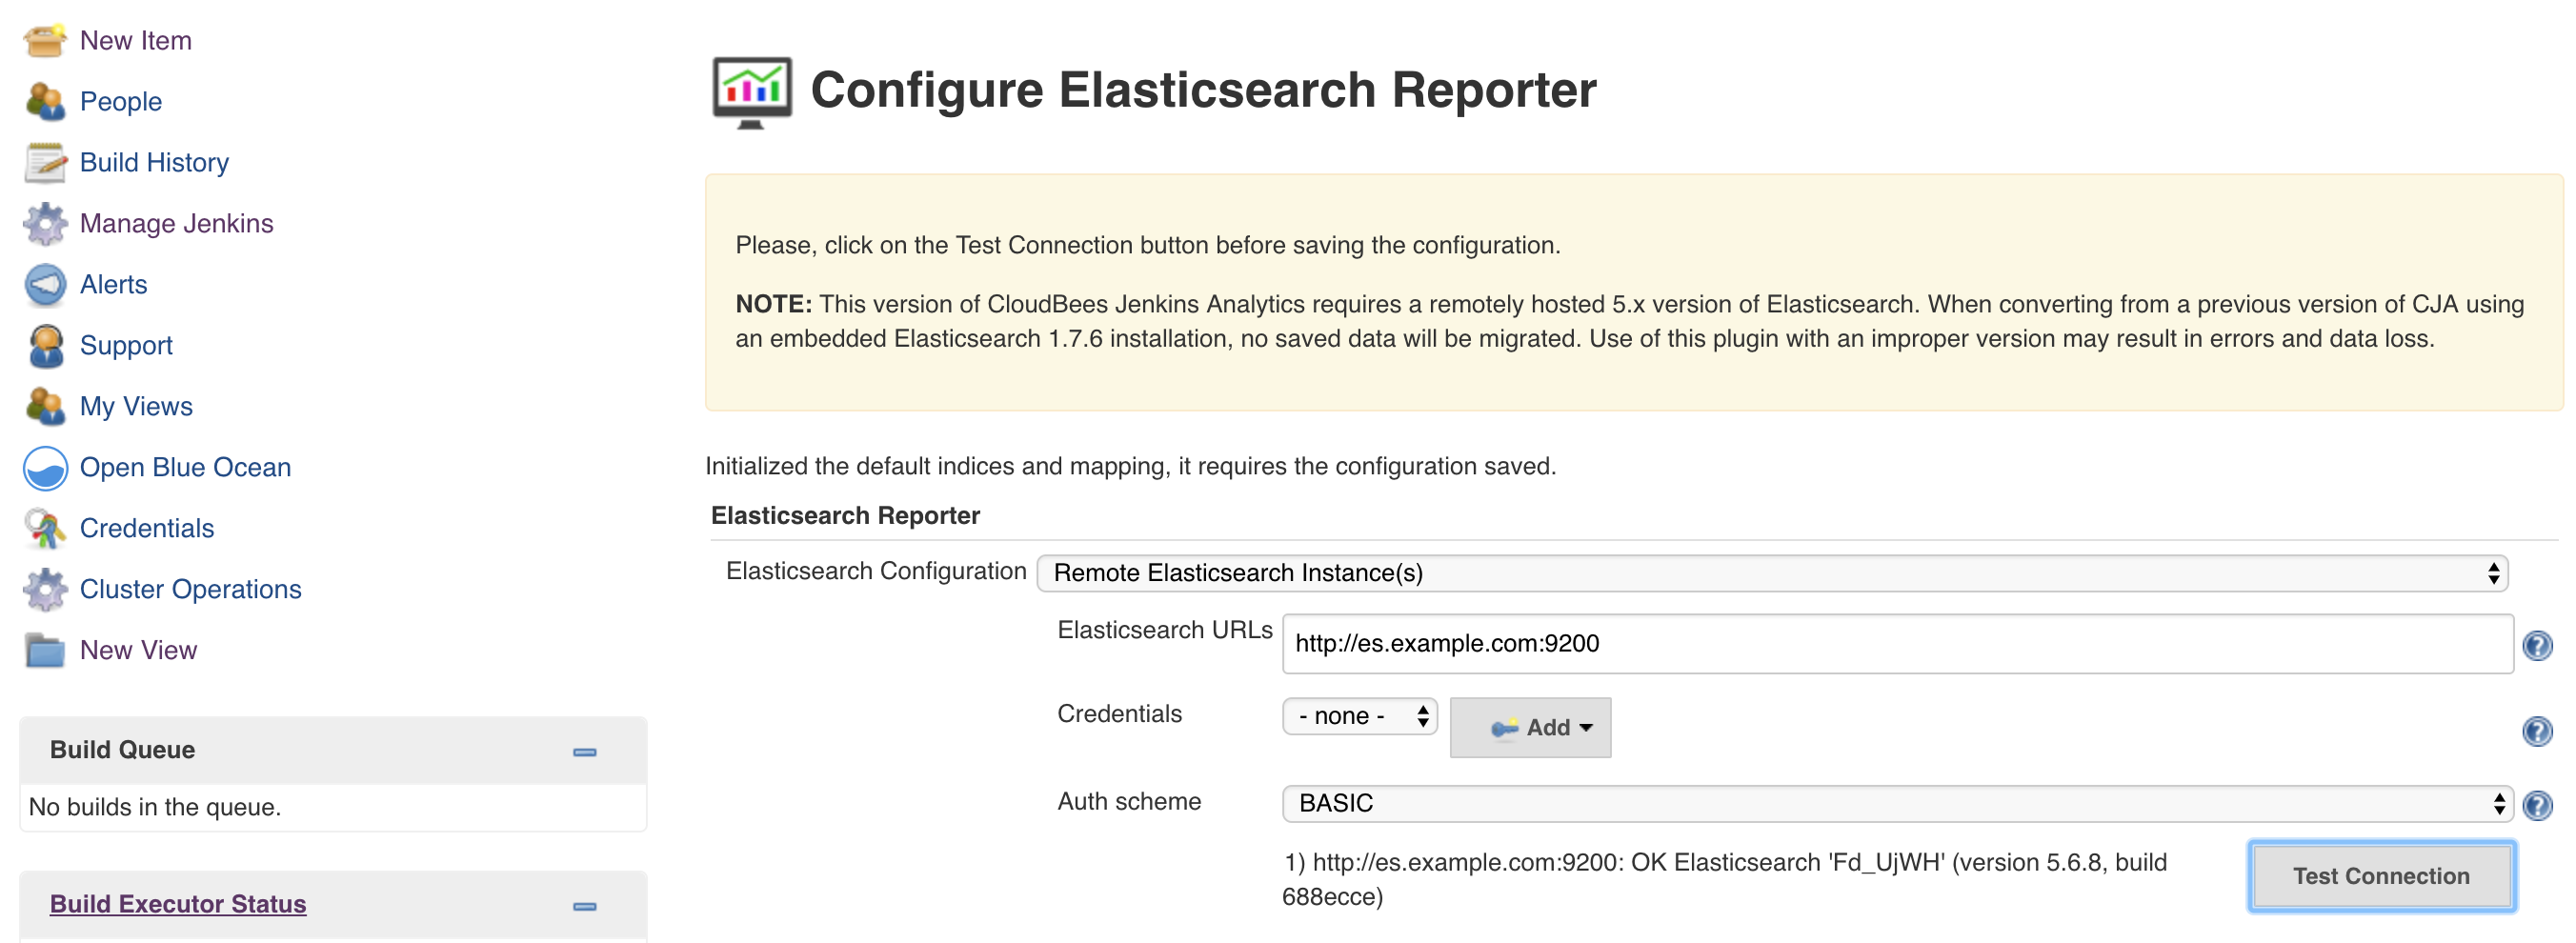
This section allows the user to perform basic Elasticsearch configuration. The ability to configure Elasticsearch is enabled by selecting Remote Elasticsearch Instance(s) from the dropdown list. This will display three fields and a button.
| Value | Description |
|---|---|
Elasticsearch URLs |
This is the URL which identifies the Elasticsearch server endpoint |
Credentials |
These are the credentials used to access Elasticsearch and depend upon the configuration of the Elasticsearch server. |
Auth Scheme |
This is the authorization scheme (BASIC, DIGEST, None) to be used accessing the Elasticsearch server, and depend upon the configuration of the server. |
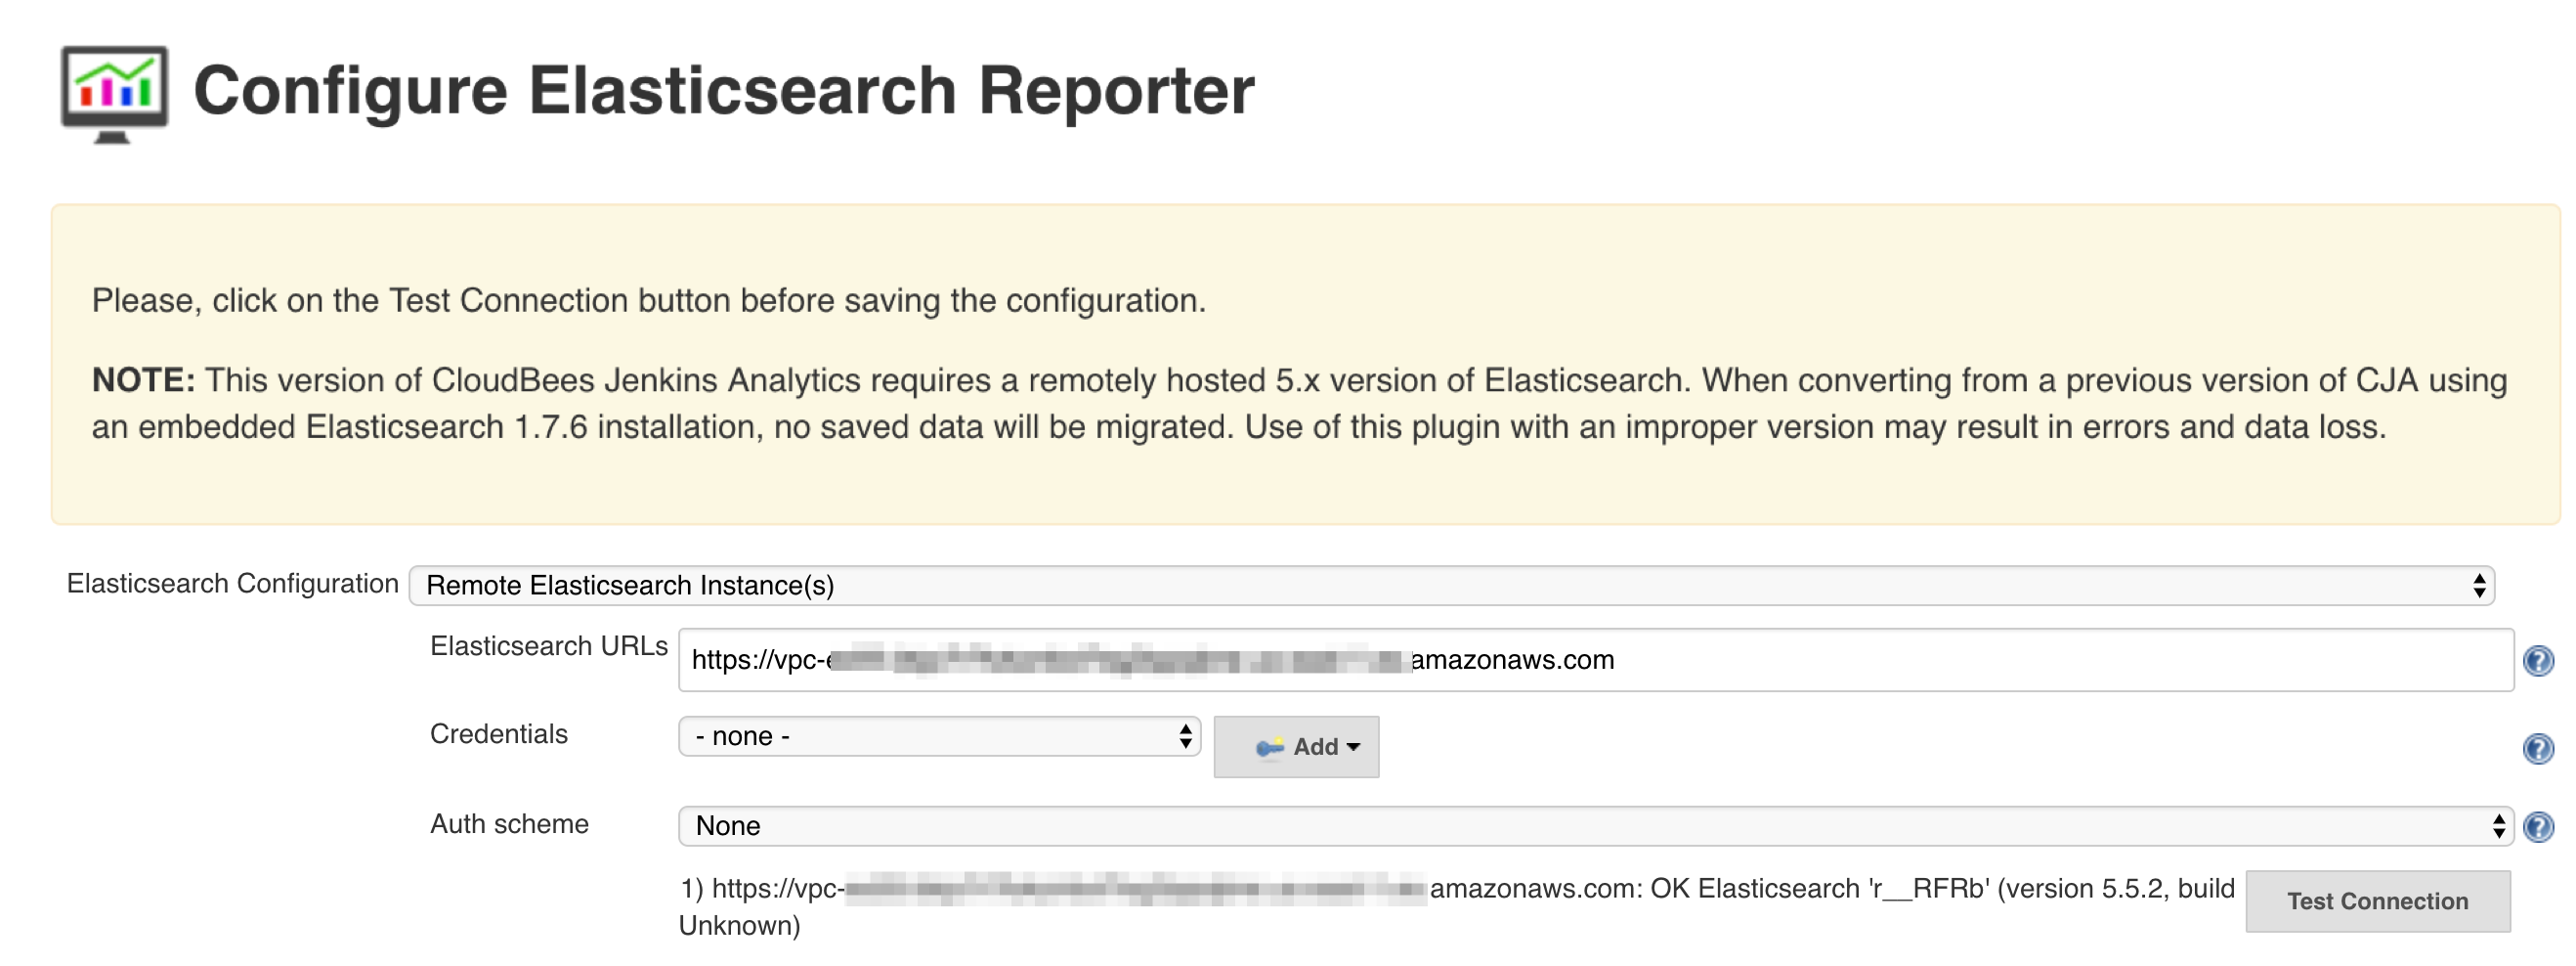
Finally, there is a Test Connection button which can be used to validate that the details entered above are functional. If successful, an OK response will be displayed to the left of the button. It will include data from the server, including the version being run. You should see a minimum version of 6.x/7.x as the Elasticsearch server version.
Step 5: Configure Elasticsearch Reporter in managed controllers
There are two checkboxes in this section and both are selected by default. These defaults are common choices and it is recommended not to alter them. These options control the following capabilities.

| Value | Description |
|---|---|
Enabled by default |
This controls whether new managed controllers have Elasticsearch Reporter reporting enabled upon startup |
Allow per-controller overrides |
This enables the ability for individual controllers to enable/disable Elasticsearch Reporter reporting individually |
On the managed controller configuration page, it is possible to enable/disable Elasticsearch Reporter Reporting by setting this checkbox.

If Elasticsearch Reporter Reporting is enabled by default, you will see on the managed controller Manage Jenkins/Configure Elasticsearch Reporter page on the following screen. The configuration is not editable because it is enforced by operations center.

If you do not enable Elasticsearch Reporter reporting by default, you can enable the CloudBees CI managed controller that you want reporting metrics from by entering the managed controller’s Manage Jenkins/Configure Elasticsearch Reporter page. Once there, select its Enable checkbox and configure the Reporting Endpoint and Reporting Interval. This managed controller will report performance and build events to a reporting endpoint for analysis in operations center.

There are two checkboxes, and both default to enabled. One selects whether Elasticsearch Reporter reporting is on by default, and the other controls whether per-controller overrides are allowed.
Value |
Description |
Reporting Endpoint |
The URL to which this Jenkins will report events. If the reporting is being performed to operations center, the default reporting endpoint URL is "${OC_URL}/feeder". |
Reporting Interval |
How often (in seconds) that events will be reported to the Reporting Endpoint. |
Report Elasticsearch Reporter data
Finally, create some jobs and execute a few build to check the data is correctly sent to Elasticsearch.
Metrics available on Elasticsearch Reporter
The Elasticsearch Reporter plugin catches the metrics exposed by other plugins.
The main plugin which exposes these metrics is Metrics Plugin which defines an API for integrating the Dropwizard Metrics API within Jenkins. More information about the specific metrics exposed by the Jenkins Metrics Plugin can be found at Monitoring Plugin.
Other plugins can also expose different metrics like the Metrics Disk Usage plugin. If more metrics are needed, you might want to implement those metrics on a Jenkins plugin or look for a plugin that already exposes what you are looking for.
Configure reporting periods
Some interval time settings are managed by Java properties. These settings change the time between checks or reports.
Property |
Default period value |
Description |
com.cloudbees.esr.FeederConfiguration.PERIOD |
60 seconds |
Frequency to report data to Elasticsearch/operations center |
com.cloudbees.esr.IndexCurator.PERIOD |
240 minutes |
Frequency to checks about indices created and setting correctly |
com.cloudbees.esr.ESHealthCheckPeriodicWork.PERIOD |
2 minutes |
Frequency of Elasticsearch health checks |
com.cloudbees.esr.reporter.JocAnalyticsReporter.PERIOD |
60 seconds |
operations center Frequency to report metrics to Elasticsearch |
com.cloudbees.esr.reporter.metrics.AperiodicMetricSubmitter.PERIOD |
60 seconds |
managed controller Frequency to reports metrics to operations center |
Known limitations (errata)
This section contains info about Elasticsearch Reporter limitations in the current version.
Build Elasticsearch Reporter - node label usage statistics
Jenkins supports the definition of complex labels for nodes, including expressions with logic operators and conjunctions. This level of complexity is not currently supported by Elasticsearch Reporter, and labels having complex expressions do not report correctly. As a workaround, it is possible to simplify node label expressions by defining multiple labels for the same node.
Amazon Elasticsearch services
Elasticsearch Reporter is compatible with Amazon Elasticsearch services. Amazon Elasticsearch services are a cloud solution provided by Amazon. The service allows you to manage your Elasticsearch service from the Amazon web console. CloudBees CI supports Elasticsearch 6.x/7.x versions.
-
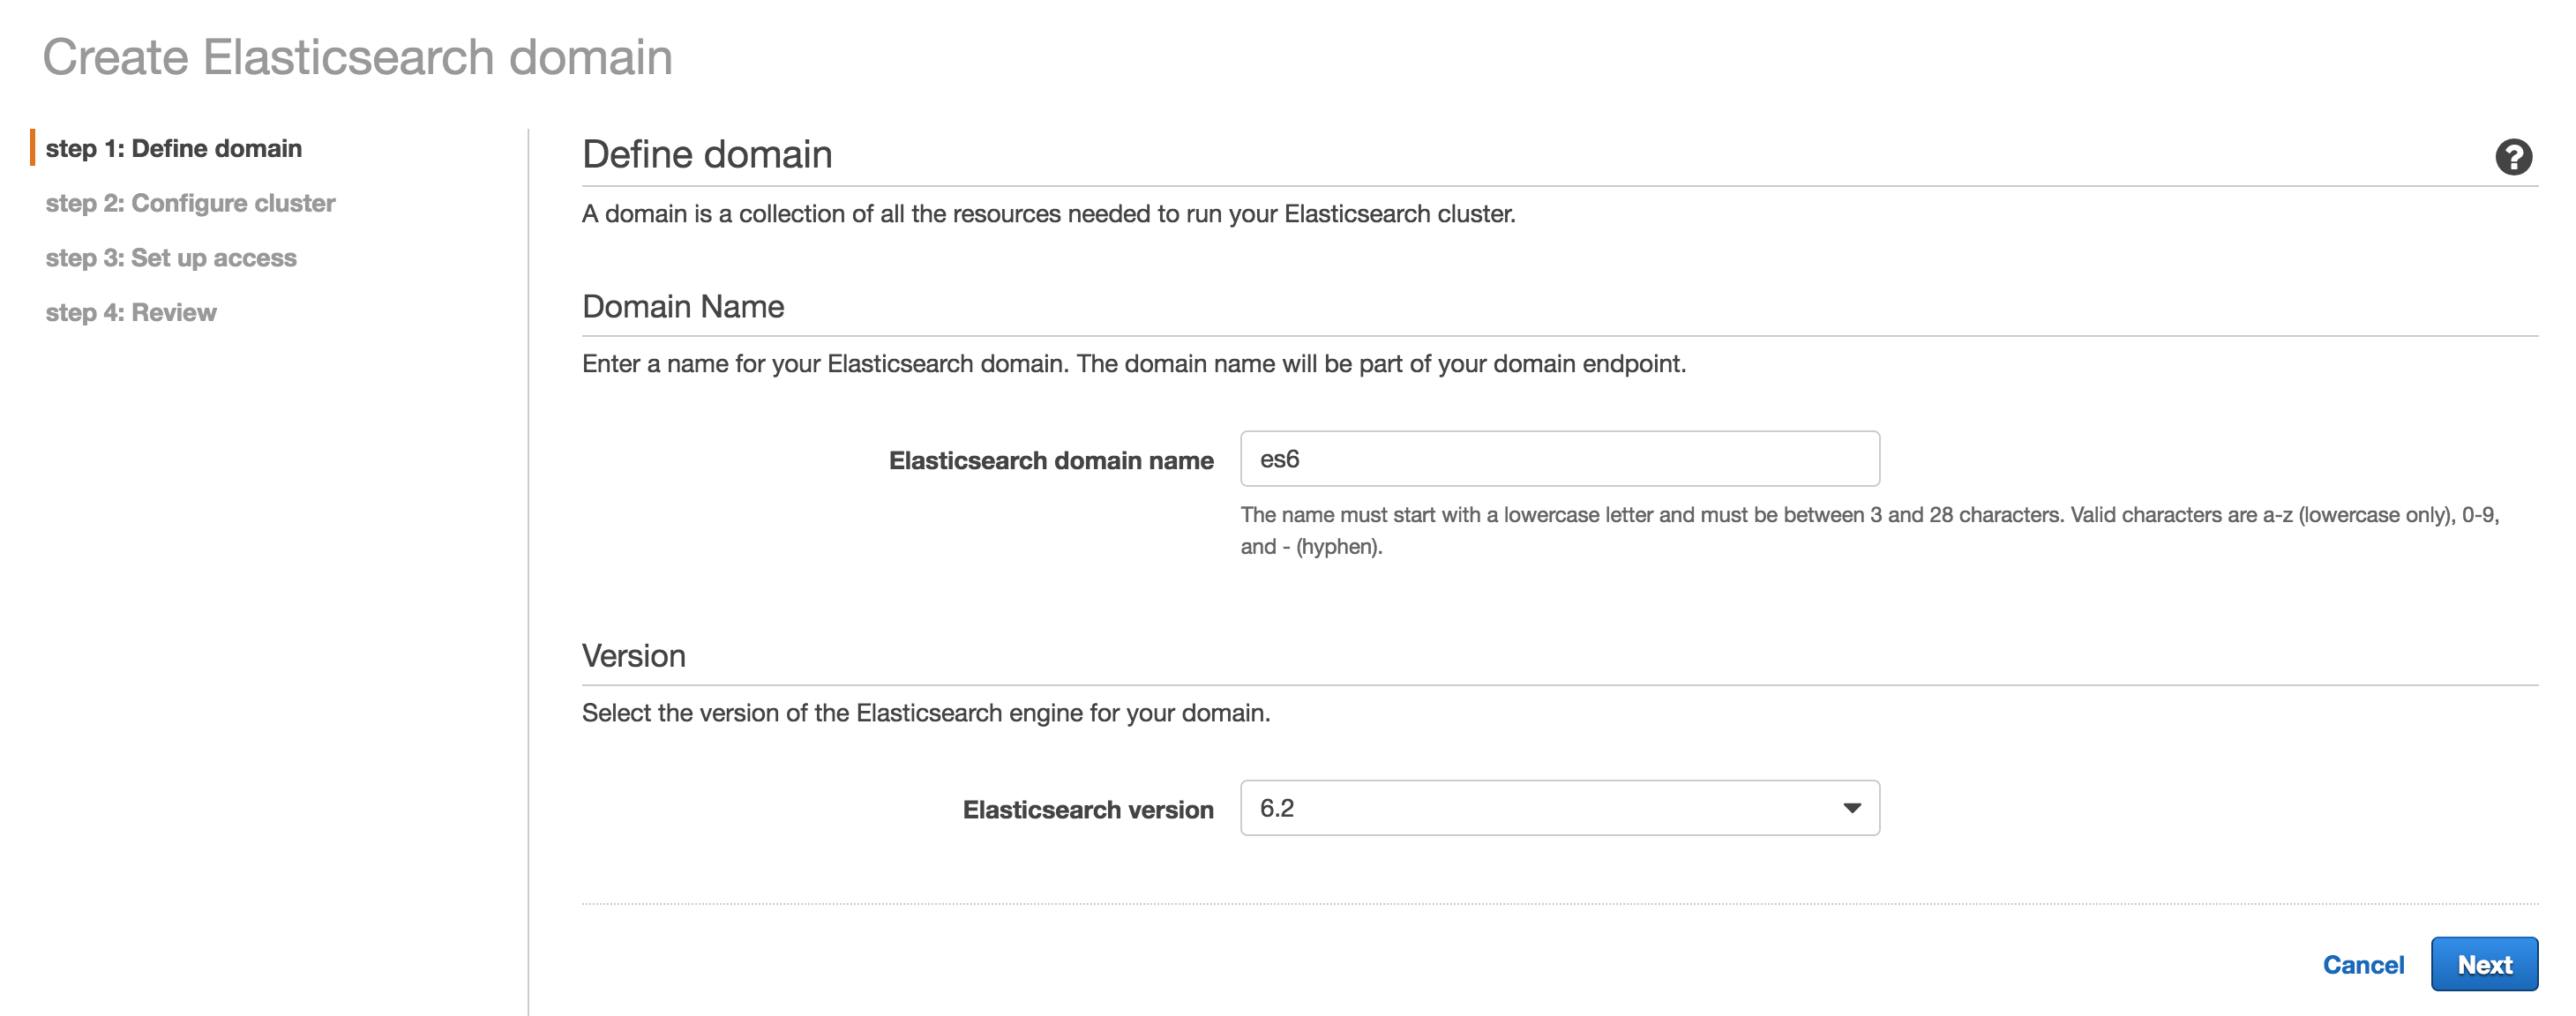
Create a new domain - Creating and Configuring Amazon Elasticsearch Service Domains
-
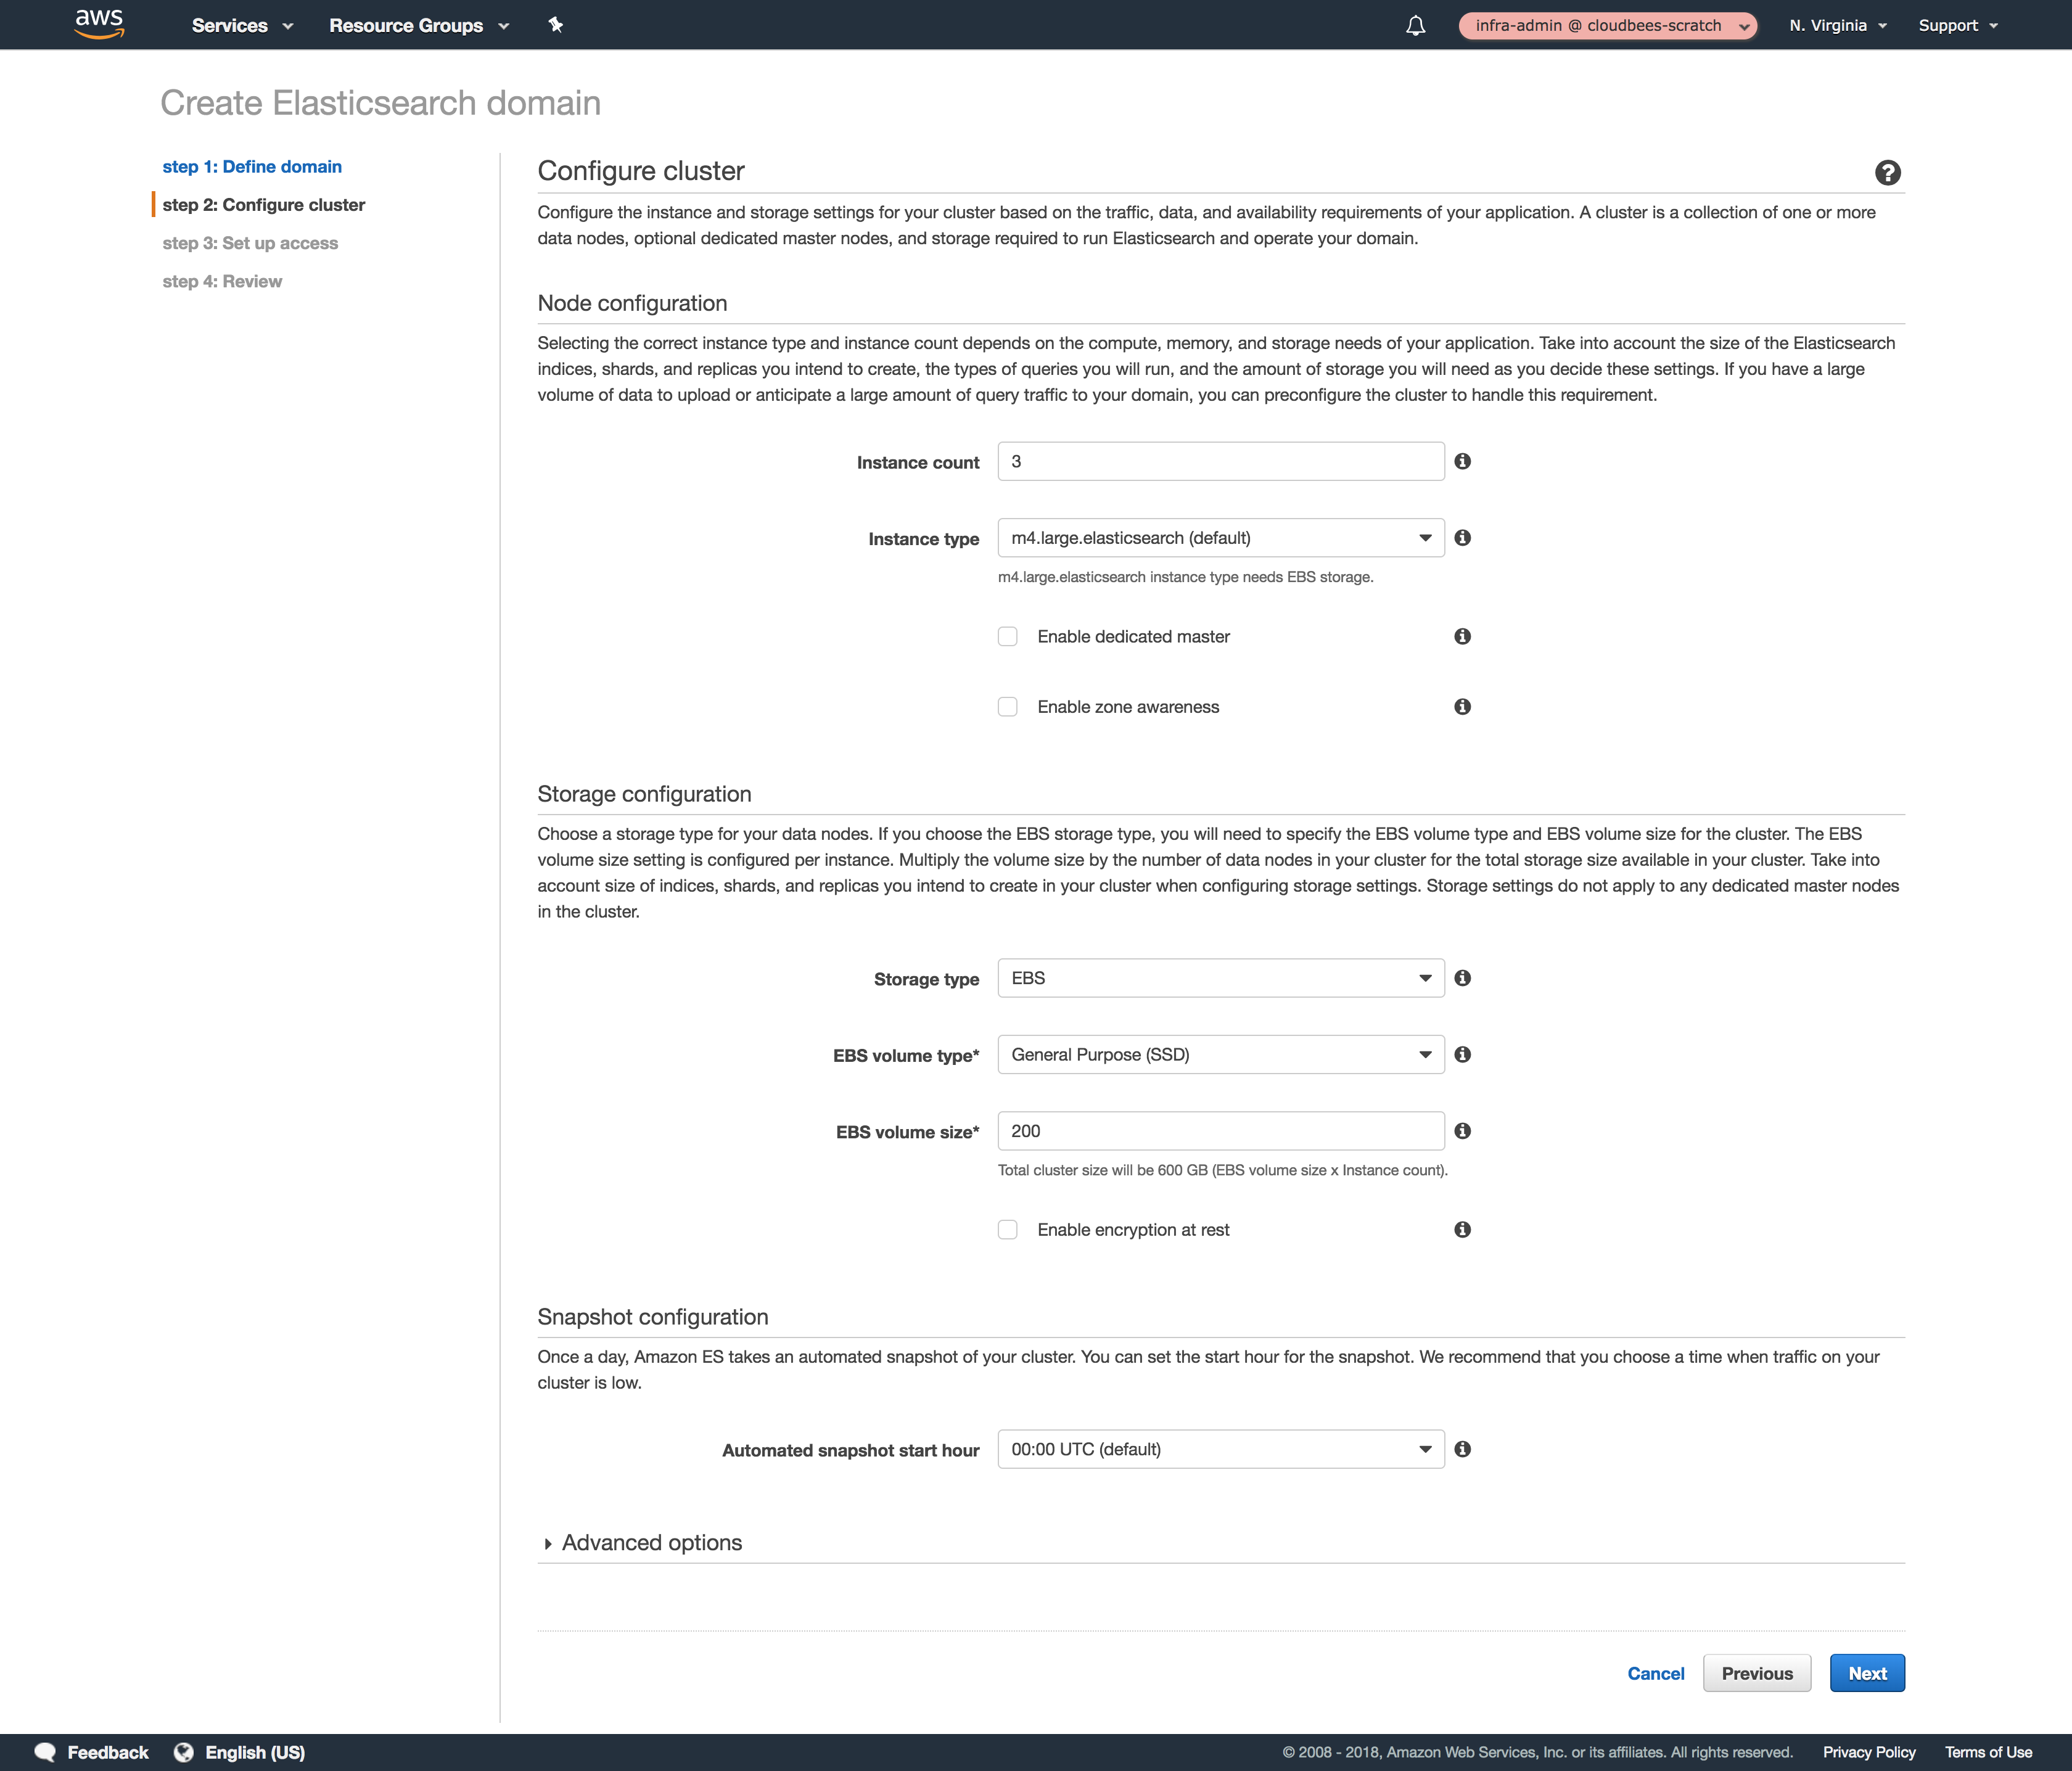
Configure the cluster settings
-
At least three instances m4.large
-
Al least 200G EBS General Purpose (SSD)
-
-
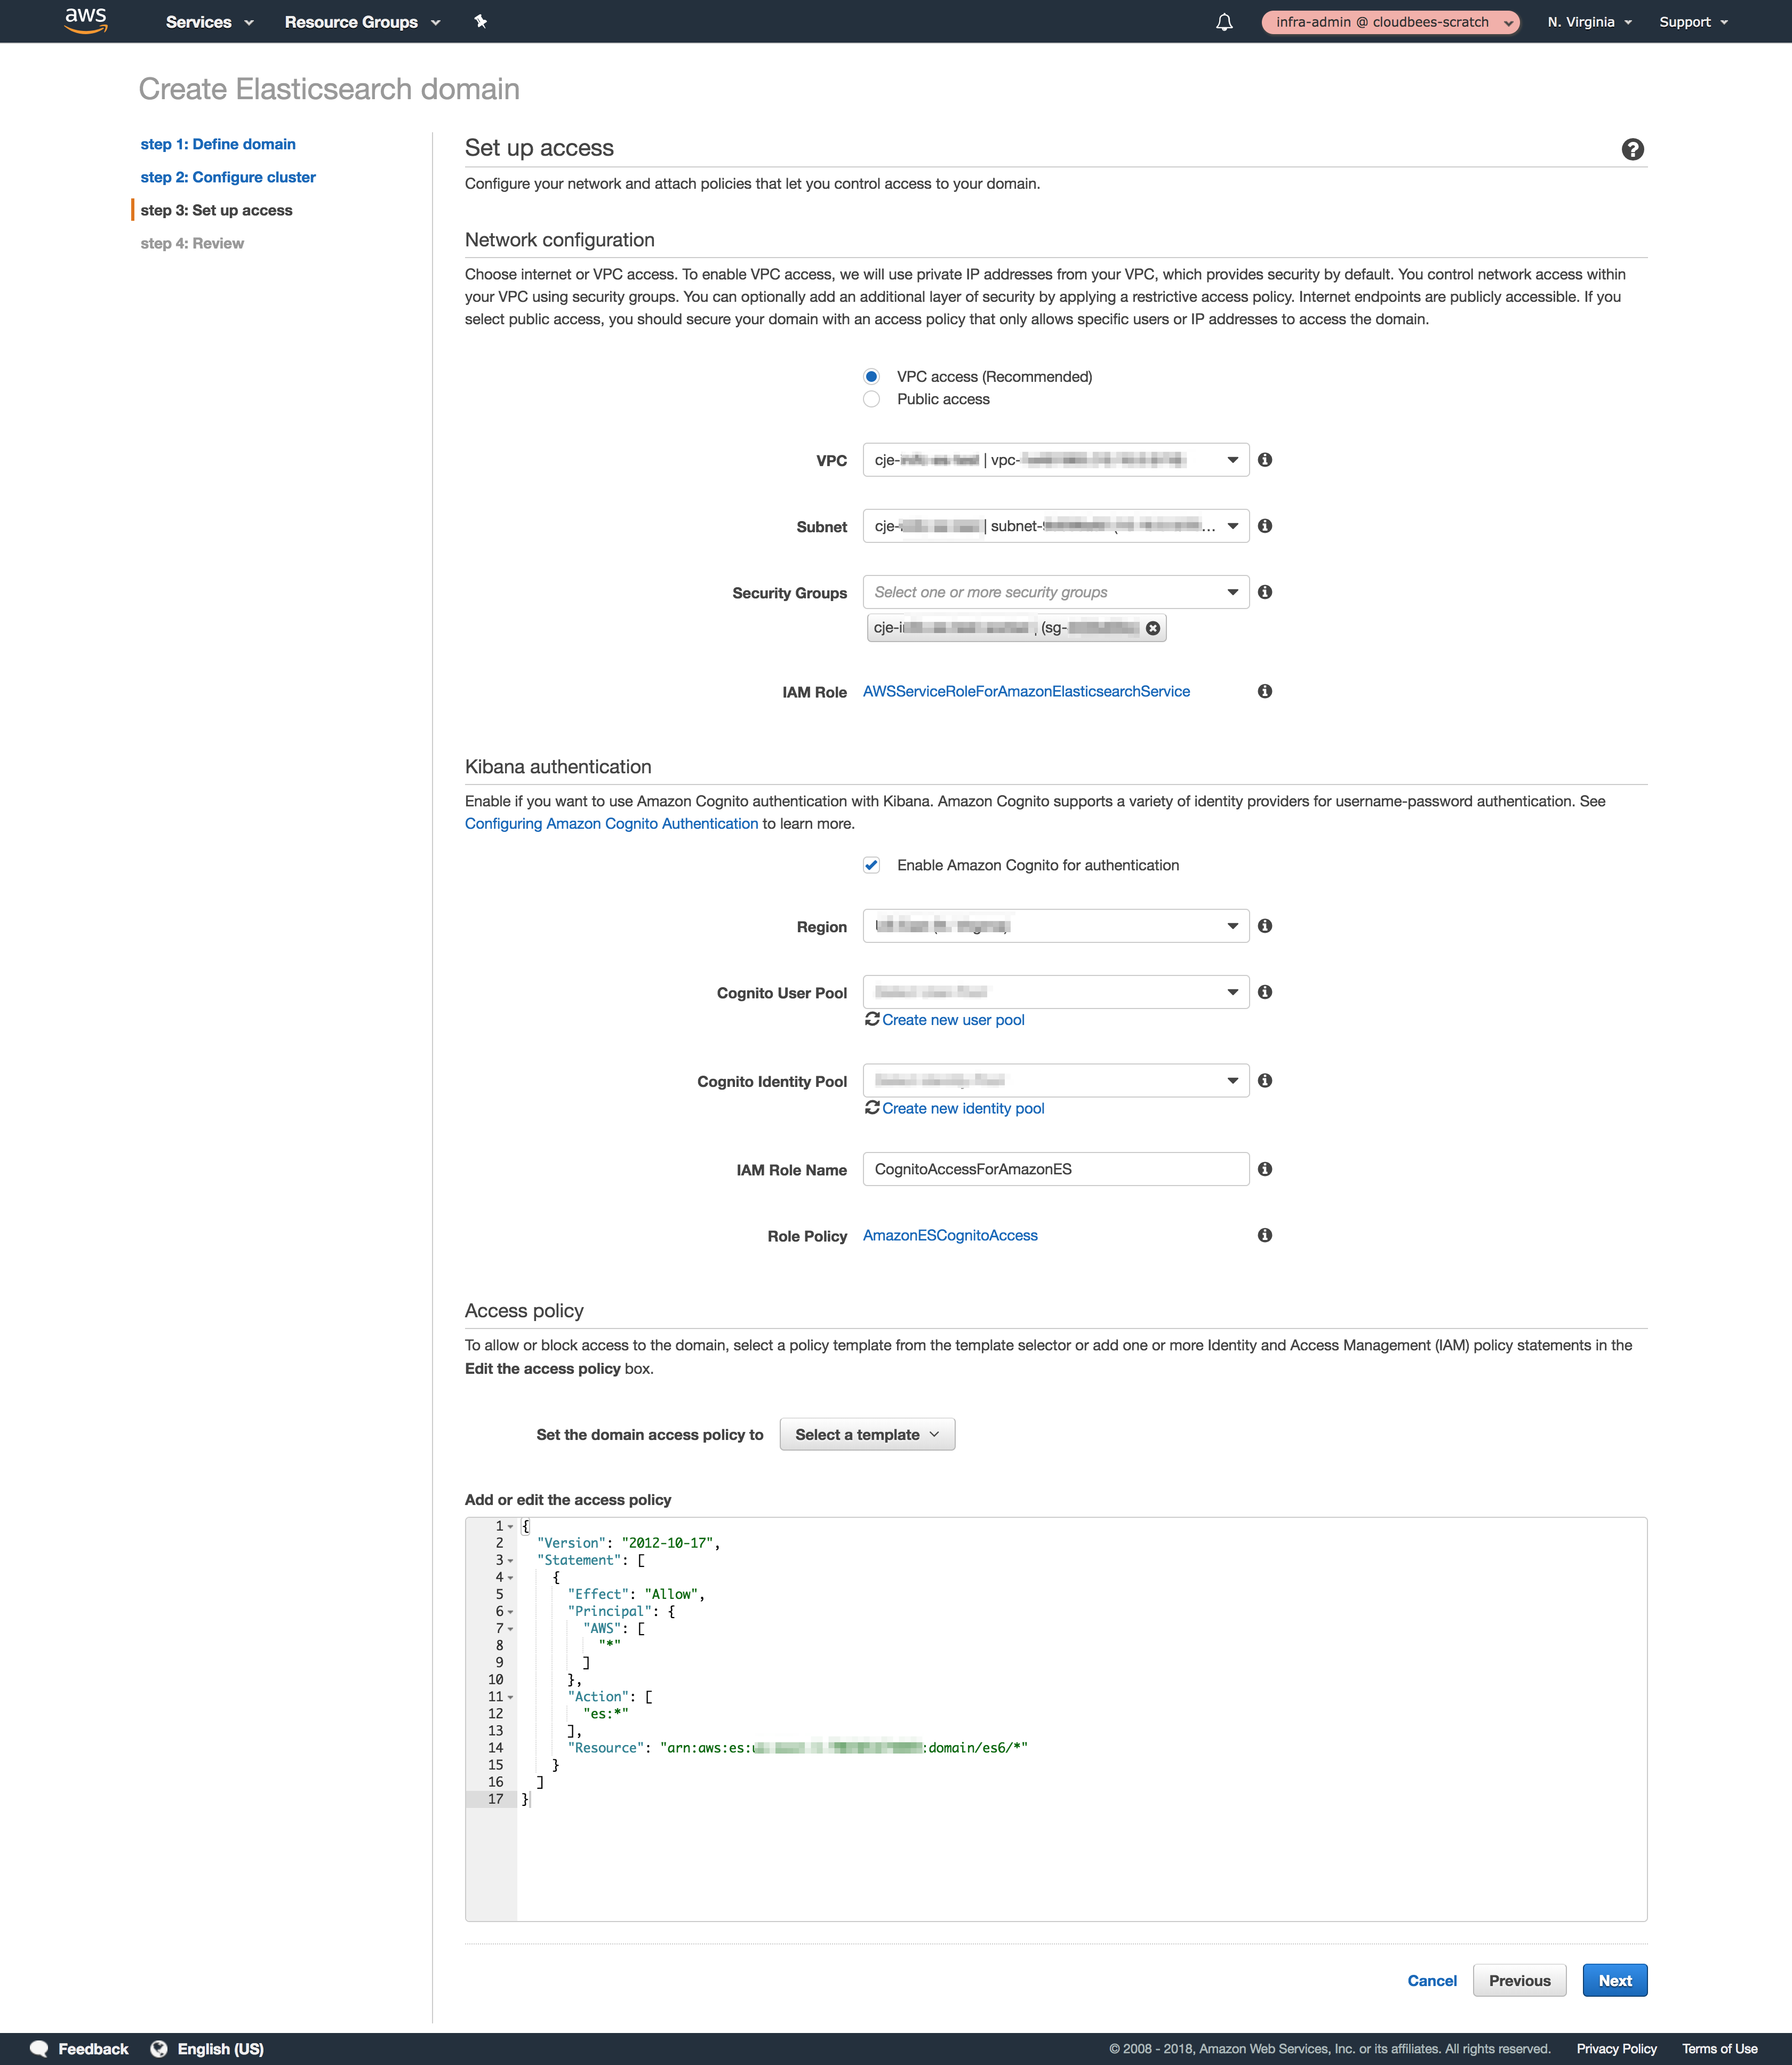
Configure security
-
Configure VPC access, your security group must allow inbound traffic to the port 443 from your VPC/IP/Network
-
Configure Amazon Cognito Authentication for Kibana
-
-
Configure Elasticsearch Reporter
Kibana examples
Example visualizations and dashboards
Since Kibana is no longer bundled with the product, a set of sample Visualizations and Dashboards is being made available. These examples are not exhaustive, but do replicate some of the Visualizations that were previously provided.
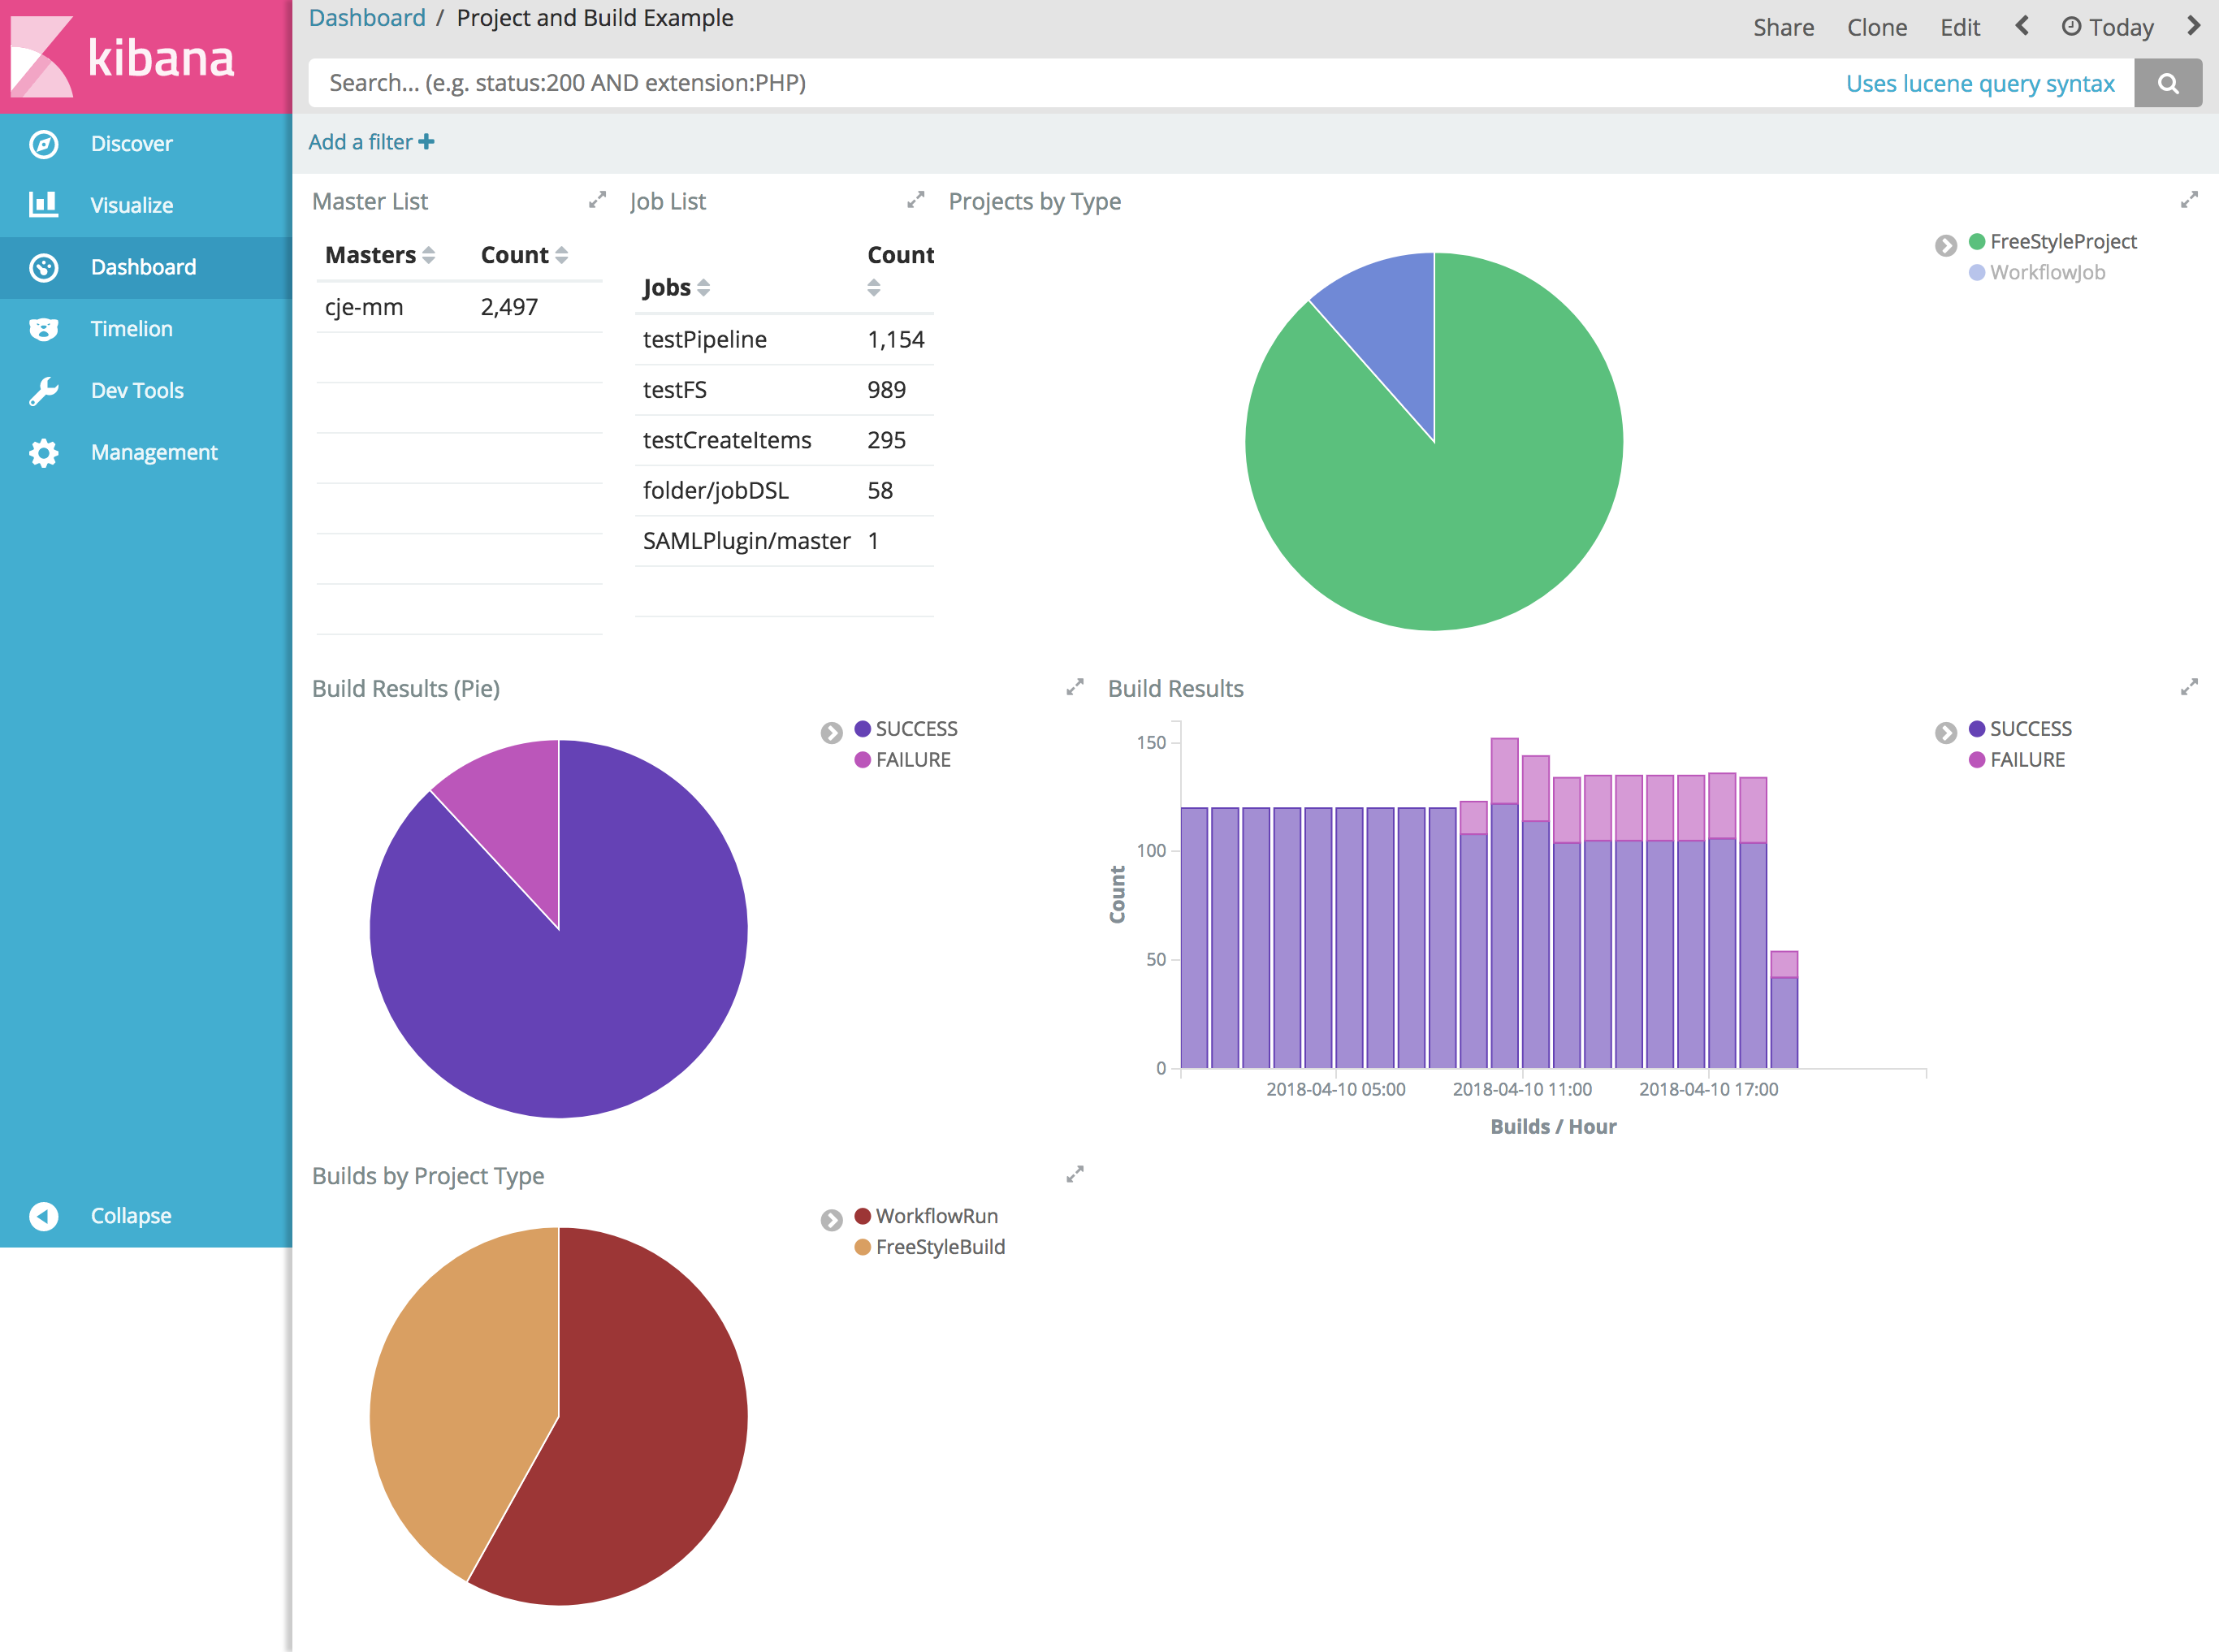
The provided examples are divided into two different areas, "build" and "performance". The "build" visualizations and dashboard provide insights into builds performed in the CloudBees CI cluster. The "performance" visualizations provide load related metrics from the CloudBees CI cluster.
The list of build related visualizations are :
| Visualization | Type | Description |
|---|---|---|
Master List |
Data Table |
This is the list of managed controllers that have participated in reported builds |
Job List |
Data Table |
This is the list of Jobs that have participated in reported builds |
Build Results |
Vertical Bar |
This shows the results of builds over time as a bar chart |
Build Results |
Pie Chart |
This shows the same as above, but in a different form |
Projects by Type |
Pie Chart |
This shows a breakdown of the different job types configured in the cluster |
Builds by Project Type |
Pie Chart |
This shows a breakdown of builds by type (Freestyle, Pipeline, etc.) |
The list of performance related visualizations are :
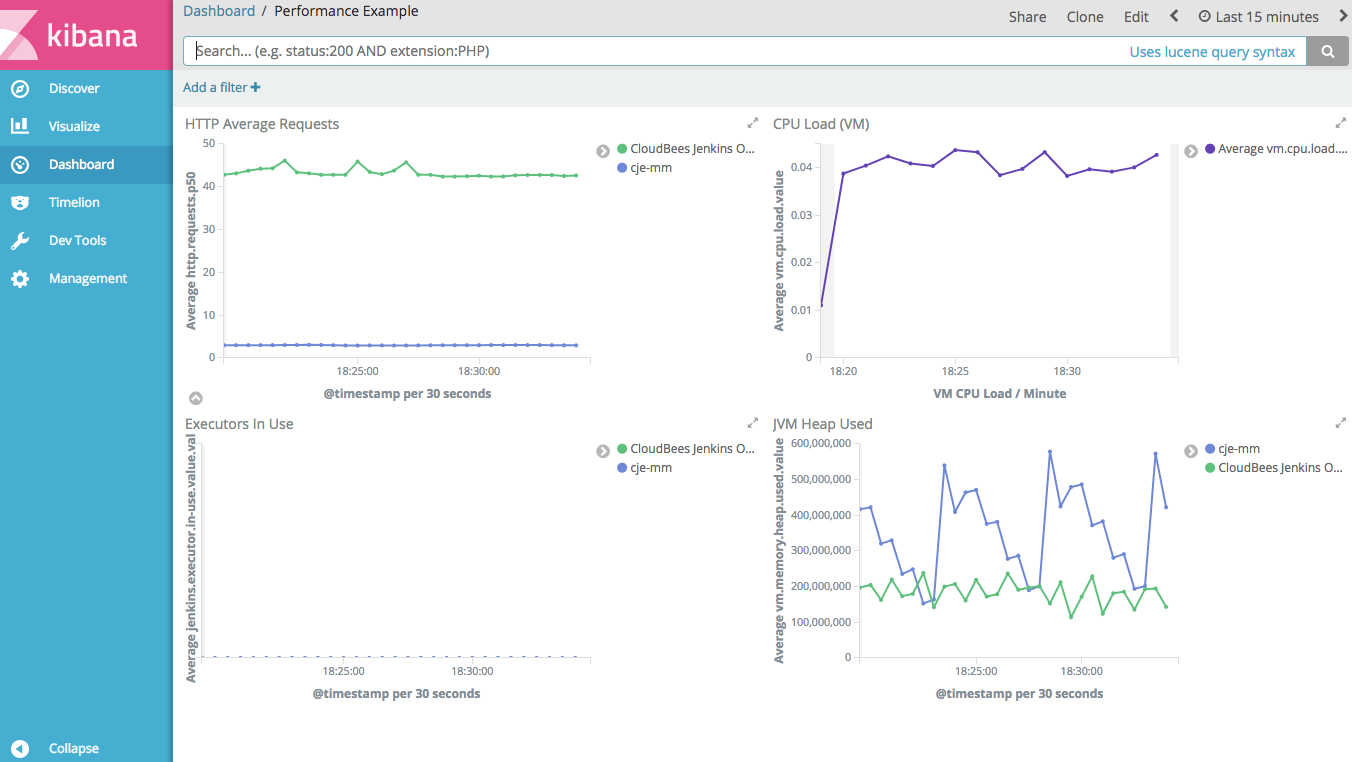
| Visualization | Type | Description |
|---|---|---|
CPU Load (VM) |
Line |
This details the CPU load for all nodes reporting metrics |
Executors in Use |
Line |
This reports the number of executors used in the displayed builds |
HTTP Average Request Time |
Line |
This reports the HTTP request times for the cluster servers |
JVM Heap Used |
Line |
This reports heap usage across all JVM instances in the cluster |
Create Kibana index pattern
Before you can import the example dashboard you need to make sure that there is some data in Elasticsearch and some index patterns defined in Kibana. So, after you configure the Elasticsearch Reporter plugins, run some pipelines to generate some data. Then, login to Kibana and create the required index patterns.
Go to the Management page of Kibana and create the patterns builds-*, metrics-*, nodes-*, and items as described below.
To better understand this process, please refer to the Kibana documentation on index-patterns here: Defining Your Index Patterns.


These are the index patterns that you must create:
Index |
Time field |
items |
N/A |
builds-* |
@timestamp |
nodes-* |
@timestamp |
metrics-* |
@timestamp |
It is possible to create the index pattern using the Elasticsearch REST API. The following script creates the index patterns used by the example Kibana visualizations:
#!/bin/sh ES_URL="http://elasticsearch:9200" createIndexPattern(){ local index=${1:-?} local timeFieldName=${2:-?} curl -XPUT ${ES_URL}/.kibana/index-pattern/${index} -d "{\"title\" : \"${index}\", \"timeFieldName\": \"${timeFieldName}\"}" } createIndexPattern "items" "" createIndexPattern "builds-*" "@timestamp" createIndexPattern "nodes-*" "@timestamp" createIndexPattern "metrics-*" "@timestamp"
Installation of Kibana examples
The installation of the Kibana example visualizations and dashboards uses the standard Kibana "import" capabilities. One prerequisite is that the system have been running for some time and the Elasticsearch database needs to have been populated with some data. Until the main indexes exist in Elasticsearch, Kibana will fail to find the indexes referenced in the saved visualizations and dashboards.
Assuming you have met the prerequisite above, on the left-hand navigation pane, click on the Management link. This will display a Management page. On that page, click on the Saved Objects link. On that page, there will be an Import button in the upper right-hand corner.

Clicking on the Import button will cause a file navigator to be displayed. Use it to navigate to where the Kibana Examples JSON File is located, and select that file. You will be shown a pop-up that asks the question:

Answer "Yes, overwrite all" to that question. The assumption is that you are either loading these visualizations fresh, or are re-loading them to return to the initial saved version of those Kibana definitions. This will result in one final pop-up dialog being displayed.
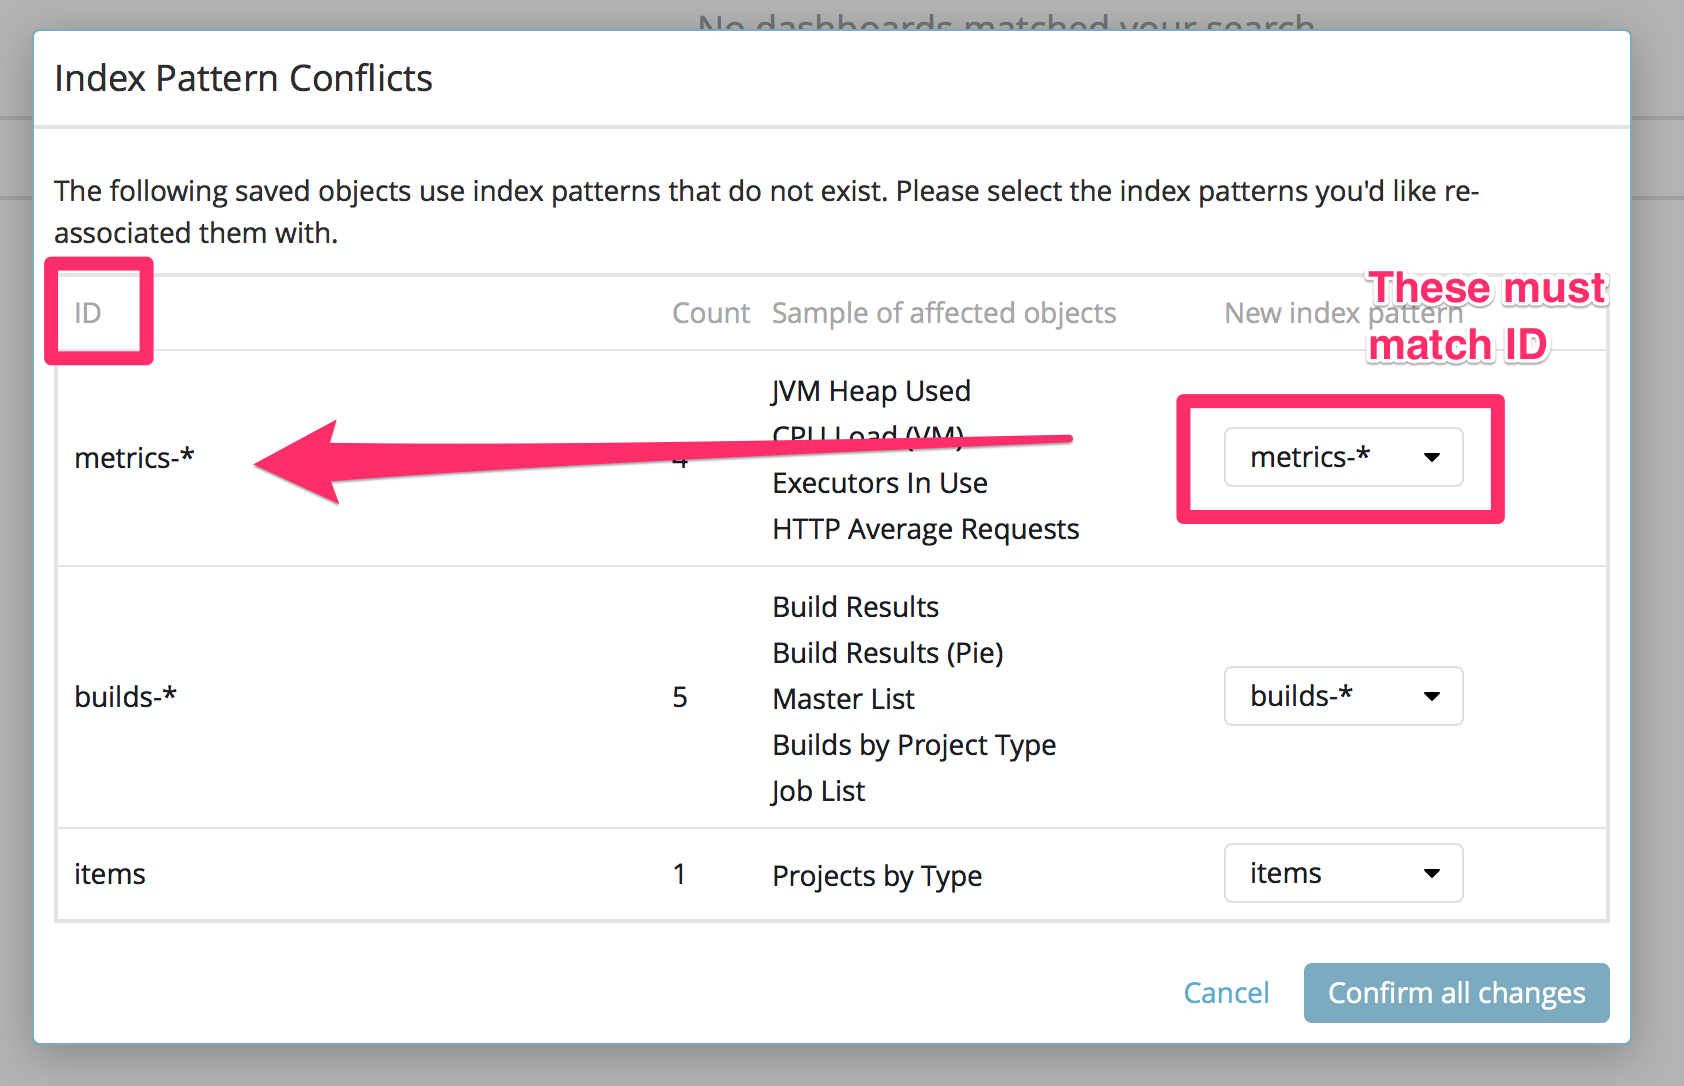
When you import, you will probably see another pop-up, which indicates that you have "Index Pattern Conflicts". If so, then you must make sure that the fields on the right-side of the pop-up match the IDs on the left side of the pop-up. The image below shows how you should configure the conflicts pop-up:
With that done, you will be redirected to the saved objects page. On the Dashboards tab you should see two dashboards ('Performance Example' and 'Project and Build Example') and on the Visualizations tab should see ten different visualizations, detailed in the previous section of this document.
Migrate data from Elasticsearch 1.7.x
If you have been using CloudBees Jenkins Analytics and you need to migrate the existing data from the old Elasticsearch 1.7.x to the new Elasticsearch 6.x/7.x, Elastic recommends using the following procedure Upgrading with reindex-from-remote
-
Start Elasticsearch 1.7.x
-
Start a new Elasticsearch 6.x/7.x instance
The following script it is an example about how to make it.
#!/bin/sh ES_URL="http://es.example.com:9200" ES_URL_NEW="http://es_new.example.com::9201" #AUTH=', "username": "user", "password": "pass"' for i in $(curl -s -XGET "${ES_URL}/_all" |jq keys[]|grep -v kibana-4-cloudbees) do INDEX_NAME=$(echo ${i}|tr -d '"') echo "Create index ${INDEX_NAME}" curl -XPUT "${ES_URL_NEW}/${INDEX_NAME}?pretty" -d'{ "settings" : { "index.mapping.total_fields.limit" : 5000 }}' > create-${INDEX_NAME}.json cat > data.json <<EOF { "source": { "remote": { "host": "${ES_URL}" ${AUTH} }, "index": "${INDEX_NAME}", "size": 100 }, "dest": { "index": "${INDEX_NAME}" } } EOF echo "Migrate data from ${ES_URL} to ${ES_URL} on index ${INDEX_NAME}" curl "$ES_URL_NEW/_reindex?pretty&wait_for_completion=false" -H 'Content-Type: application/json' -d"@data.json" > reindex-${INDEX_NAME}.json done curl "$ES_URL_NEW/_tasks?pretty"
Troubleshooting
-
Check that you are using correct version of Elasticsearch and Kibana (6.x/7.x)
-
Test the configure settings on Manage Jenkins/Configure Elasticsearch Reporter
-
Create loggers to
com.cloudbees.esrpackage on managed controller/operations center
Elasticsearch in red/yellow/not available status
If you see one of the following messages in logs or in the UI, you have to check that your Elasticsearch is up and running and you have connectivity between operations center and Elasticsearch.
Mar 22, 2018 1:27:25 PM com.cloudbees.opscenter.analytics.Feeder asHttpResponse SEVERE: Error reporting items to elasticsearch enable FINEST logger for details : com.cloudbees.opscenter.analytics.NoElasticsearchException: Elasticsearch is not configured or is unavailable.


You can test you connection on Manage Jenkins/Configure Elasticsearch Reporter by clicking on the Test Connection button.
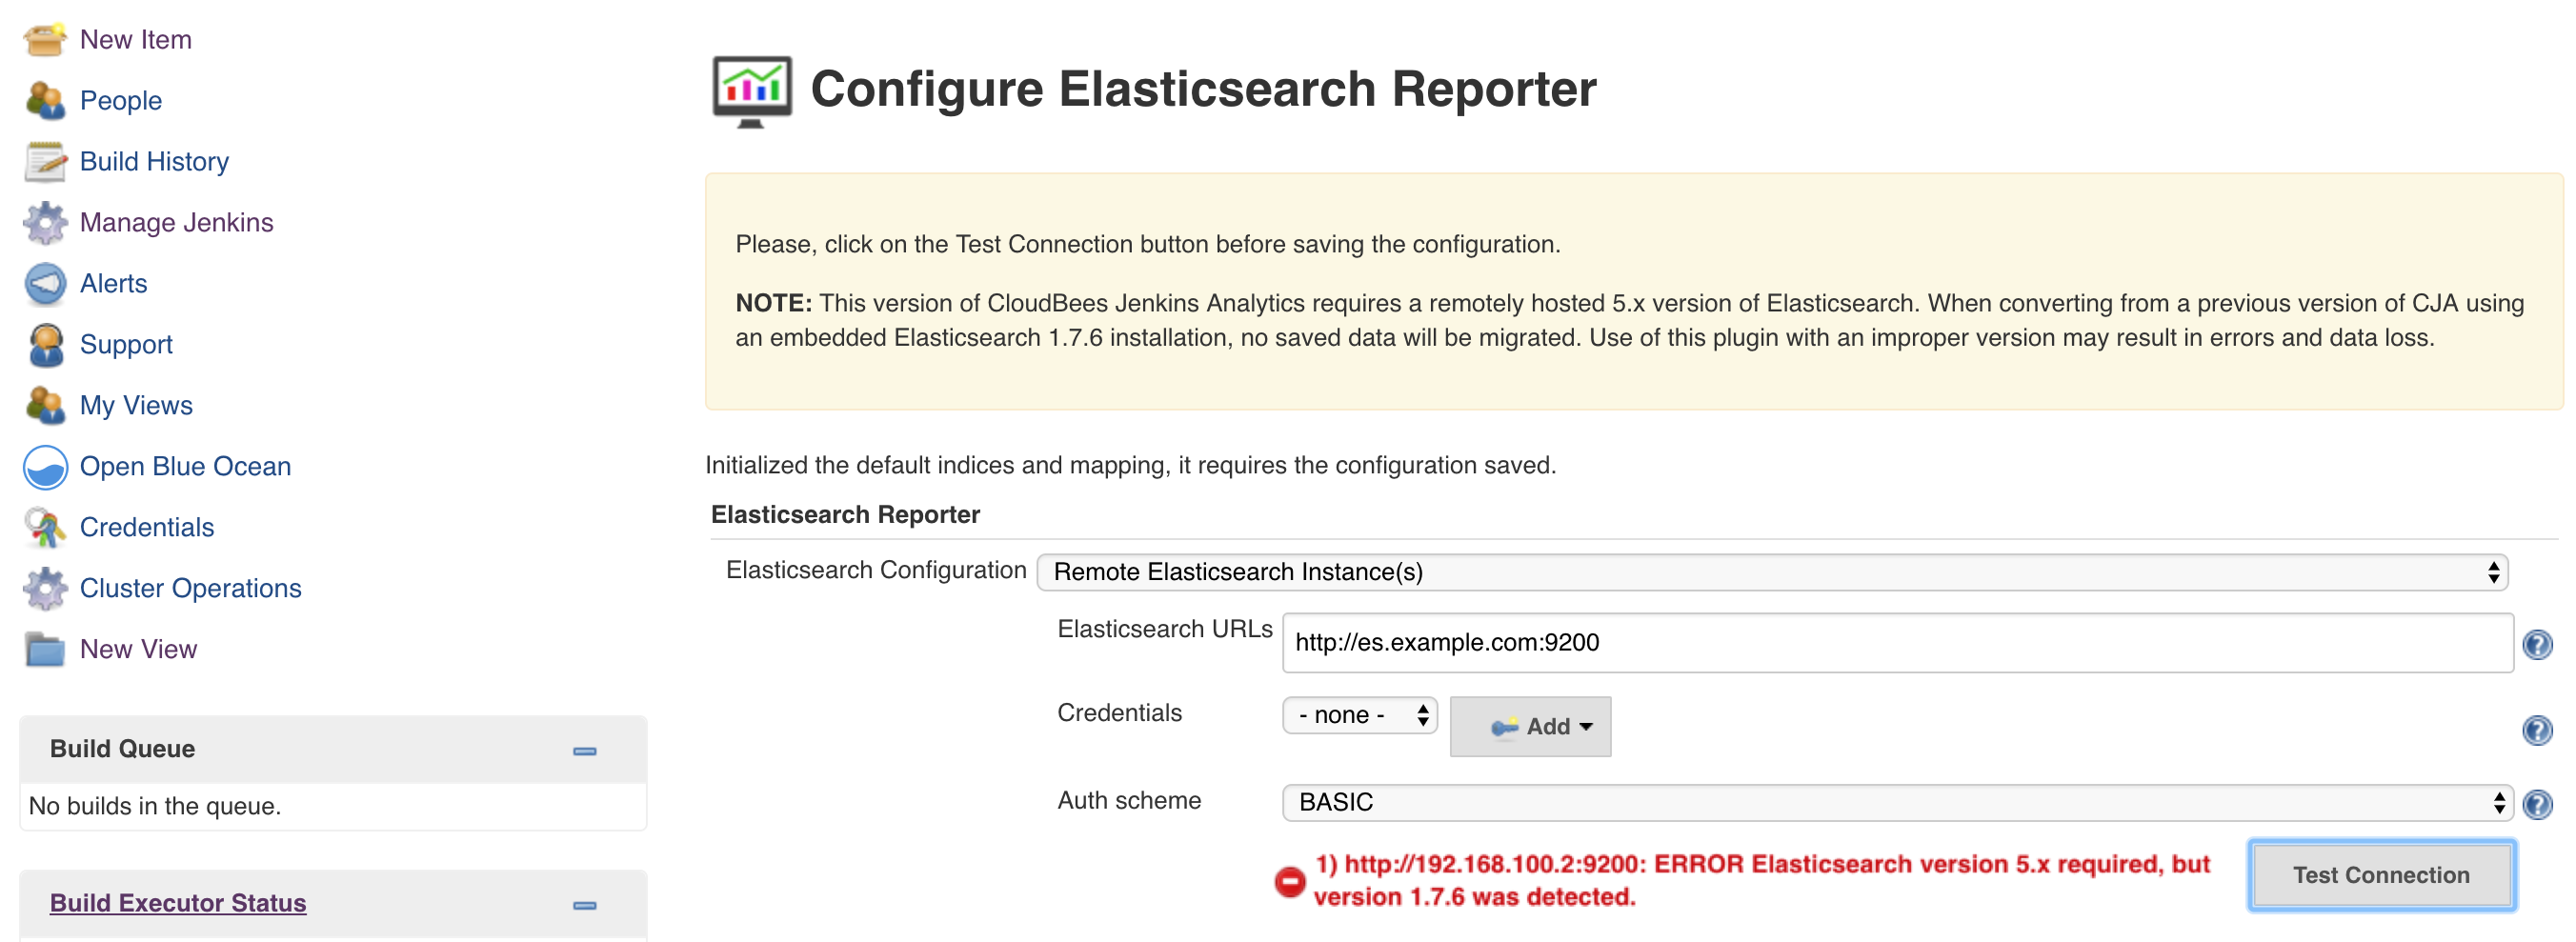
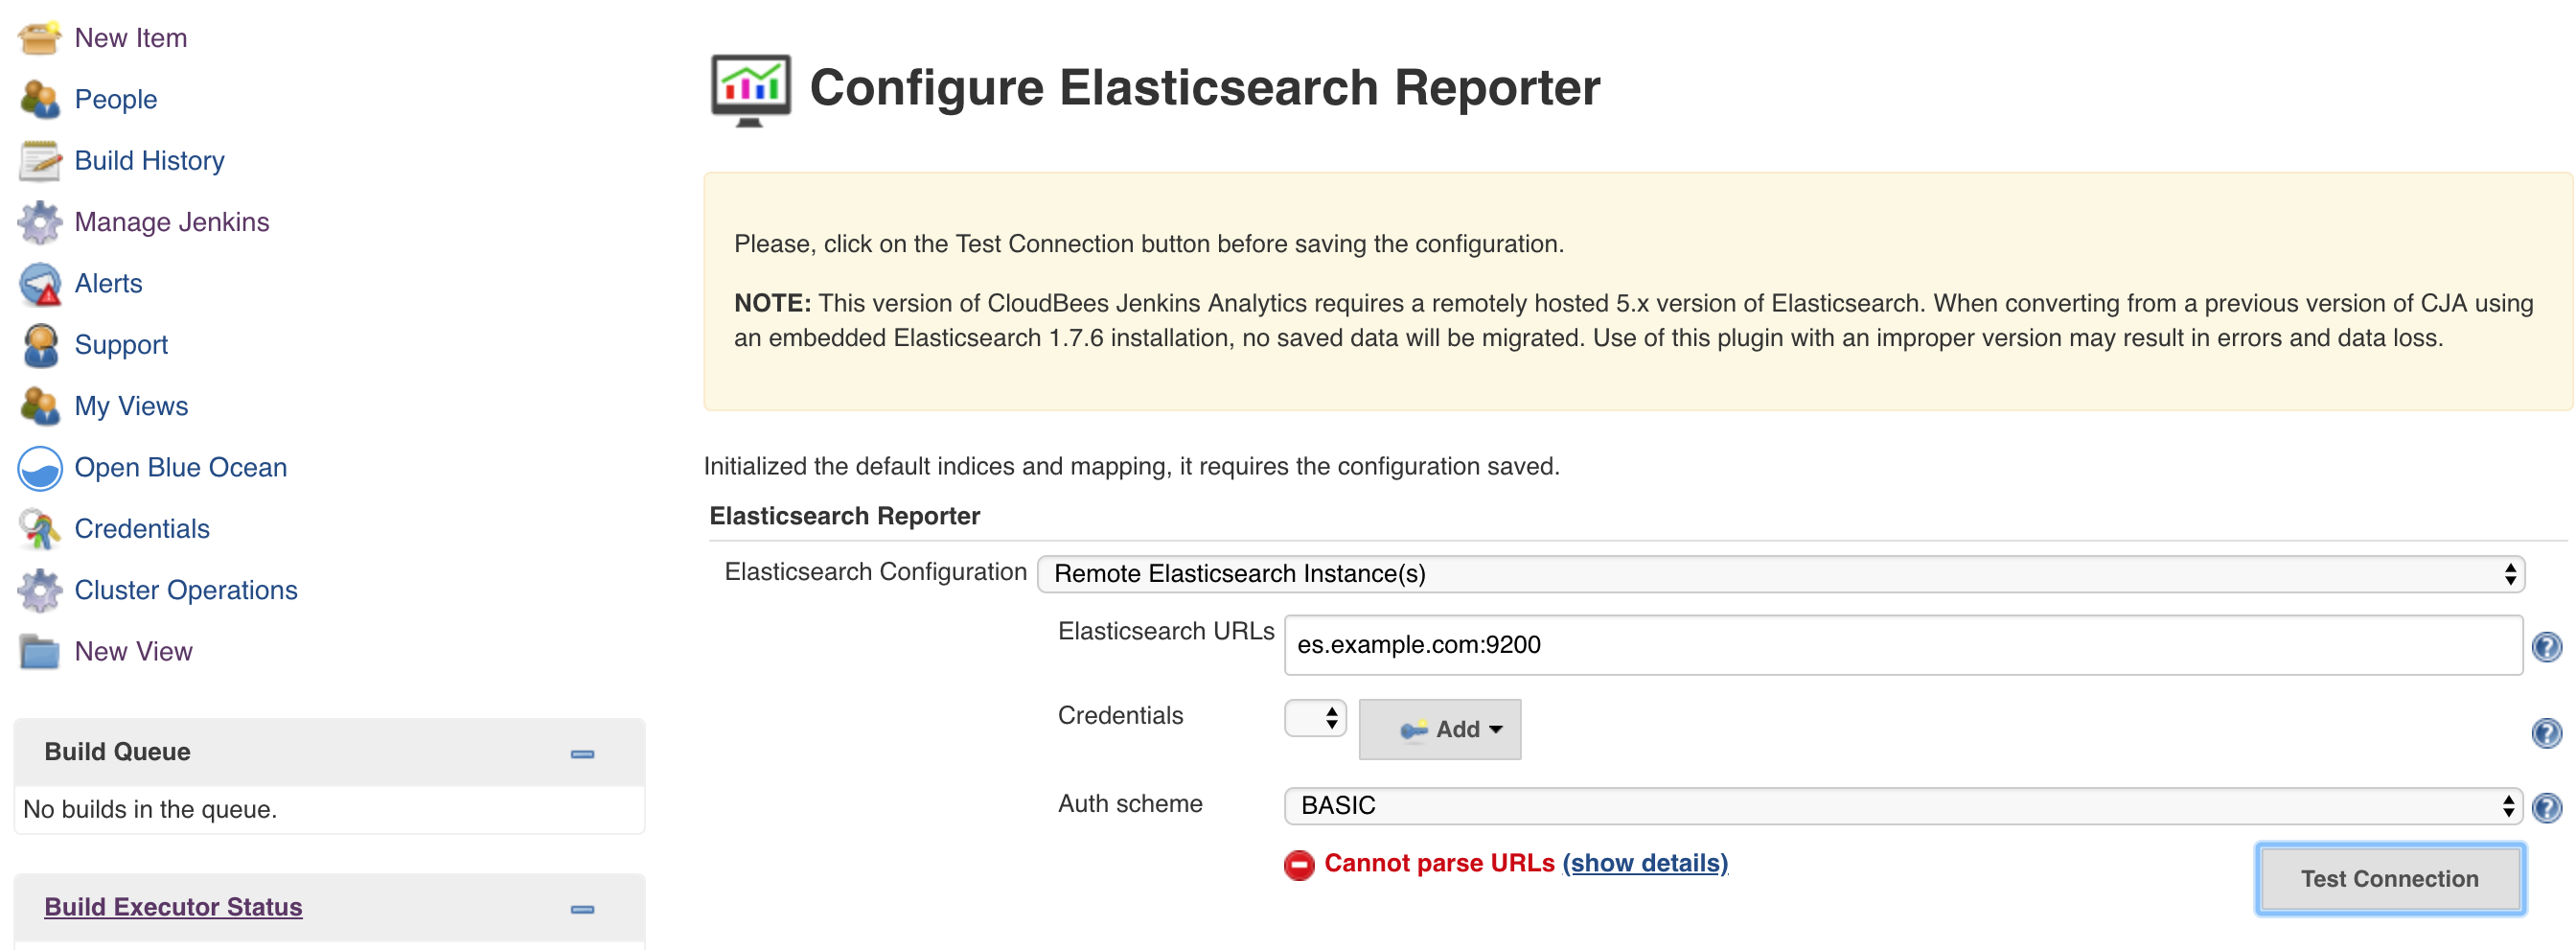
Once Elasticsearch is available, you have to dismiss the Monitors.
CloudBees Jenkins Analytics and Elasticsearch Reporter installed at the same time
CloudBees Jenkins Analytics and Elasticsearch Reporter cannot work in the same instance of CloudBees CI. If you want to use Elasticsearch Reporter, you must uninstall CloudBees Jenkins Analytics. When CloudBees Jenkins Analytics and Elasticsearch Reporter are installed in the same instance, Elasticsearch Reporter is not loaded and the following Administrative Monitor is activated.

|
CloudBees Jenkins Analytics and Elasticsearch Reporter are incompatibles. |
Amazon Elasticsearch Services
The authentication HTTP method used by Amazon Elasticsearch Services is not supported, you have to restrict the access to a VPC/IP/network.
1) https://search-es5-xxxxxxxxxxxxxx.us-east-1.es.amazonaws.com: ERROR Execution error. java.io.IOException: GET to failed: {"message":"Authorization header requires 'Credential' parameter. Authorization header requires 'Signature' parameter. Authorization header requires 'SignedHeaders' parameter. Authorization header requires existence of either a 'X-Amz-Date' or a 'Date' header. Authorization=Basic XXXXXXXXXXXXXXXXXXXXXXXXXXXXXXXXXXXX=="}
Reindexing for Elasticsearch Reporter
When you initially configure Elasticsearch Reporter, you may have historical builds which you would like to report on. The Reindex for Elasticsearch Reporter Cluster Operation scans all builds on connected Jenkins' and (re)submits them for Elasticsearch Reporter.
-
Create a new Cluster Operations job in operations center.
-
In the Operations section add a Controller operation.
-
In the Target Controllers / Source section, choose From Operations Center Root
-
In the Steps section, add a Reindex for Elasticsearch Reporter step.
-
Click Save.
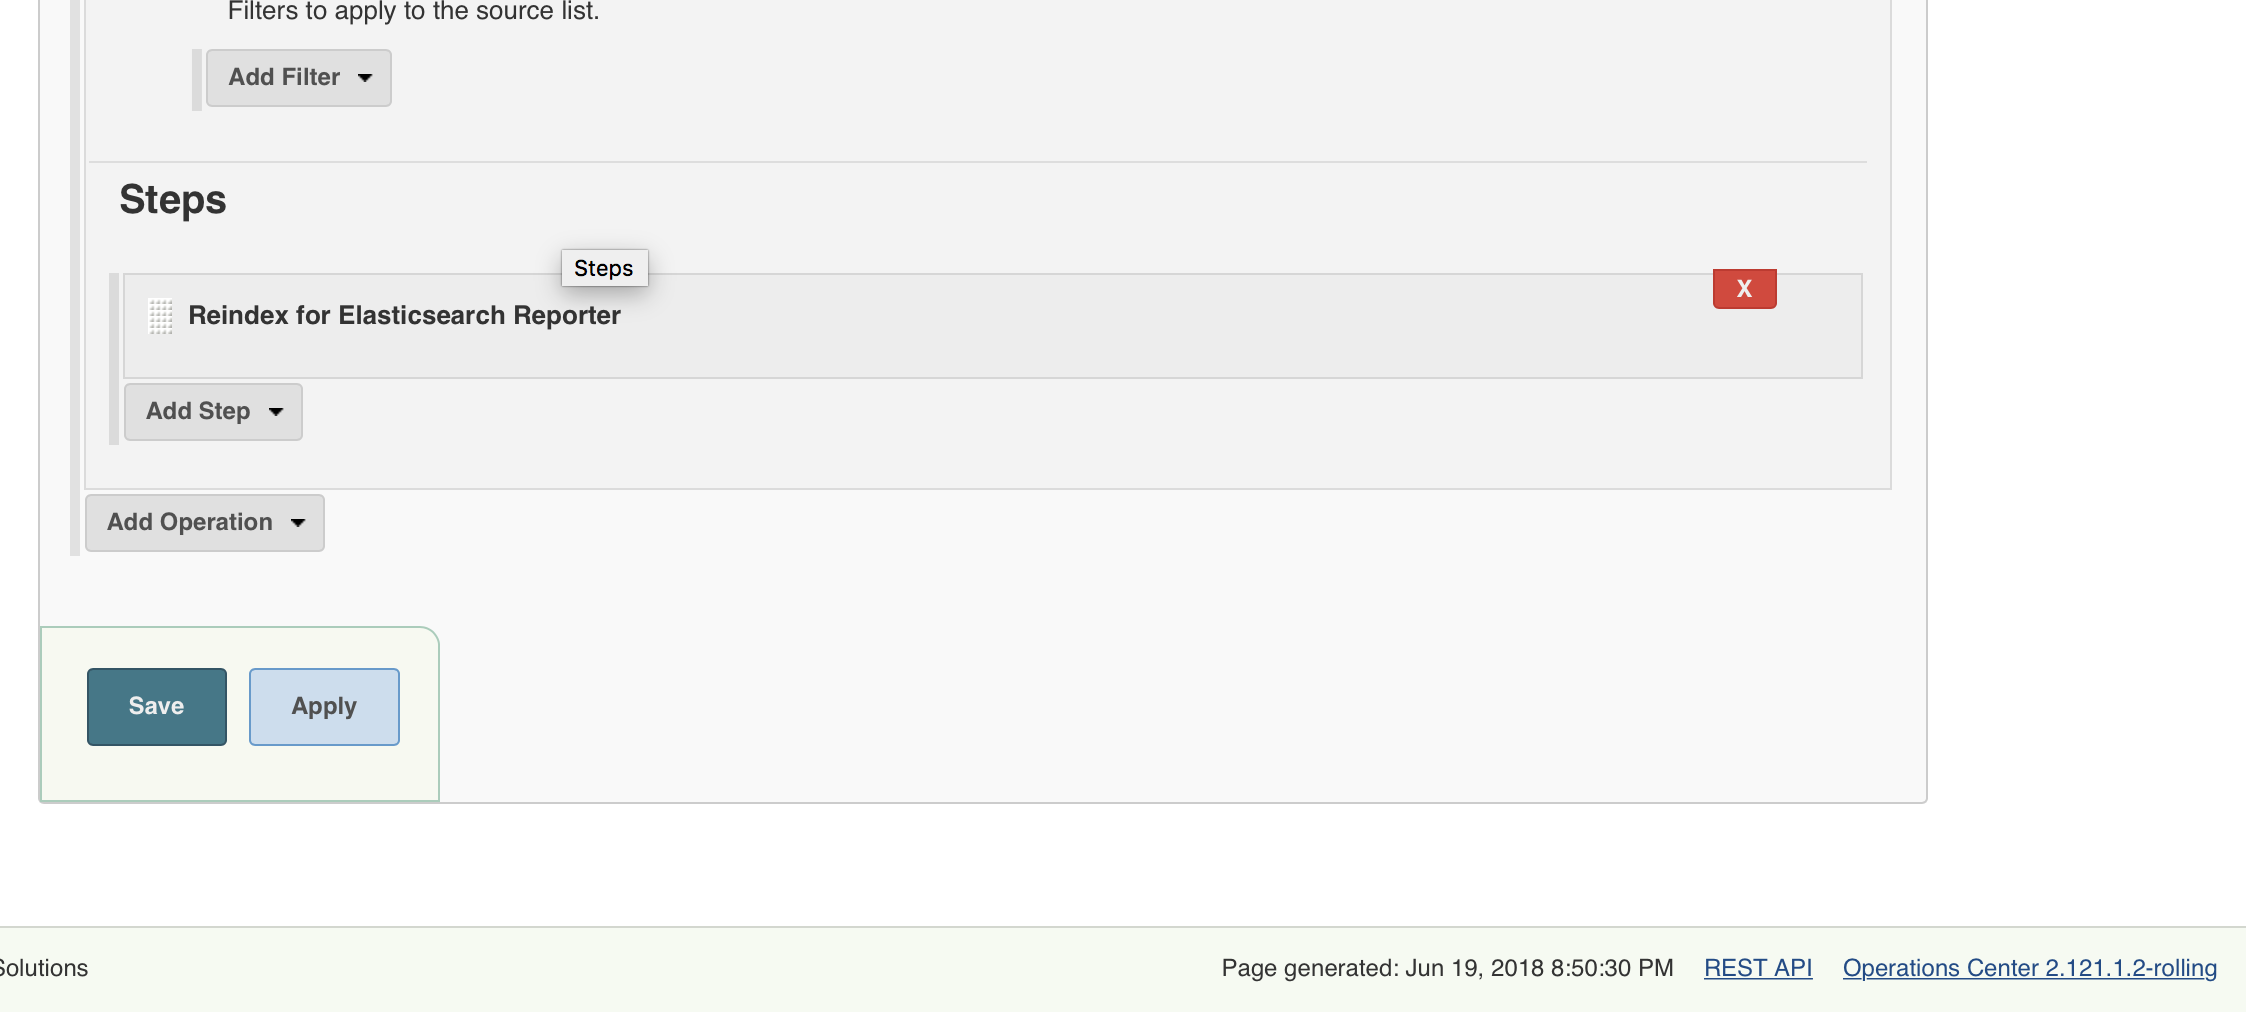
|
Reindexing involves scanning all builds in a Jenkins instance, which can be an expensive operation. Consider scheduling the Reindex job for off-hours so as not to disrupt other usage of Jenkins. |
Built-in alerts
The Elasticsearch Reporter plugins automatically monitor infrastructure elements and all of the controllers that it manages. These alerts can be helpful in troubleshooting.
The infrastructure element monitoring includes operations center and managed controllers. For the various infrastructure nodes, the following metrics are automatically monitored.
-
Available disk space
-
CPU utilization for the most recent 5 minutes
-
RAM utilization for the most recent 5 minutes
If any of the data points for these metrics exceed 90% or more, a threshold which is currently immutable, an alert is emitted, for example:
Health checks failing: [worker-14: Disk util at 95%, worker-9: Worker down]
The following table show the possible error messages and corresponding descriptions.
| Messages | Descriptions |
|---|---|
Disk util at <number>% |
Disk utilization reaches 90% or higher |
RAM util at <number>% |
RAM utilization reaches 90% or higher for five or more minutes |
CPU util at <number>% |
Total CPU utilization reaches 90% or higher for five or more minutes. The percent utilization is normalized to 100% across all CPU’s on the node. |
