In this module, you will learn how to debug a failed deployment. This tutorial presents the following information:
-
Using the Job Details page and the job step log pages to identify problems.
-
Navigating to and editing the application process steps to fix issues.
The steps below describe how to debug a failed deployment as demonstrated in the video.
What if things go sideways when you deploy?
-
In the Home page, click Applications.
-
Click jpetstore-app to go to the Applications Visual Editor.
-
Click the Run process button (
 ) in the upper left corner.
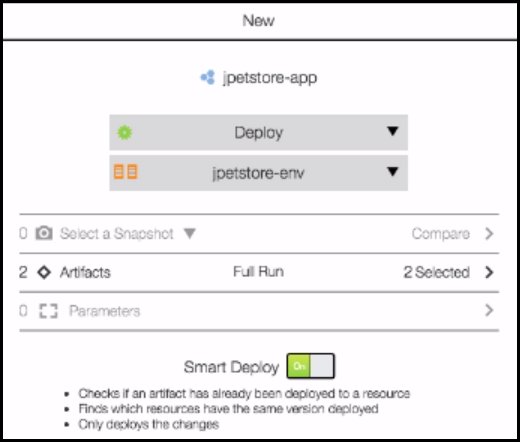
The dialog box to select the deployment settings opens. -
Select Deploy in the Select Process field.
-
Click the down arrow in the Select Environment field, select the Environments tab, and select jpetstore-env .
Notice that Smart Deploy is On , which means that CloudBees CD (CloudBees Flow) deploys only the artifacts that have been changed or are a different version than the deployed artifacts.
-
Click OK to start the deployment.
-
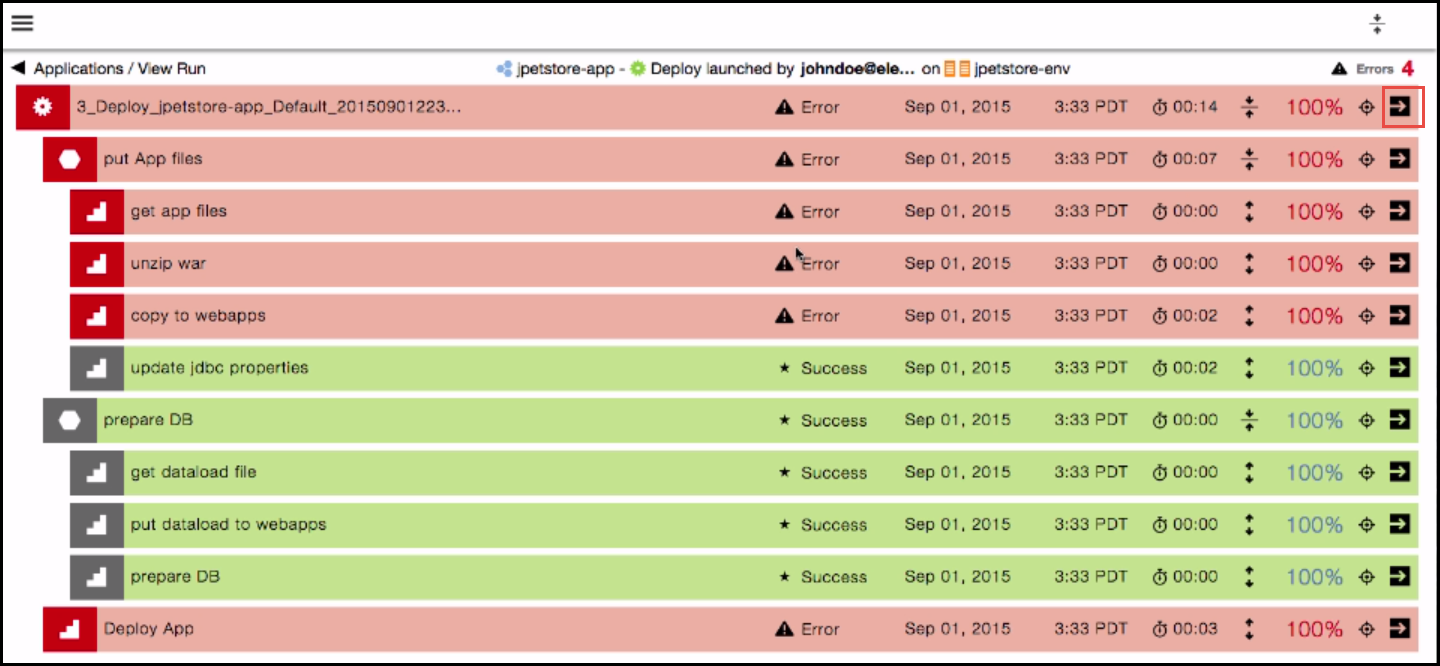
Watch the progress of the deployment in the "Applications / View Run" page.

The deployment fails.
-
In the top row, click the View Details button (
 ) to view the job details and find what caused the deployment to fail.
CloudBees CD (CloudBees Flow) tracks all commands and outputs, making it east to quickly identify the root cause of the failure.
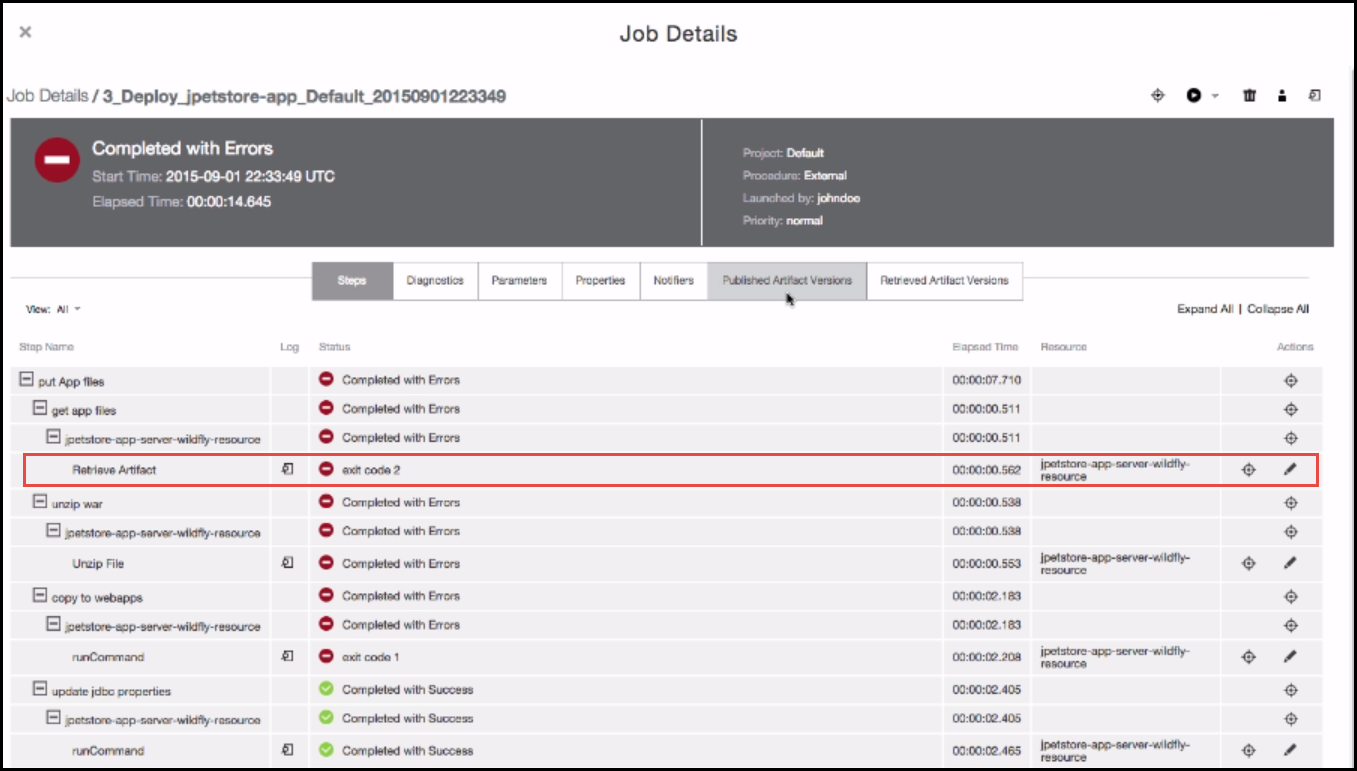
The Job Details page opens. Notice that the Retrieve Artifact job step failed.
-
In the Retrieve Artifact row, click the Log button to view the log file.
There is a spelling mistake in the path to the artifact (see the highlighted text).

We need to fix it in the component definition in the process model.
-
Return to the Applications List and click jpetstore-app.
-
In the Applications Visual Editor, go to the App Server tier, and click on Menu button (
 ) in the jpetstore-mysql.war component.
 -
Click Details .
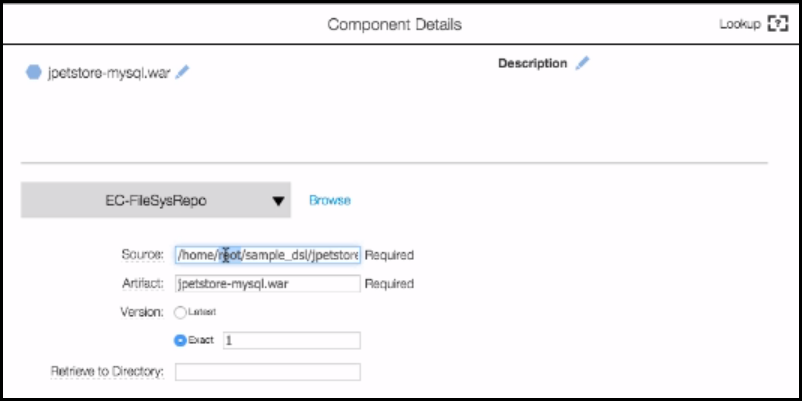
The Component Details dialog box appears.The path to the artifact is incorrect.
-
Change "root" to "ecloud" in the Source field, and click OK .
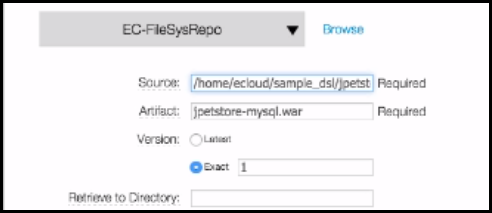
-
To rerun the failed deployment, go to the Applications List.
-
Click the Run Process button (
 ) in the jpetstore-app row, and select Last Run .
The application is deployed with the settings that you used in the previous run.
-
View the progress of the deployment.
The deployment fails again.
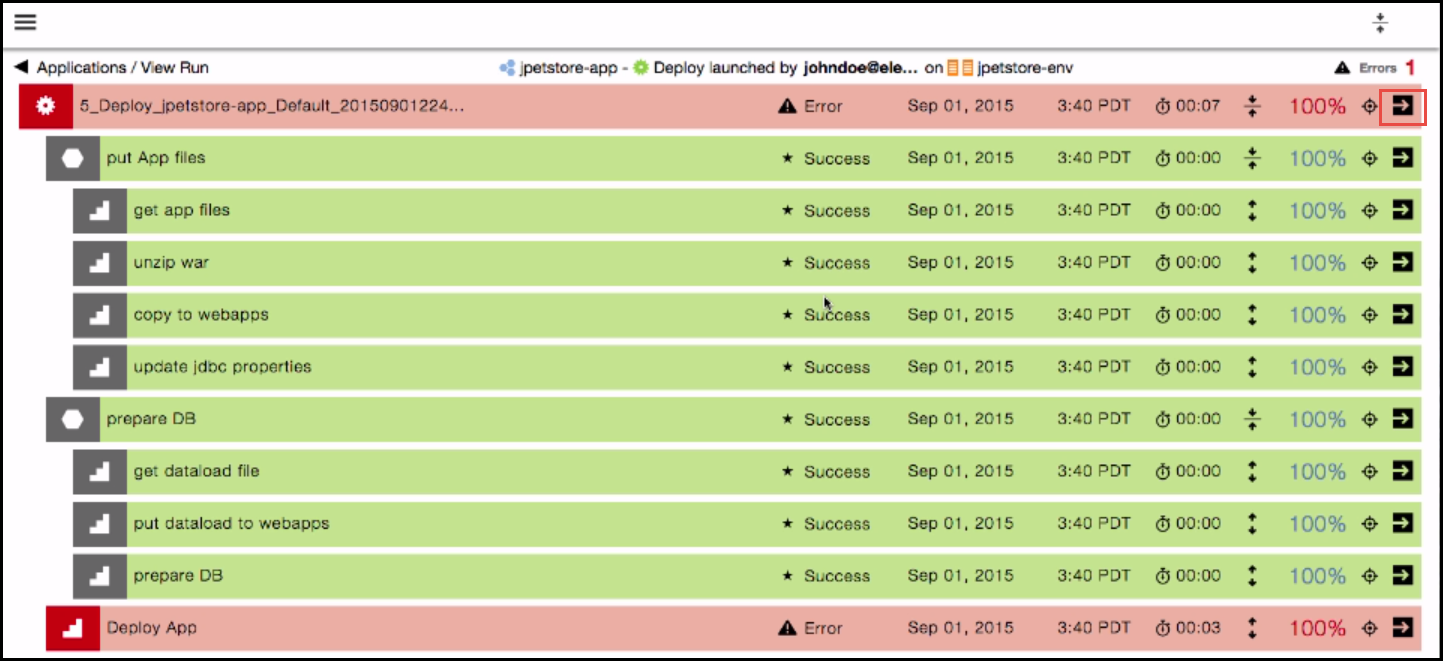
-
In the top row, click the View Details button (
 ) to view the job details and find the what caused the deployment to fail during the latest run.
The deployment failed due to a property reference error, which describes what part of the expansion failed.
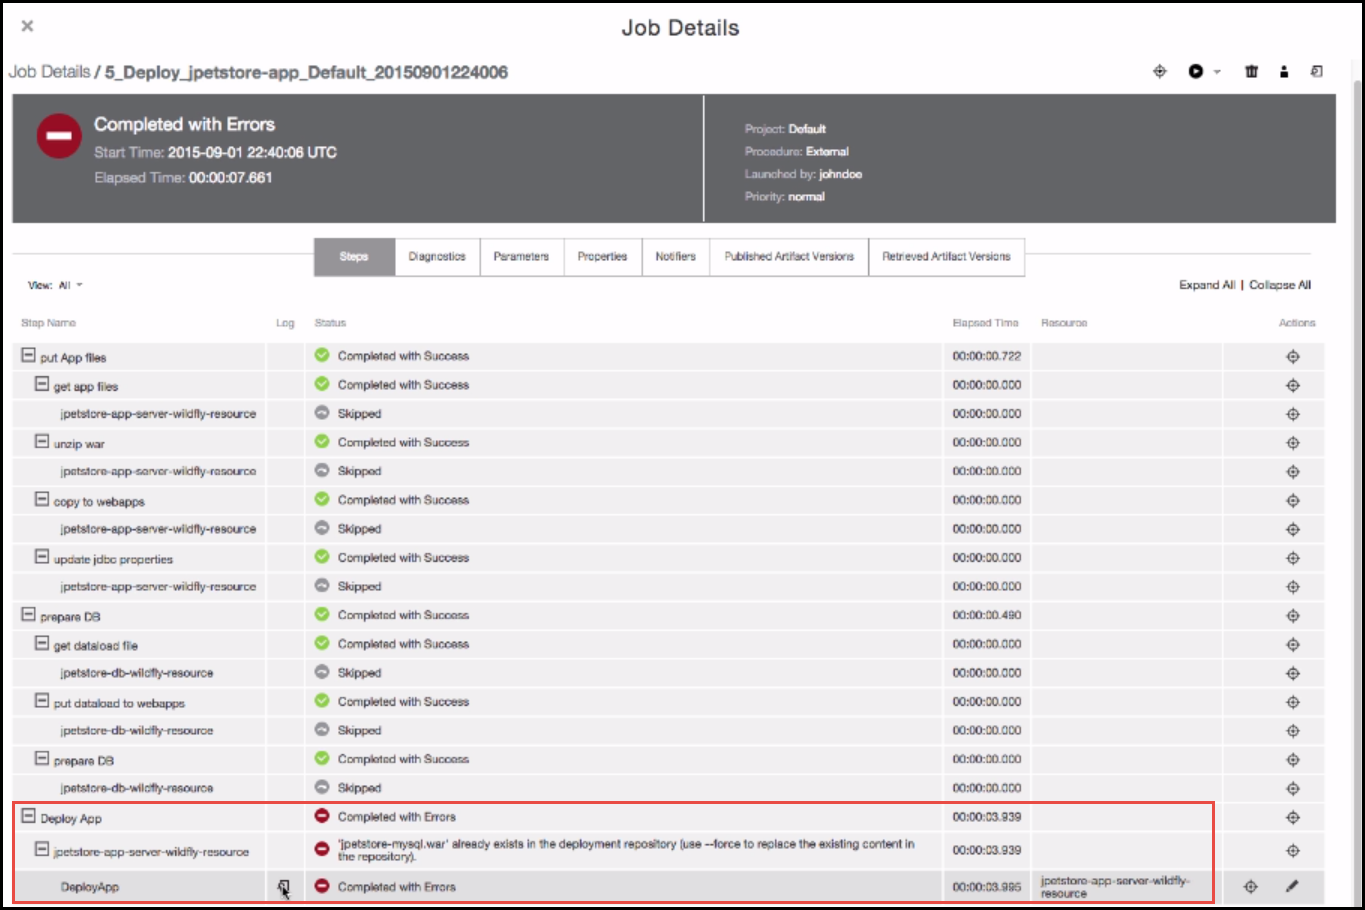
-
In the DeployApp step row, click the Log button to view the log file.
The part of the property reference that failed is highlighted.

We need to fix this error in the process model.
-
Go to the Applications List, click the down arrow next to the number of application process for jpetstore-app, and select Deploy.
-
In the Applications Visual Editor for jpetstore-app, go to the third step (Deploy App) in the Deploy process, click the Edit button (
 ), and select Details.
 -
In the Application Process Step dialog box, go to the "JBoss - DeployApp" page.
-
Change "//jpetstore-mysql.war" to "/jpetstore-mysql.war" in the Path to the application to deploy field, and click OK.
-
To deploy the application again, go to the Applications List, click the Run Process button (
 ) in the jpetstore-app row, and select Last Run .
The application is deployed with the settings that you used in the previous run. -
View the deployment results.
SUCCESS!!!
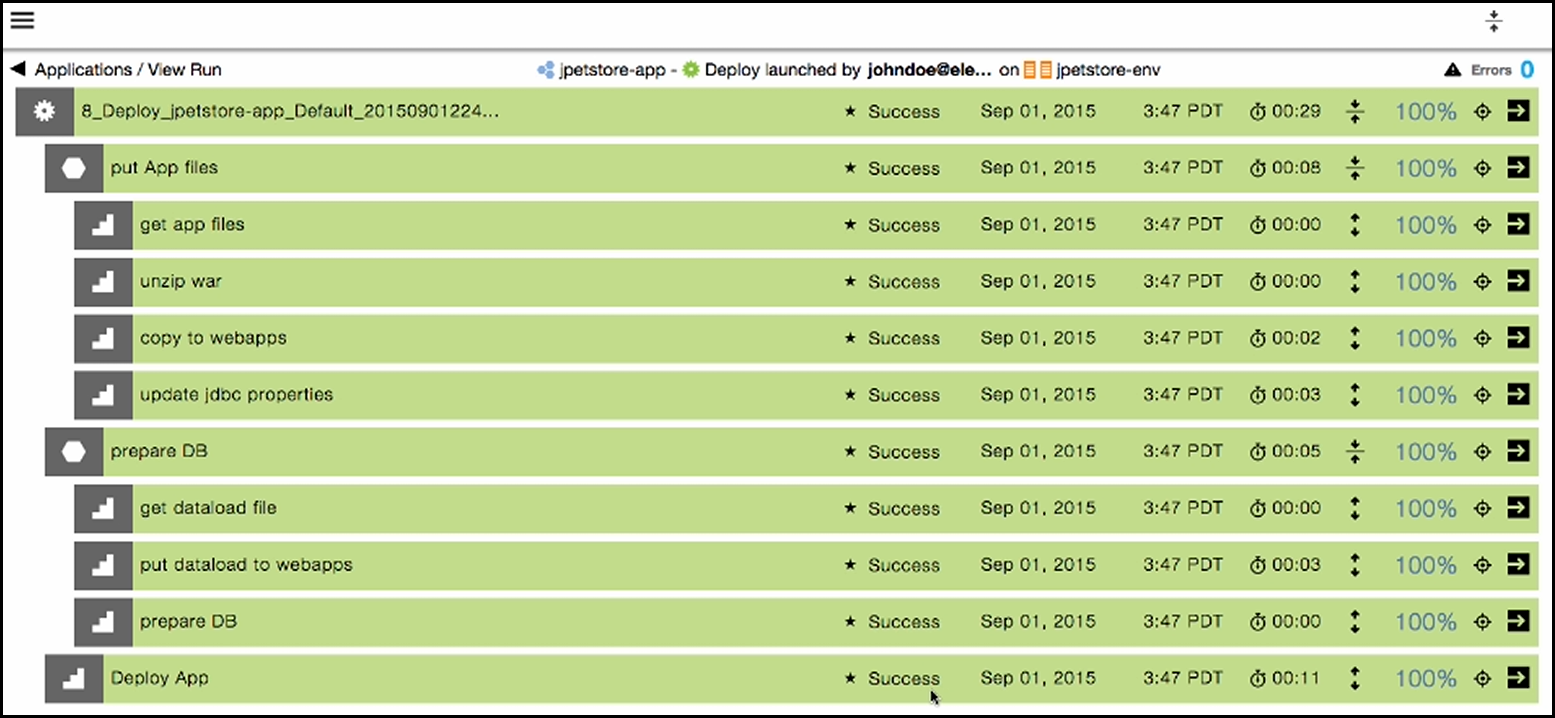
What’s next
Create and run more application deployments.
To learn more, go to learn.electric-cloud.com.