This page displays actions that can be performed on a build entry as well as extensive information and visualizations about a build.
Actions
-
 View Messages: Opens the Messages page for viewing all system log entries for the build.
 -
 Download Build Log: Downloads the annotation file for a completed build. For details about the annotation file, see Annotation.
 -
 Delete Build: Deletes a non-running build.
 -
 Stop Build: Stops a running build.
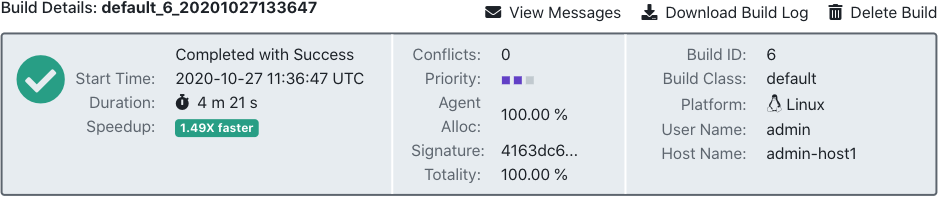
Build Status Bar
The Build Status Bar shows the build name and general information about the build.
| Field | Description |
|---|---|
Status |
Build’s result or status:
|
Start Time |
The date and time the build was started. |
Duration |
The build duration (the elapsed time between the start and end time). |
Speedup |
The speedup of the build. Speedup is a measure of how much faster the build was than if it were run without acceleration. |
Conflicts |
The number of conflicts in the build. |
Priority |
The priority of the build. |
Progress |
The current progress of the build. |
Agent Alloc |
The agent allocation status of the build. 100% means the build had all requested agents 100% of the time, while a lower percentage means that there were periods where agents that could have been used by this build were allocated to other builds. |
Signature |
The build signature of the build. Build signatures are hashes generated from the build’s rule jobs, so that a build with the same named targets and dependencies in the same serial order will have the same signature. It is intended to be used to determine the "uniqueness" of a build. If files have been added or removed from a build, the build signature will change, but if those files have merely changed, then the build signature will remain the same. |
Totality |
The totality of the build. Totality is a measure of how much of the build was actually rebuilt. A complete rebuild should be near 100%, whereas a no-touch build should be near 0%, with incremental builds being somewhere in between. |
Build ID |
The Build ID number assigned by the Cluster Manager. |
Build Class |
The build class to which the build belongs. |
Platform |
The platform on which the build ran. |
User Name |
The name of the user under which the build ran. |
Host Name |
The name of the host on which the build ran. |
Details pane
This pane is shown while a build is in progress and displays detailed information about the build and the machine on which the build was run. If a breakpoint is active and was triggered, this information appears here also. For details about using ecbreakpoint, see Using Breakpoints.
Build speedup
-
Workload: The sum of agent usage over all agents (in seconds). This value also appears in the annotation file.
-
Wait Time: The time that the build spent waiting for agents to become available.
-
License Wait Time: The time that the build spent waiting for a license to become available.
-
Jobcache Workload Saved Time: The time that the build saved by using jobcache.
Build info
-
Job Count: The number of jobs run during the build.
-
Priority: The priority at which the build was run. This can be modified, if desired.
-
Min Agents: The minimum number of agents used during the build.
-
Max Agents: The maximum number of agents that can be used by the build.
-
Effective Agent Alloc: The percentage of time the build was able to get all the agents it requested that were available for it to use. 100% means the build had all requested agents 100% of the time, while a lower percentage means that there were periods where agents that could have been used by this build were allocated to other builds.
-
IP set: If eMake was directed to use an alternate set of IP addresses to access agent hosts, this field indicates which set was used. For details, see Configuring eMake and Agents for Multiple Interface Communications.
Host info
-
IP Address: The IP address of the machine on which the build was started.
-
OS User Name: The actual name of the user that started the build. This will be the same as the User Name (in the Build Status Bar above) unless
--emake-impersonate-userwas specified. -
User Label: The label portion of the build name.
-
History Exists: Whether or not a history file existed for the build.
Log
-
Command Line: The command line used to invoke eMake.
-
Resource Request: The resource on which the build ran.
-
CWD: The directory from which eMake ran.
-
EMake Version: eMake version information.
-
Build Log Directory: The location of the build log.
-
History File: The location of the history file that was used by the build.
Build details tabs
After a build is complete, more extensive information and visualizations are available.
Settings tab
This tab shows the build properties and configuration for this build. These options might have been specified on the eMake command line, or they might be inherited from the build class.
Diagnostics tab
This tab shows diagnostic messages (warnings and errors) emitted by the build. If there are more than 20 messages, only the first 20 are shown.
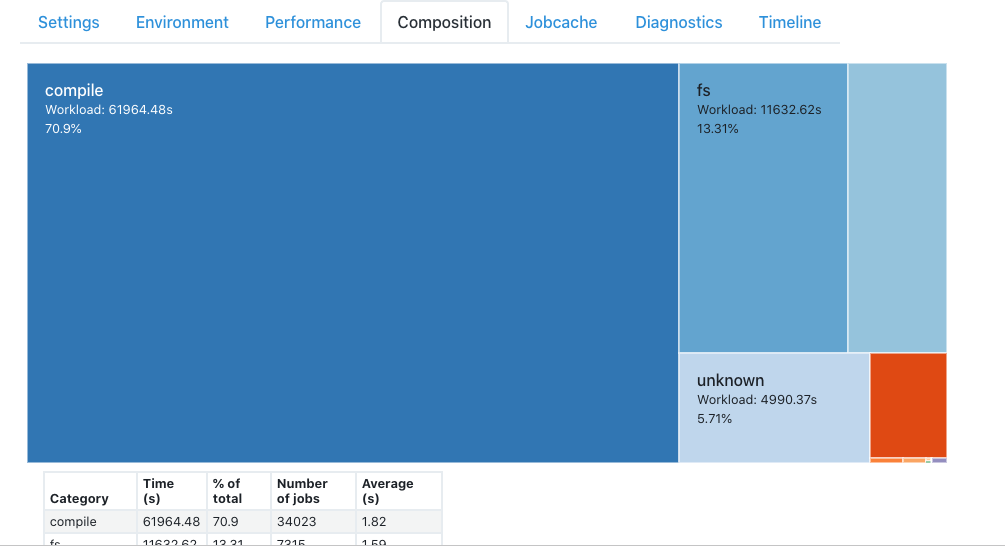
Composition tab
This tab shows a breakdown of the time taken by job type for this build. First is a tree visualization of this data, followed by a table, showing the category name, the time (in seconds), the time as a percentage of the total, the number of jobs, and the average job time (in seconds), all sorted from longest duration to shortest. You can click one of the job types to highlight it in either area.
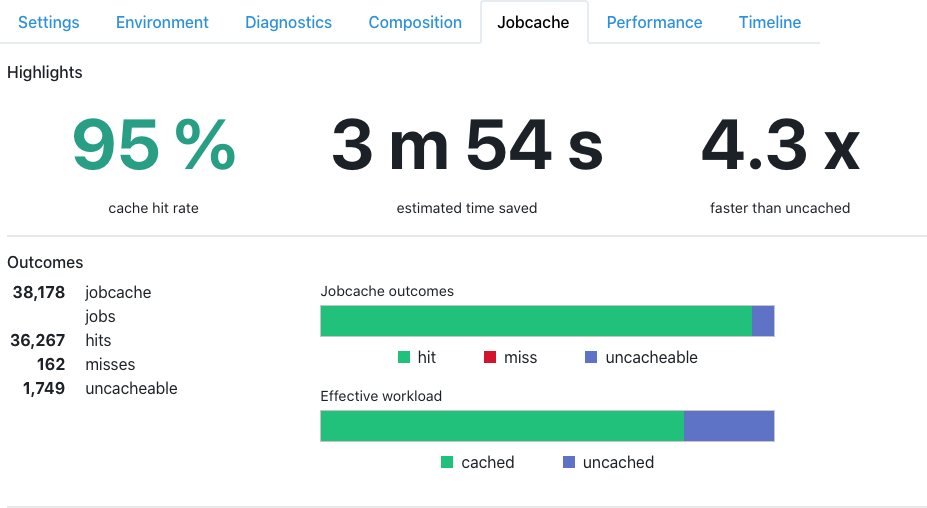
Jobcache tab
This tab shows information about jobcache usage for this build.
Highlights
This section displays the cache hit rate, the estimated time saved, and the speedup over an uncached build.
Outcomes
This section shows the total number of jobcache jobs in addition to the number of jobcache hits, misses, and uncacheable jobs. These are displayed on the left in tabular form, and on the top right in a visualization. On the bottom right is a breakdown of the effective workload broken down by cached and uncached jobs.
Types
This section shows a table of jobcache results by job type, indicating the job type, the numbers of jobs, the number of jobcache hits, the number of jobcache misses, the number of new jobcache slots, the number of roots changed, the number of jobs that were uncacheable, and finally the resulting speedup.
Performance tab
This tab shows information about the performance of this build.
-
Overview: Metrics characterizing aspects of build performance. For definitions of these metrics, see Annotation - Metrics in Annotation Files.
-
Agent utilization: A graph showing the number of agents in use over the duration of the build.
-
Critical path: The sequence of jobs that determine the minimum duration of the build. The longest jobs within the critical path are highlighted in order to guide optimization efforts.
-
Bandwidth: Statistics on bandwidth usage during the build.
-
Compression: Details about the performance of the compressor used to reduce network traffic during the build.
-
Terminator: Information about how files are moved from temporary storage to final destination after emake validates the results. For best performance the majority of build outputs should be committed by rename, rather than by copying.
-
Versioned file system: Details the composition of the data collected by emake during the build in order to check for conflicts.
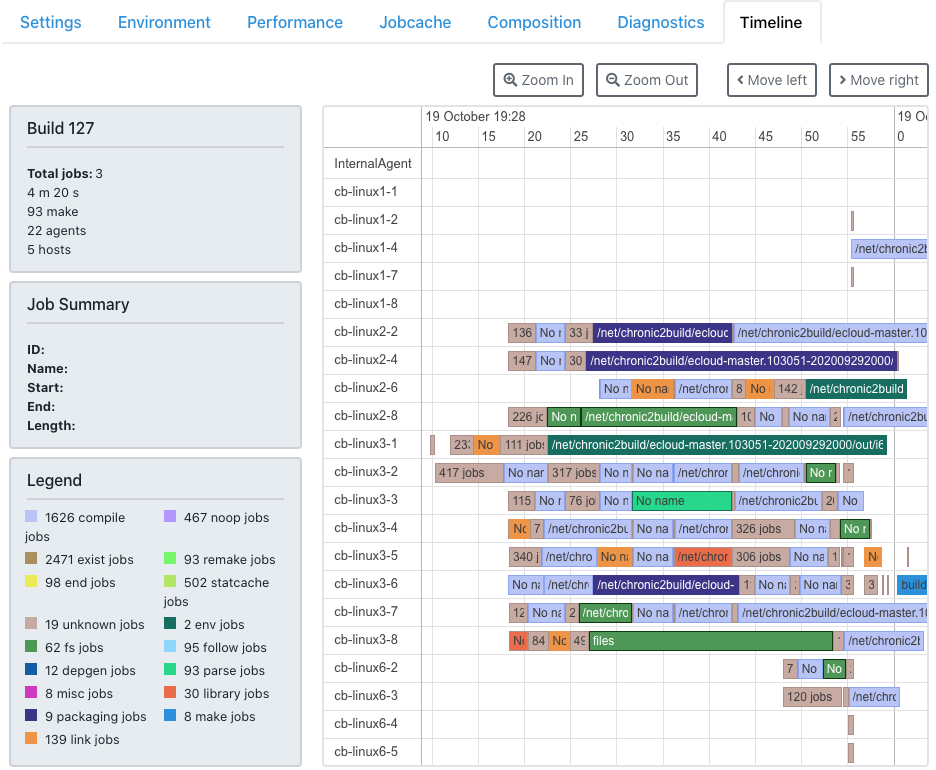
Timeline tab
This tab shows a visualization of the timeline of the job. In the main display on the right, the horizontal axis on the display represents time (labelled on the top) and the rows represent which agent ran the build jobs. Each bar represents an individual job (colored by type), showing its name in the label and its duration by the length of its bar. A set of short jobs may be collapsed into a single bar colored in light brown with the label "n jobs." You can zoom in and out with the buttons above the display or by using the mousewheel, or scroll left and right with the buttons above the display or by clicking and dragging on the timeline. You can also click on a job (or set of jobs) to see more information.
To the left are three panes: The first shows a summary of the build, the second shows information about the selected job, and the last is a legend showing job types by color.
Recommendations tab
This tab provides recommendations for ways to improve build performance, based on analysis of the build. The report checks for several known performance anti-patterns, such as missing or incomplete history, jobcache misses, and more. Recommendations are prioritized according to the estimated impact on performance. Note that the information provided by this report is intended as a starting point for build optimization: it can identify several common problems, but there may be additional opportunities for optimization not revealed by this analysis.