The CloudBees Pipeline Explorer plugin offers a streamlined approach to troubleshoot pipelines and view logs. This plugin was developed with a focus on performance to improve your experience for log viewing, whether your log files are 5MB or 500MB.
The Pipeline Explorer can visualize the stages of your Pipelines in a tree view that lets you filter the logs by stages. The log viewport can be customized with user preferences for line numbers, displaying ANSI colors from the log text, word wrapping, and custom time formats for timestamps.
The Pipeline Explorer also provides a search feature, permitted through RBAC, so that users can search large files without leaving the Pipeline Explorer interface.
To view a video introduction of the CloudBees Pipeline Explorer, you can watch the following video.
Install the CloudBees Pipeline Explorer Plugin
-
To find the plugin, go to Manage Jenkins > Manage Plugins > Available Plugins and search for the CloudBees Pipeline Explorer.
-
Install the CloudBees Pipeline Explorer.
-
After the installation has completed, select
CloudBees Pipeline Explorerin the left navigation pane of the Pipeline builds to access the new functionality.
|
The CloudBees Pipeline Explorer only supports Pipeline builds that start after the plugin is installed and enabled. Beginning with CloudBees CI version 2.401.3.3 and higher, the plugin is automatically installed and enabled. |
Manage the CloudBees Pipeline Explorer
|
The CloudBees Pipeline Explorer has a light mode and a dark mode display option. To change the display modes, you can select them in the behavior preferences or the user preferences of your browser/OS. |
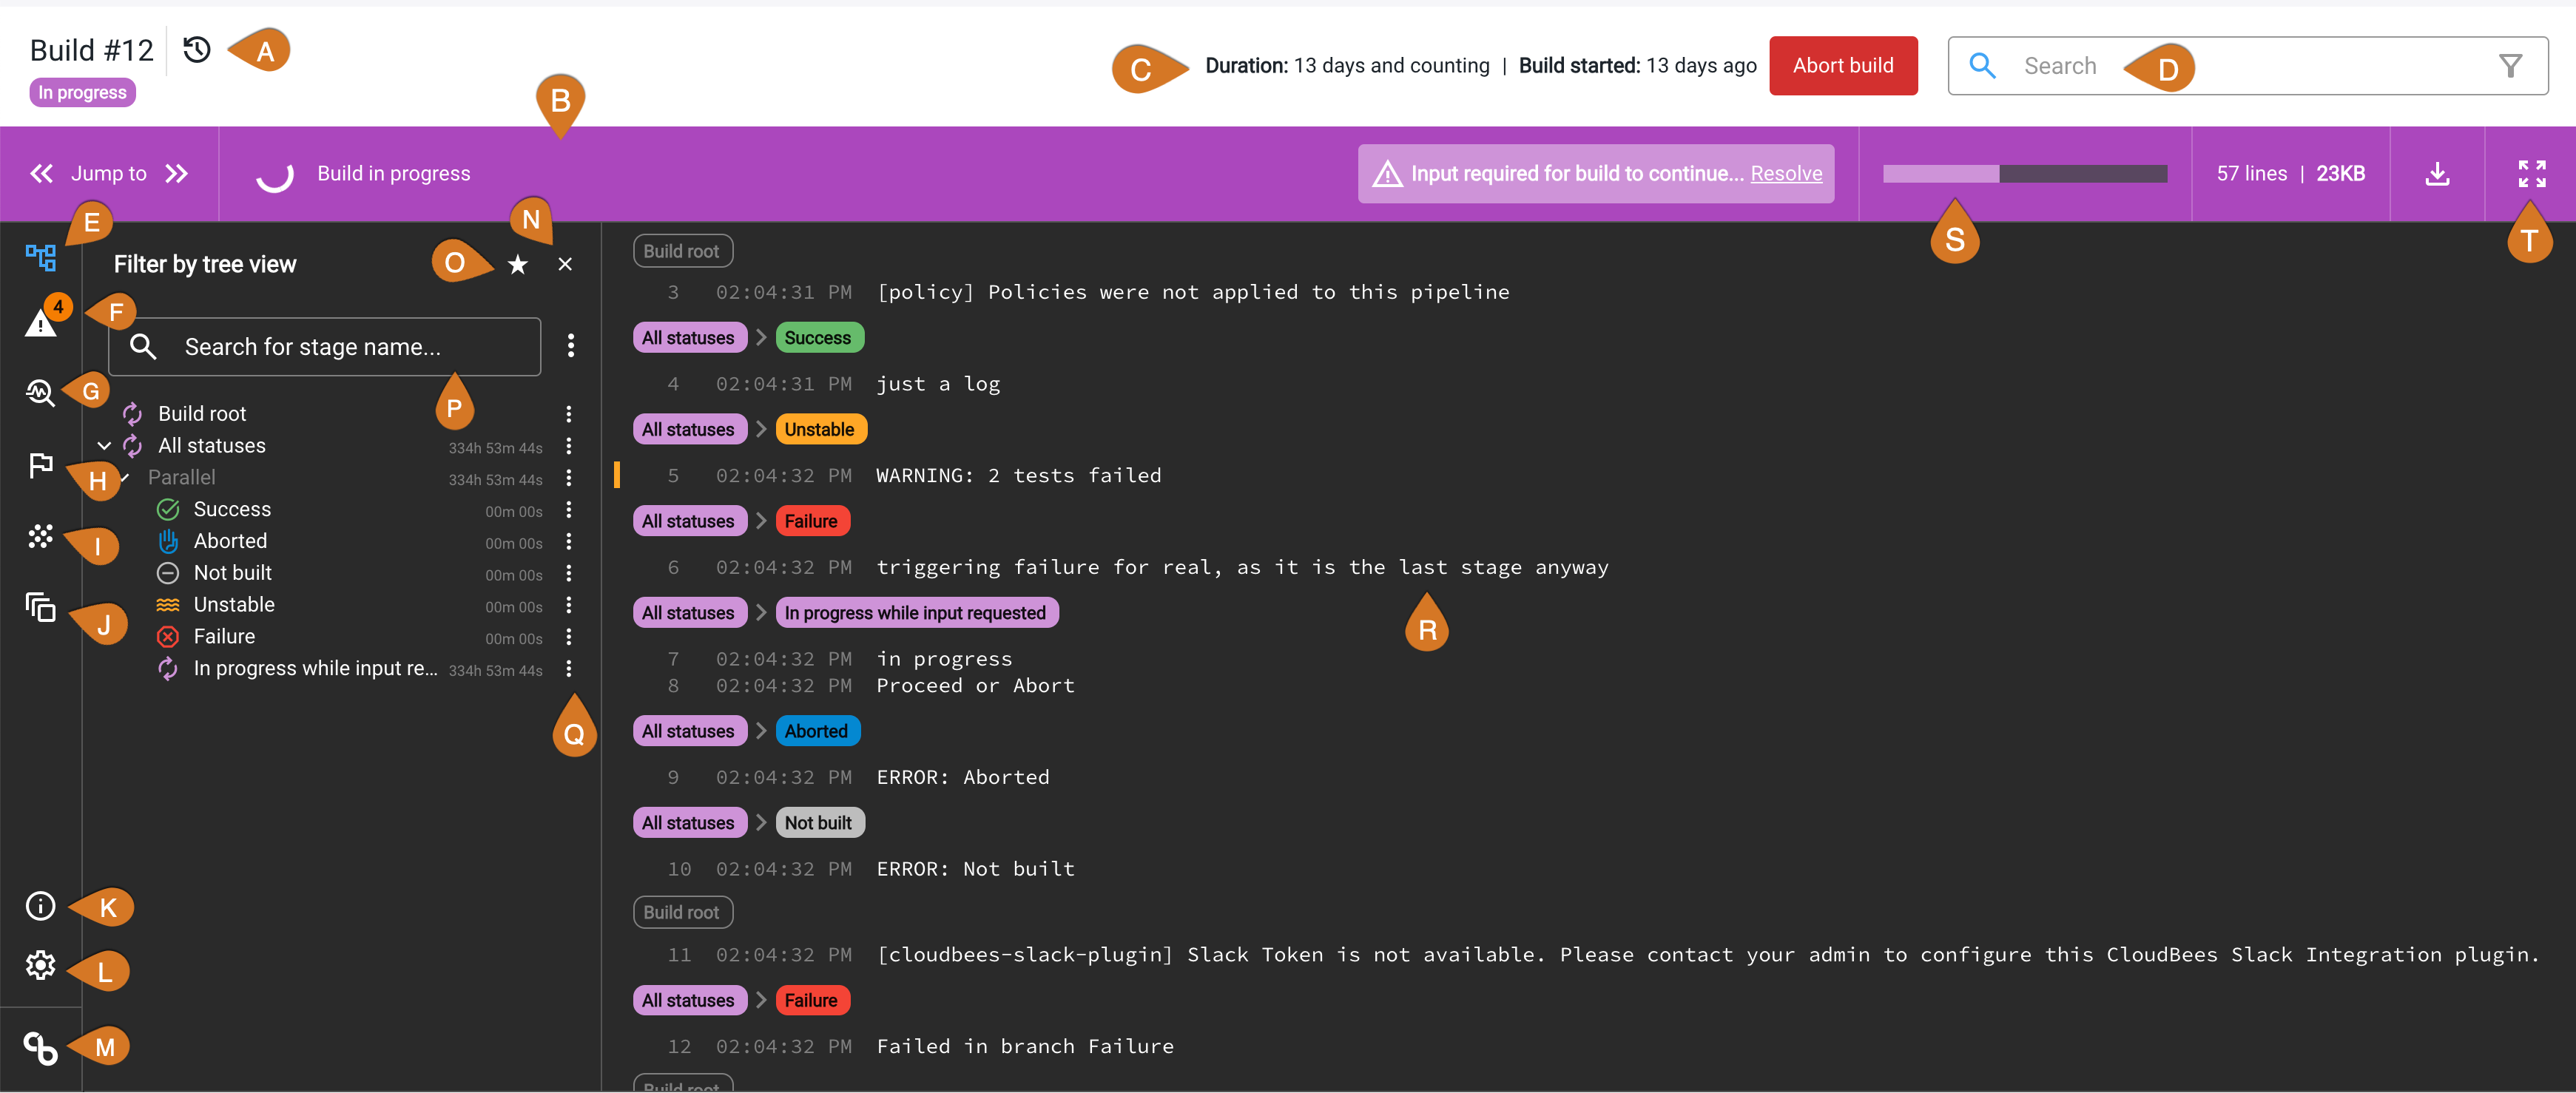
The following examples show the CloudBees Pipeline Explorer viewport. This displays the log information, the build information, and the preferences panel.
-
Page header that displays the build name, build status, and the build view icon (View previous build, View previous successful build, and View next build)
-
Toolbar that displays the following information:
-
Build status
-
The navigation buttons that can jump to the first or last lines of the log to navigate through the log and search output
-
Build input message
-
Progress bar that shows the estimated time (rounded) that remains in a build. When a build is in progress, you can also hover over the progress bar to display the estimated time (rounded) that remains.
-
The file size or filter size
-
The Download button that downloads the log
-
The expand icon (see M in Figure 1) that expands the log view to fullscreen mode
-
-
The build details line that displays the following information:
-
Duration of the build
-
Build start time
-
If the user has the required permissions, the following buttons may also be displayed:
-
A Rebuild button that rebuilds the completed builds
-
A Replay button that replays the completed builds
-
An Abort button that aborts the in-progress builds
-
-
-
Search bar (if the
Run/SearchLogRBAC permission has been granted) with filter option -
Expands/collapses the tree view
-
Unsuccessful steps panel that helps streamline troubleshooting
-
Test insights that provide a summary of your test results and a list of the test failures
-
Build Failure Analyzer (BFA) that displays the results from the BFA plugin. It displays a list of identified problems and you can view the annotated lines that are updated in the log view.
-
Build artifacts that let you directly access the build artifacts with a link to the build artifacts report
-
Related builds in the tree; displays the origin (parent) of the build and the builds triggered in the Pipeline.
-
Shortcuts that highlight the Pipeline Explorer keyboard shortcuts as shown in the following figure
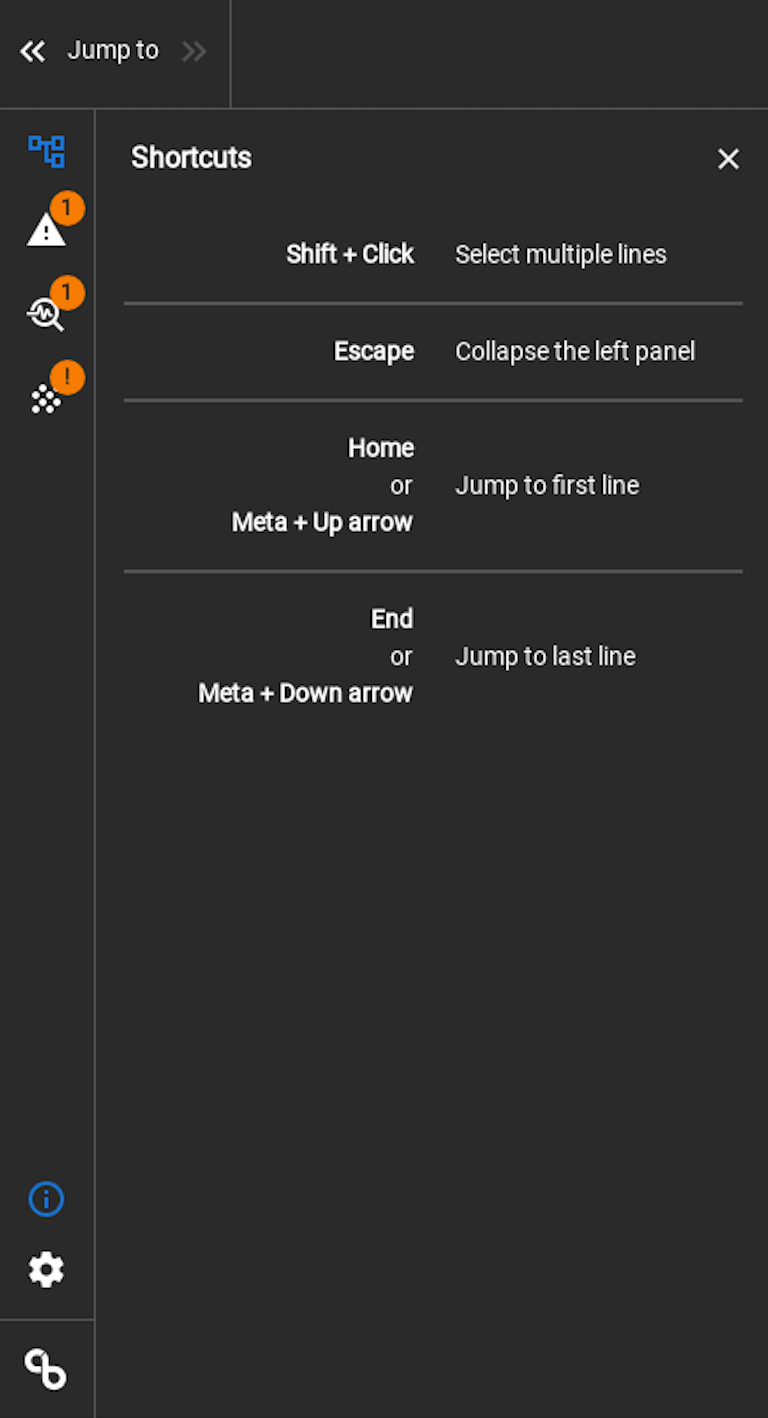 Figure 2. CloudBees Pipeline Explorer shortcuts
 -
Expands/collapses the user preferences view
-
Link to CloudBees documentation
-
Closes the tree drawer
-
Star icon that sets the drawer as favorite. The favorite drawer is open by default.
-
Search bar for stage names
-
Three-dot actions menu that has the expand all, collapse all, and collapse successful options
-
Console output
-
Progress bar that displays the estimated time that remains in a build
-
The expand icon that expands the log view to fullscreen mode
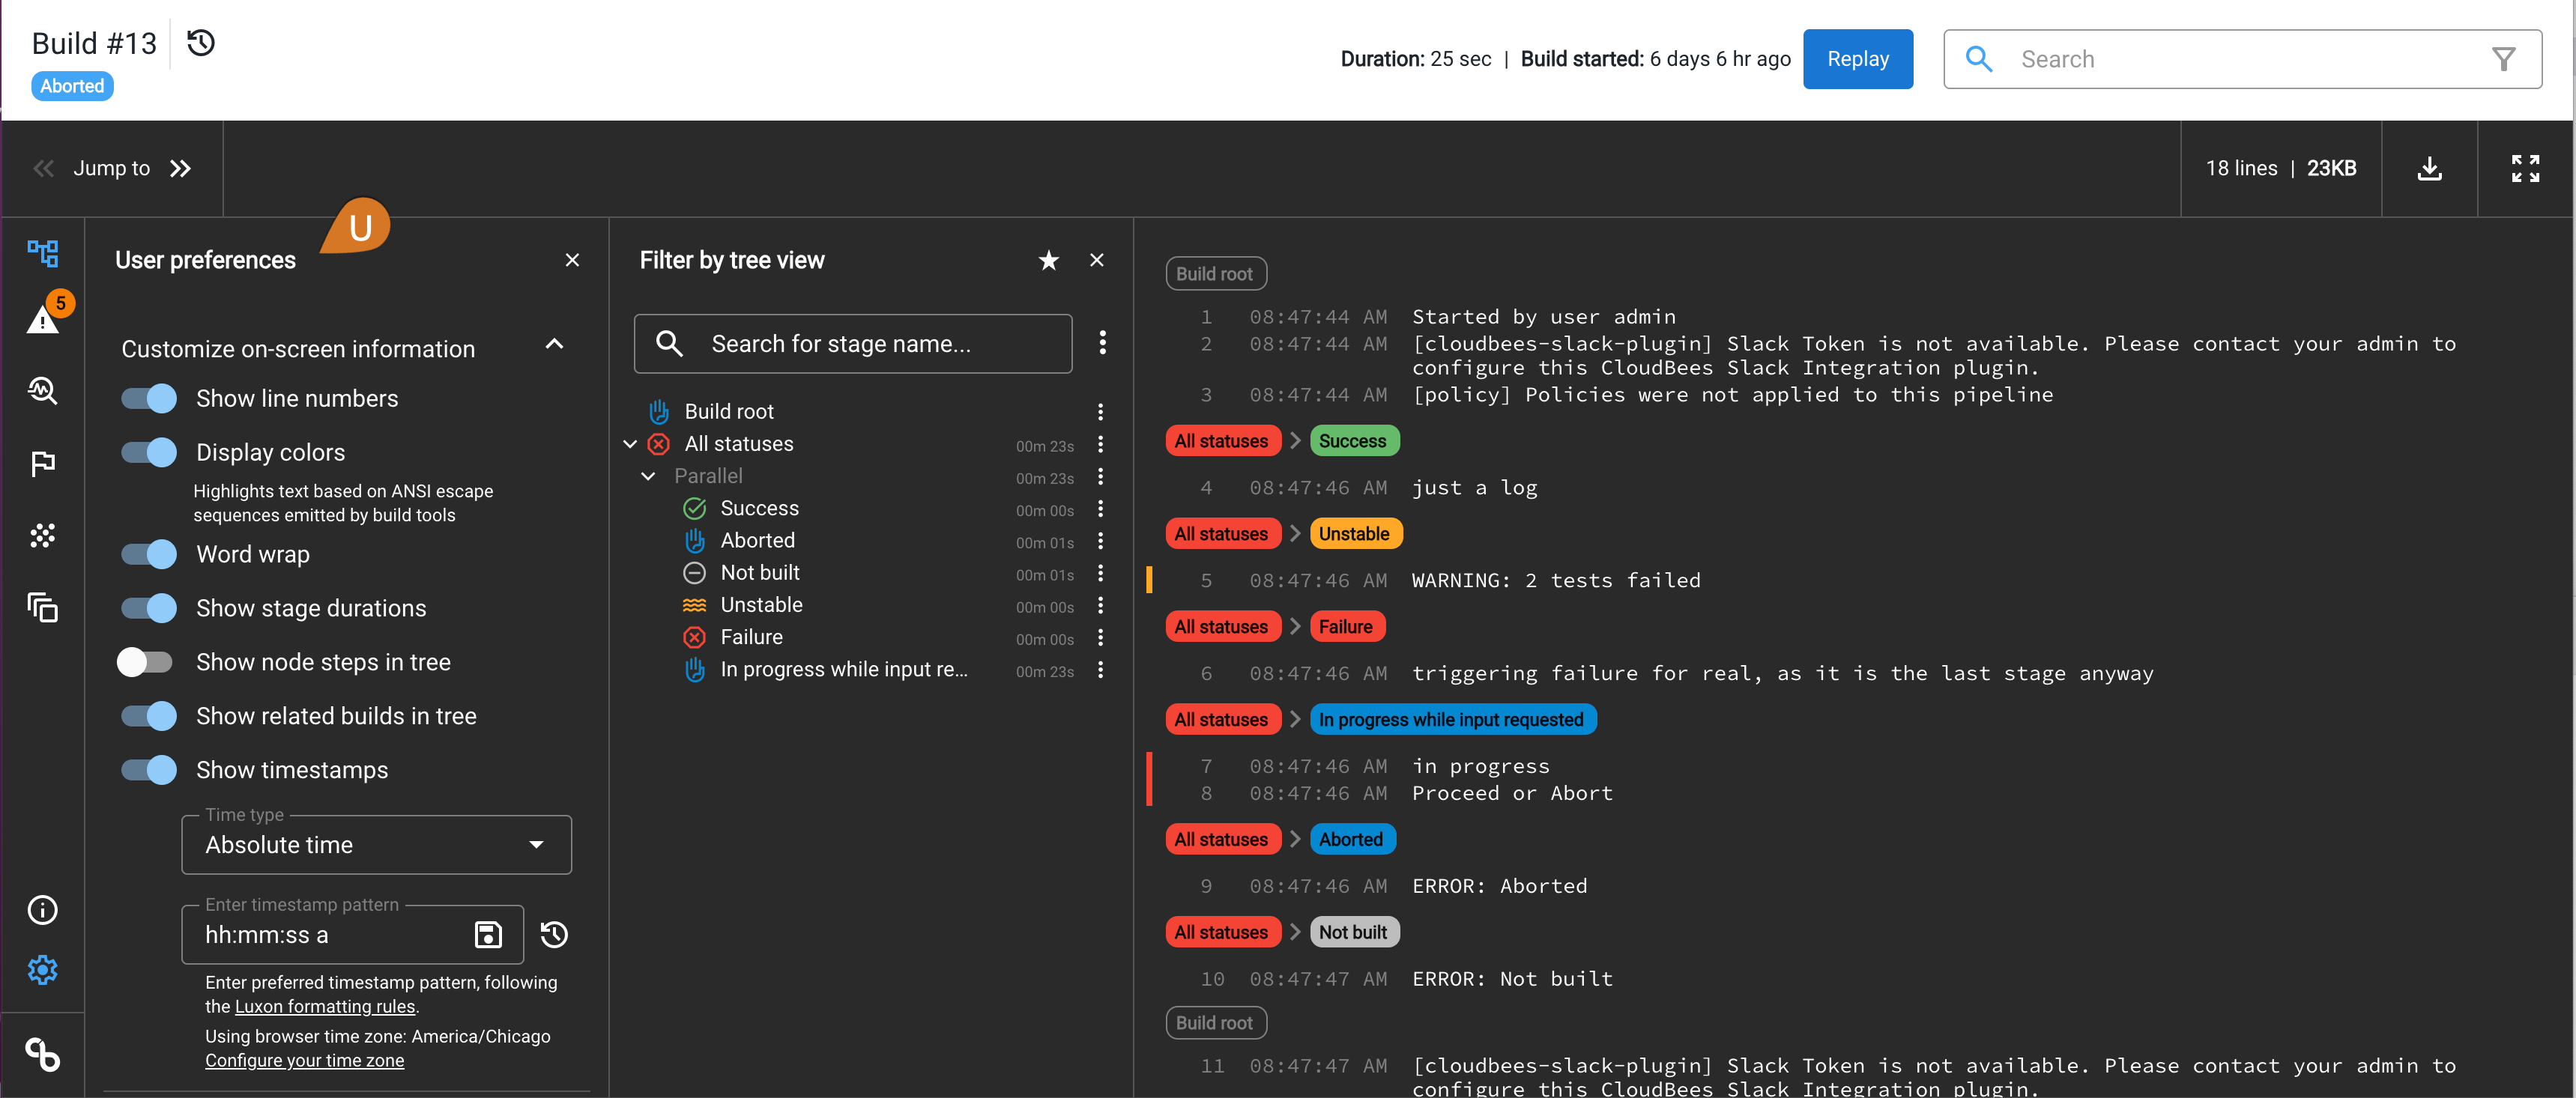 Figure 3. CloudBees Pipeline Explorer user preferences
 -
The customized log view panel (select the settings icon) that lets you personalize the view and behavior options, including the following user preferences:
-
Display line numbers
-
Display ANSI colors (supports ANSI escape sequences that specify 8-bit and 24-bit colors)
-
Wrap long lines
-
Display the duration of each stage in the tree view if the
Show stage durationspreference is enabled -
Display node steps in the tree; displays agents or nodes in the tree view. The menu for node steps includes a View agent info button that brings you to the main page for that computer.
-
Display the related builds in the tree; displays the origin (parent) of the build and the builds triggered in the Pipeline.
-
Display timestamps and their formats. The Pipeline Explorer Timezone uses the preferences in the Jenkins user profile. The timestamp pattern can be saved and the pattern reset to the default.
The ANSI coloring state is not preserved across line boundaries.
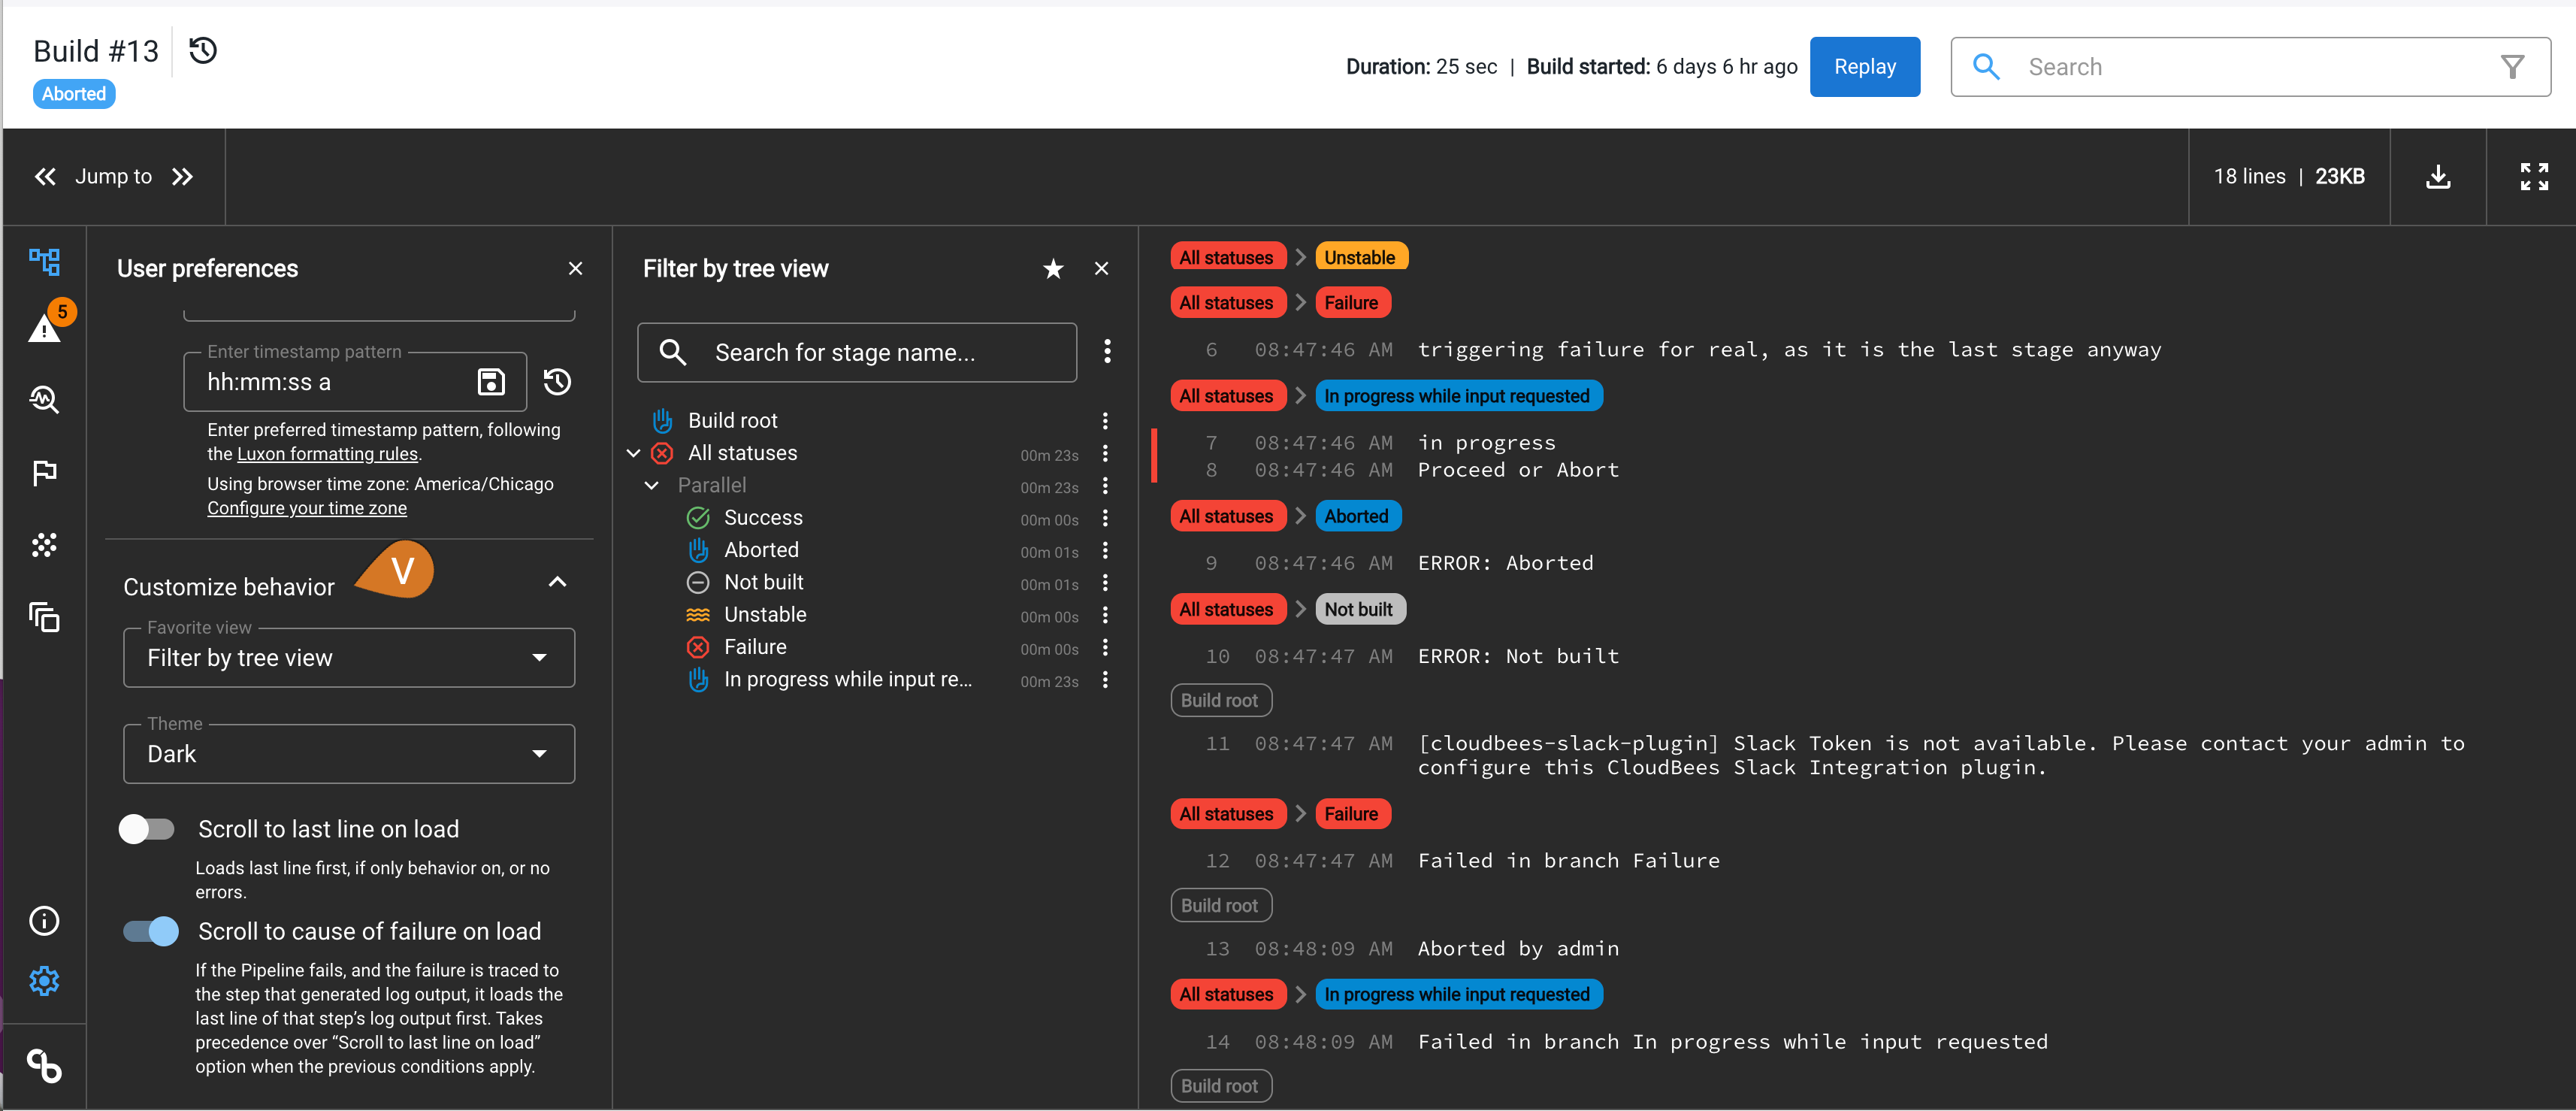 Figure 4. CloudBees Pipeline Explorer behavior preferences
 -
-
The customized log view panel also includes the following behavior preferences:
-
Add a favorite drawer name that opens by default
-
Shows theme options for screen display: dark, light, or match system theme (default)
-
Scroll to the last line on load
-
Scroll to the cause of the failure on load by default
-
Search the logs
The CloudBees Pipeline Explorer can search the build logs within Jenkins. This feature is disabled by default and must be enabled by giving users the Run/SearchLog RBAC permission.
|
For large log files (approximately 1 GB and larger), or for slow storage systems, a search may take several minutes to complete. If there are many searches that are run in parallel, they can cause serious controller-wide performance issues. If you have large log files, you may not want to enable the search feature, or you may only allow a restricted set of users who understand the potential issues to use the search feature, such as Jenkins administrators. |
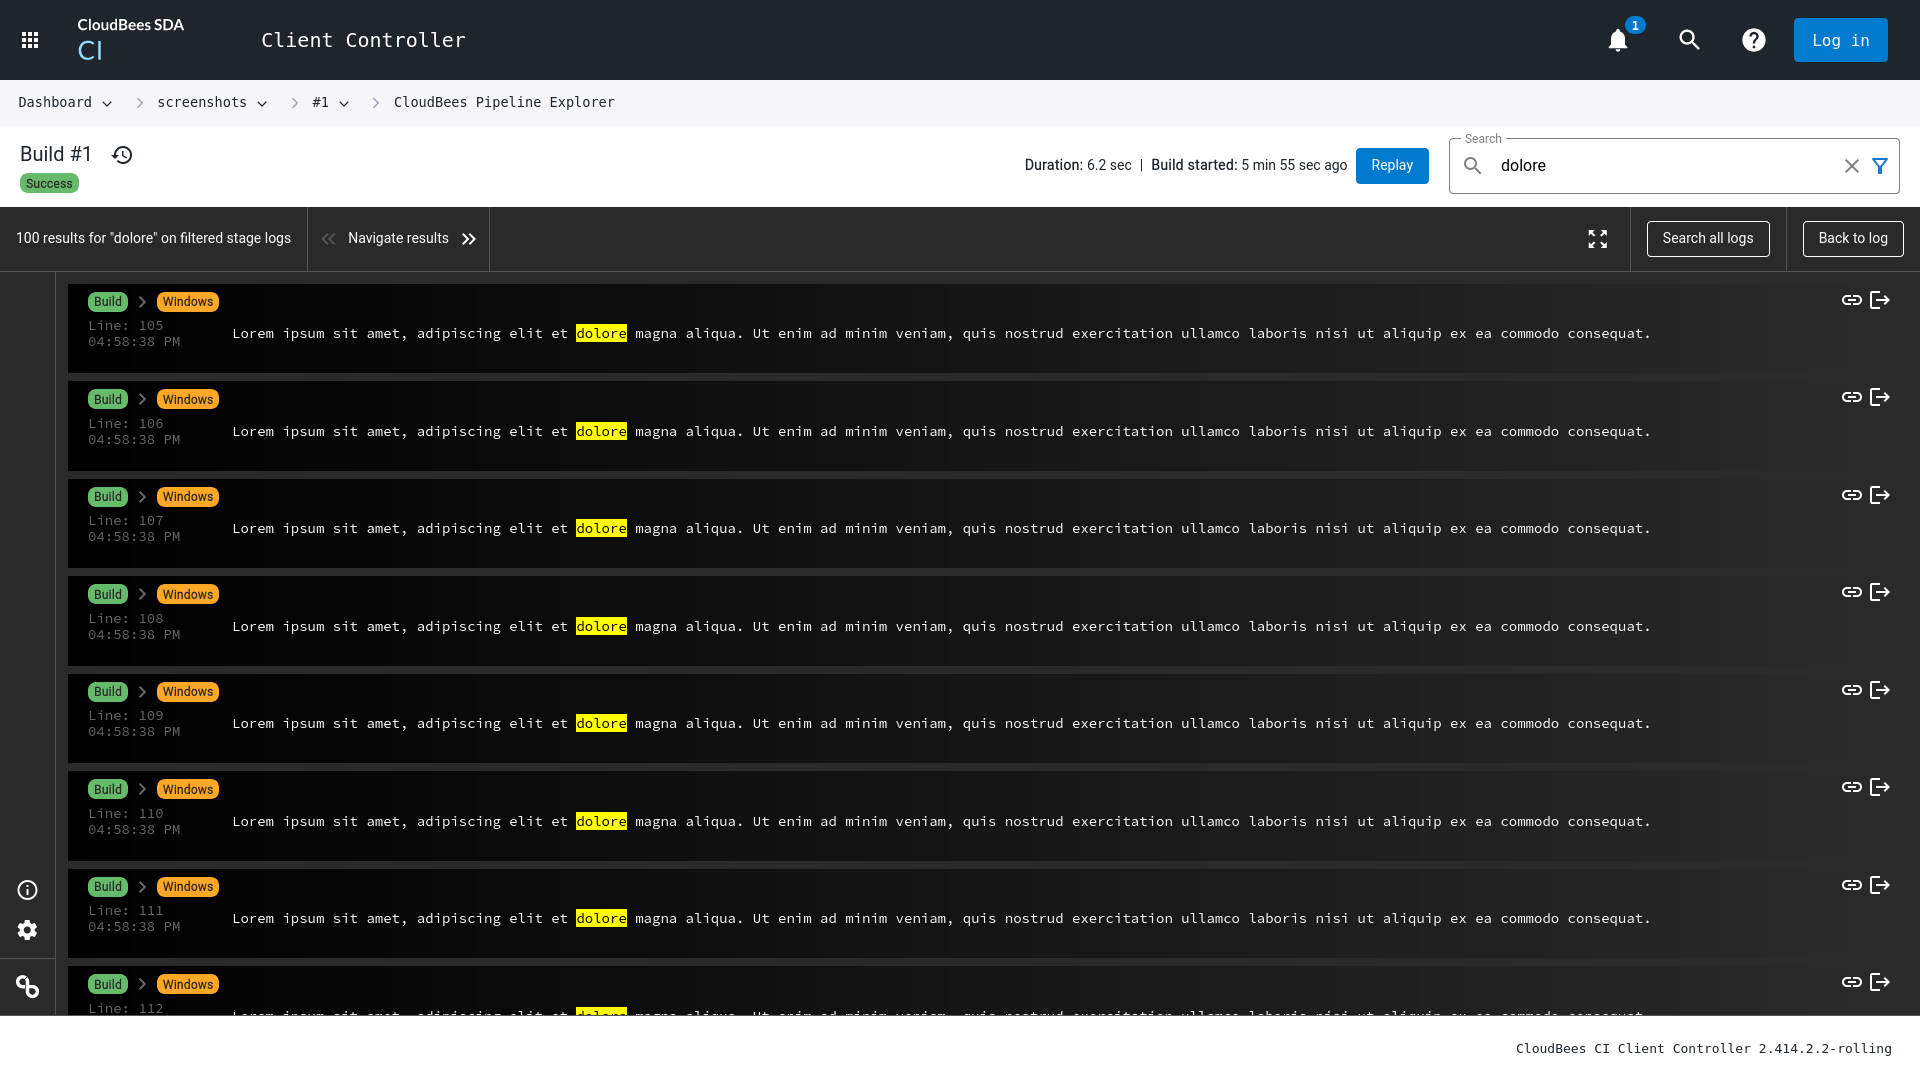
The search feature is case insensitive. When you enter a term in the search bar and press Enter, the CloudBees Pipeline Explorer searches the entire log file for the search term and returns all of the matching lines with the search term highlighted in each result. You can also select the filter icon in the search bar to search only for filtered stage logs. The toolbar displays the total number of search results that were found.
If the search takes longer than the timeout of one minute, the request is canceled with a warning message.
The controller administrator can define a maximum file size for the search. If there is a search on a log or filter that is too large, the search is blocked.
You can also select the following search options:
-
Select the
 link icon to copy a link for a specific line in the log to your clipboard
 -
Select the
 goto icon to go to a specific line in the log in a new browser tab
The following example shows the search results for all logs with the Display colors preferences enabled.
Troubleshoot the pipeline errors
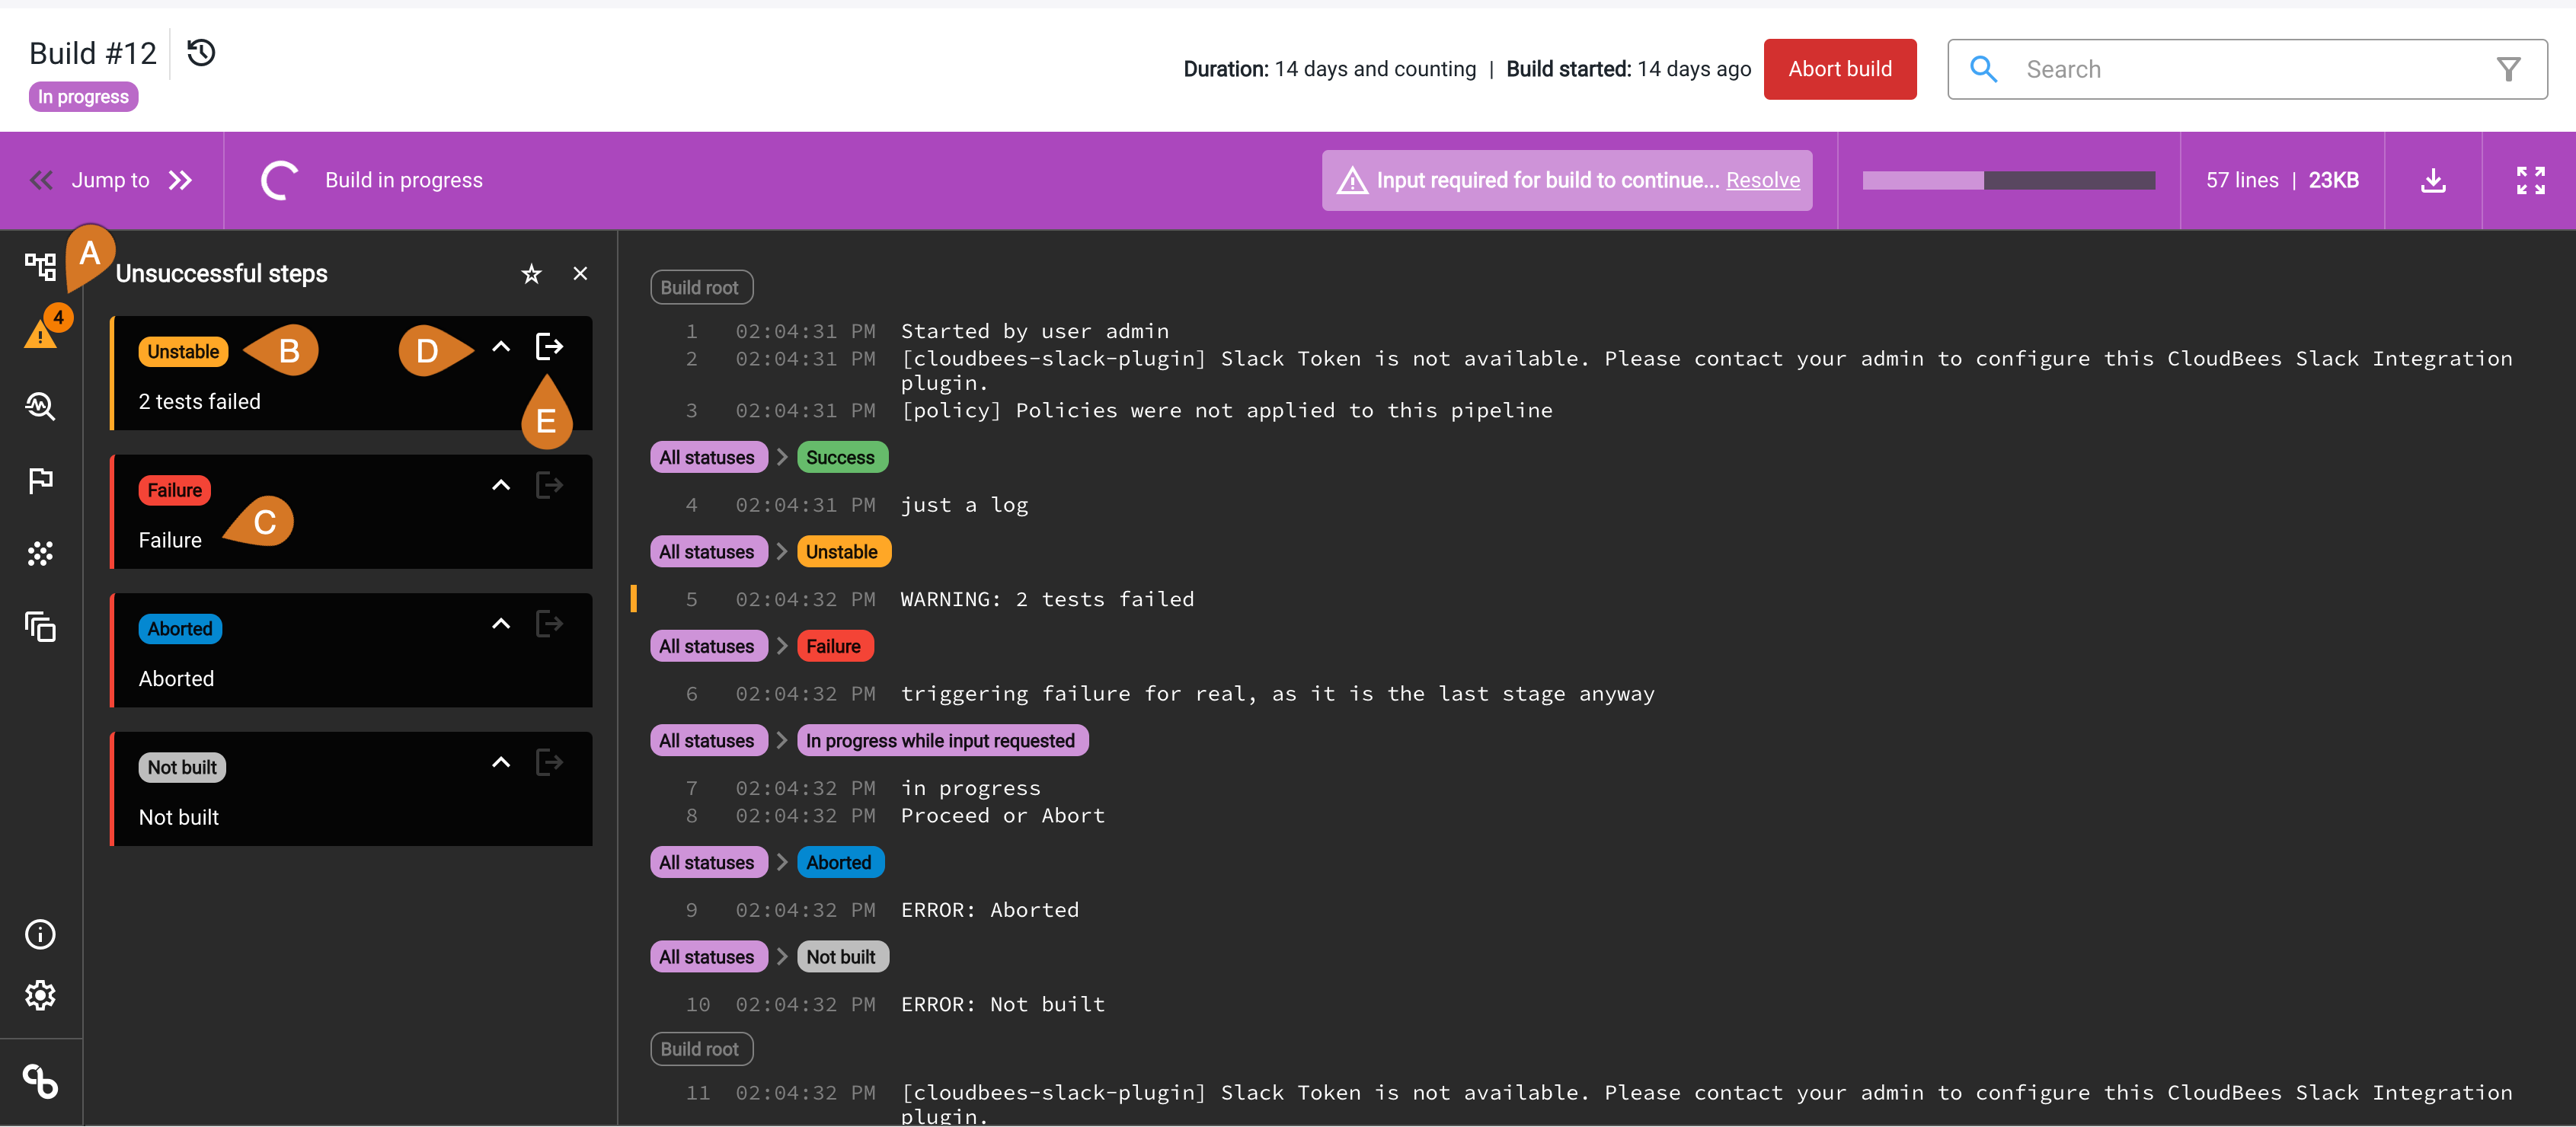
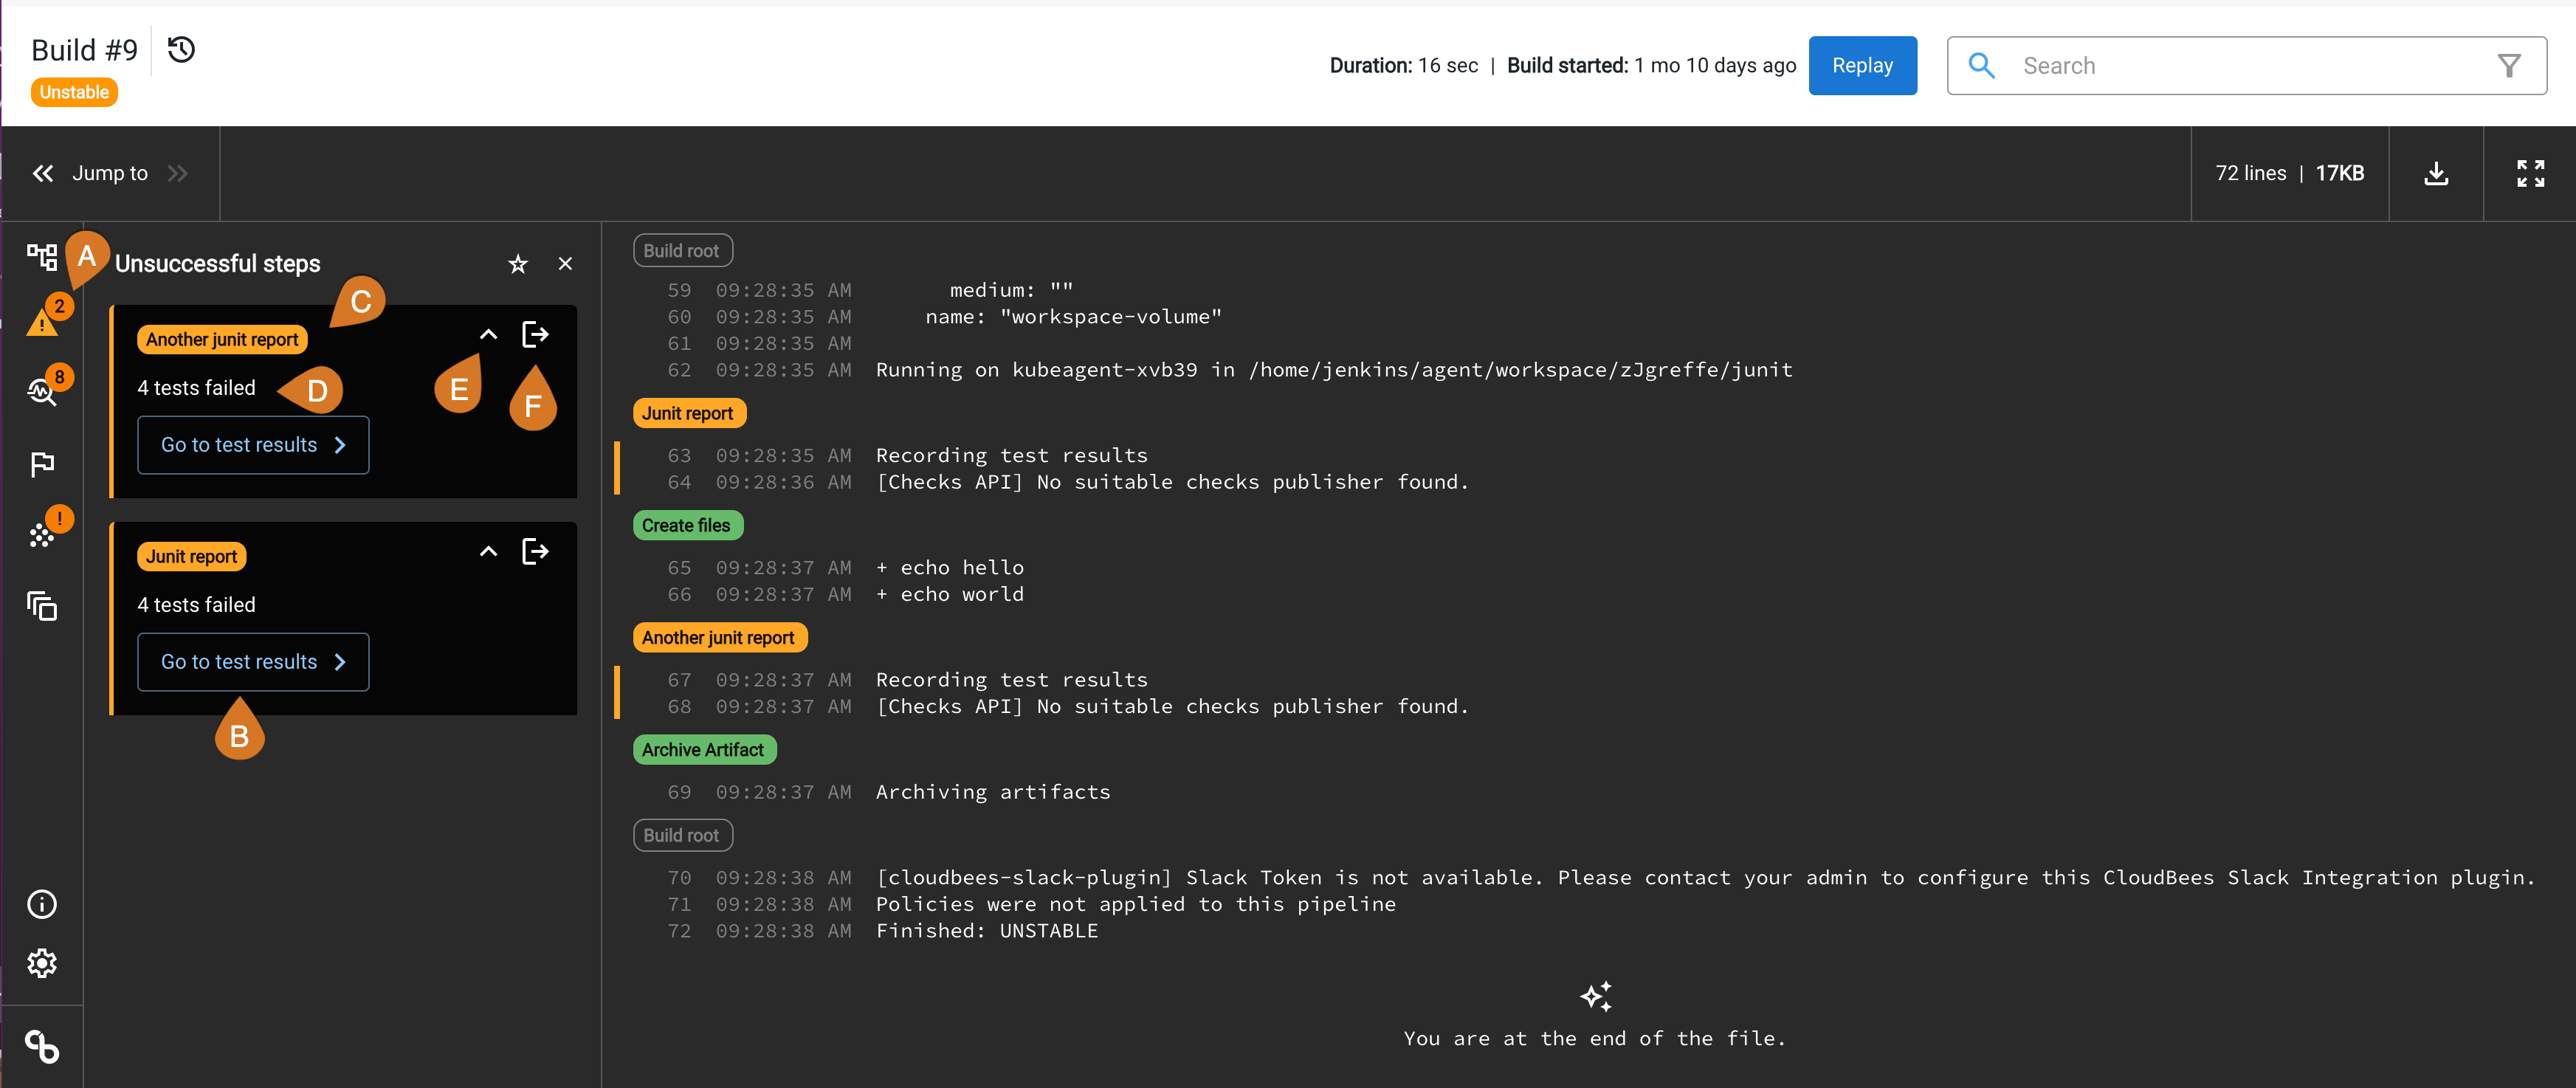
The unsuccessful steps panel helps streamline troubleshooting. This panel displays all of your pipeline errors, including errors that are not directly associated with any log lines. Each issue displays the stage and error message. If there is an associated log line, a go-to link is provided that can be shared.
The following examples show the unsuccessful steps panels.
-
Indicates the number of issues found
-
Stage label where the issue is found
-
Issue message
-
Collapse arrow that collapses the issue text
-
Door icon that displays the issue in the log
-
Indicates the number of issues found
-
Displays the failing tests with links that send the user to the JUnit test results page
-
Stage label where the issue is found
-
Issue message
-
Collapse arrow that collapses the issue text
-
Door icon that displays the issue in the log
Manage test results
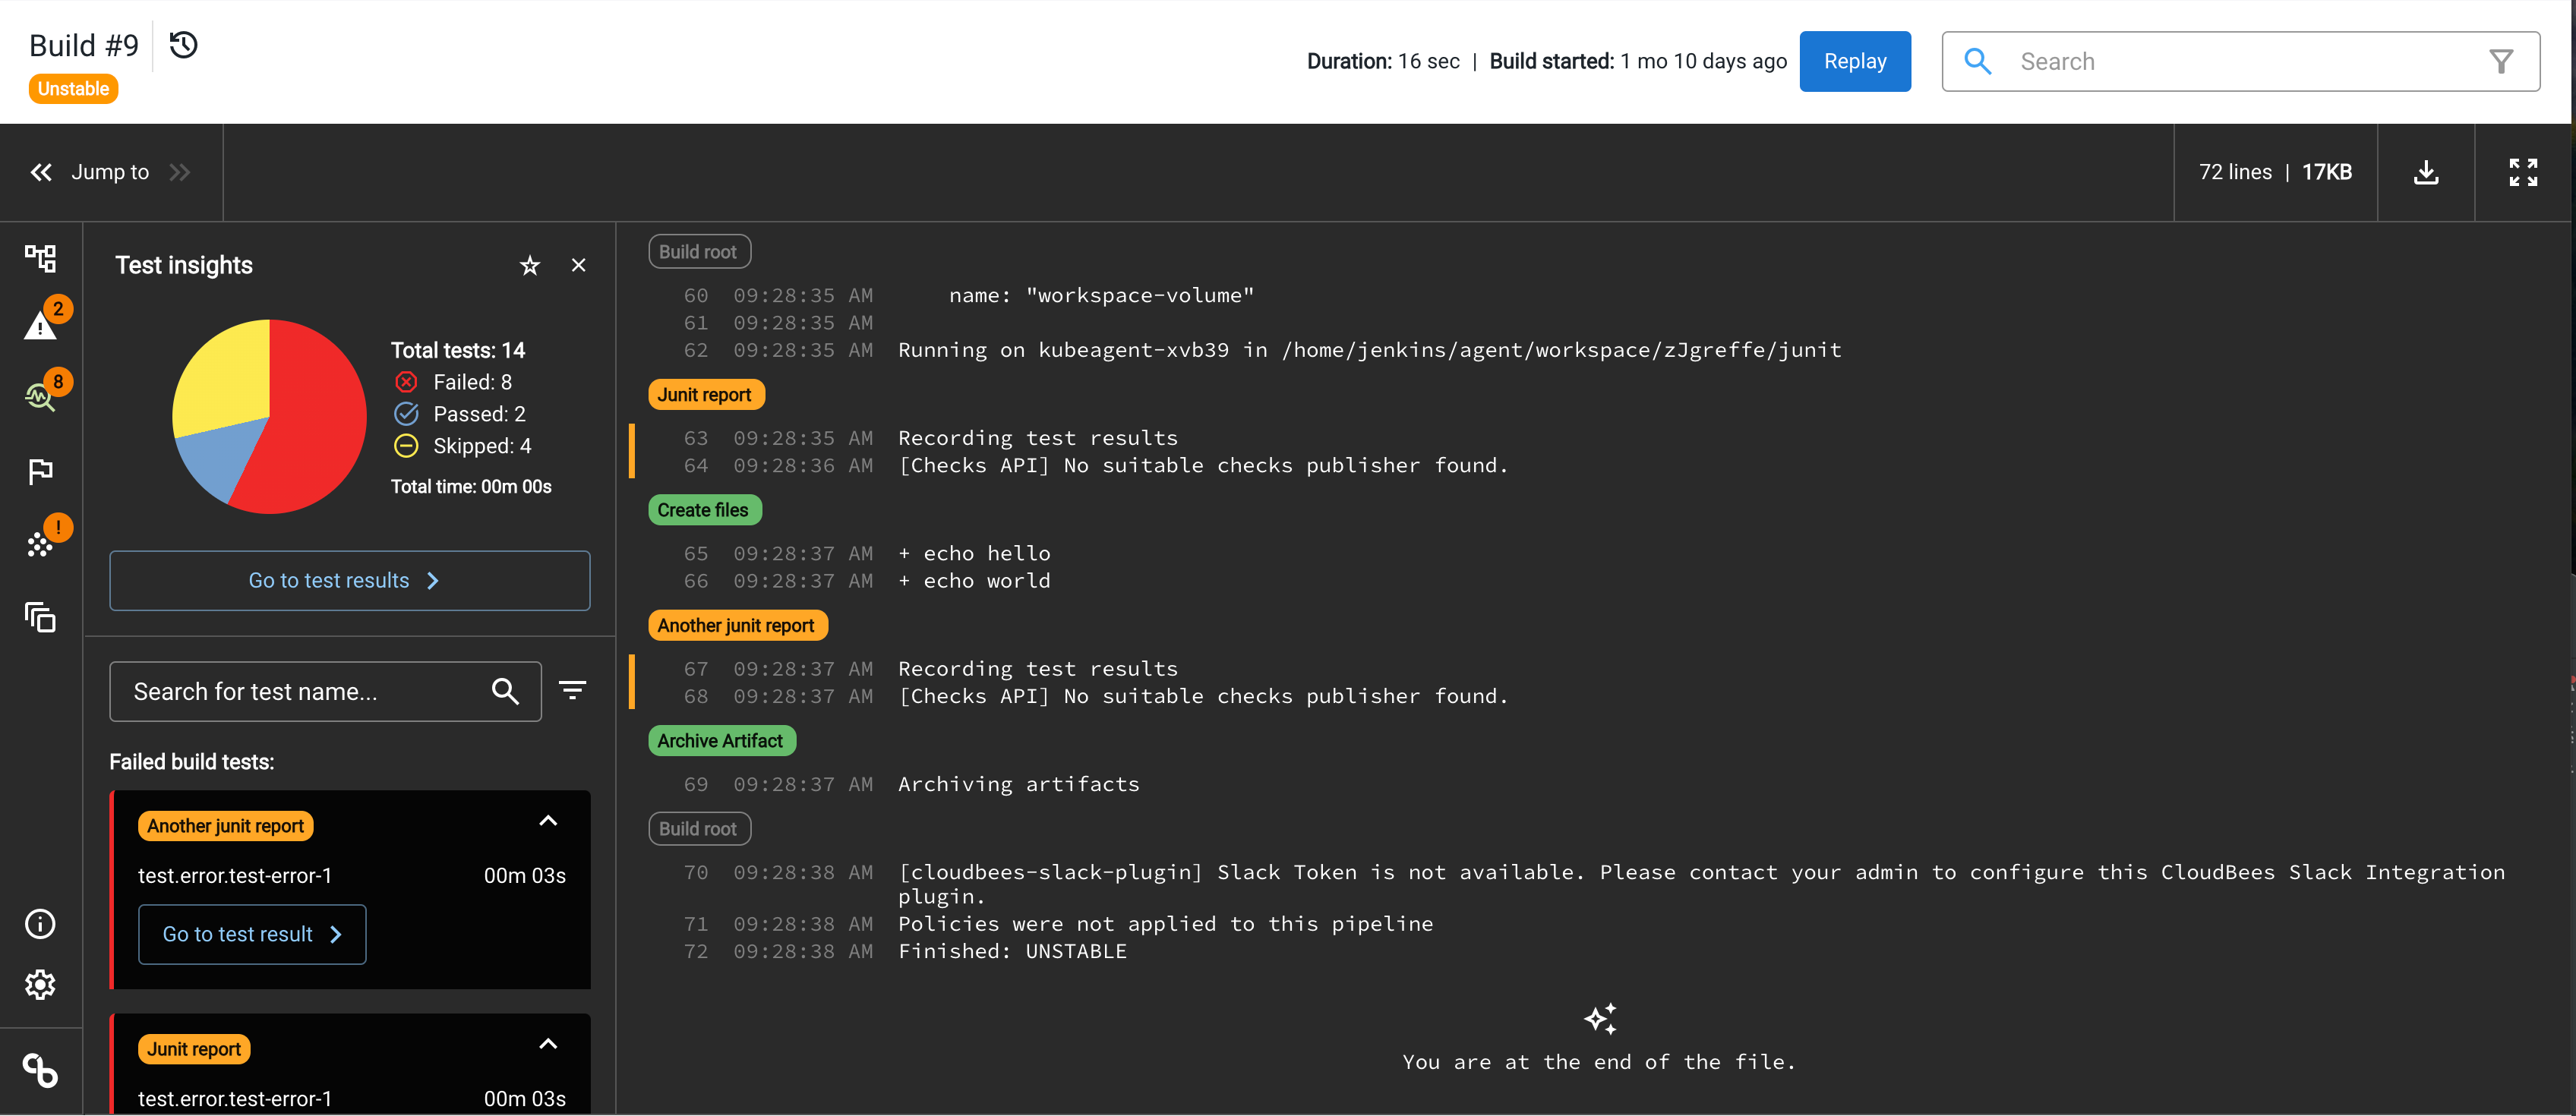
The test insights panel is available in the Pipeline Explorer that is based on the JUnit test results. In this panel, users can find a summary of their test results and a list of test failures. Each failure includes the stage it was in and a link to that test in the JUnit plugin page. Users can also search for test and test class names, sort tests by name or duration, and display individual test results.
The following figure shows an example of the test insights display.
Analyze the build failures
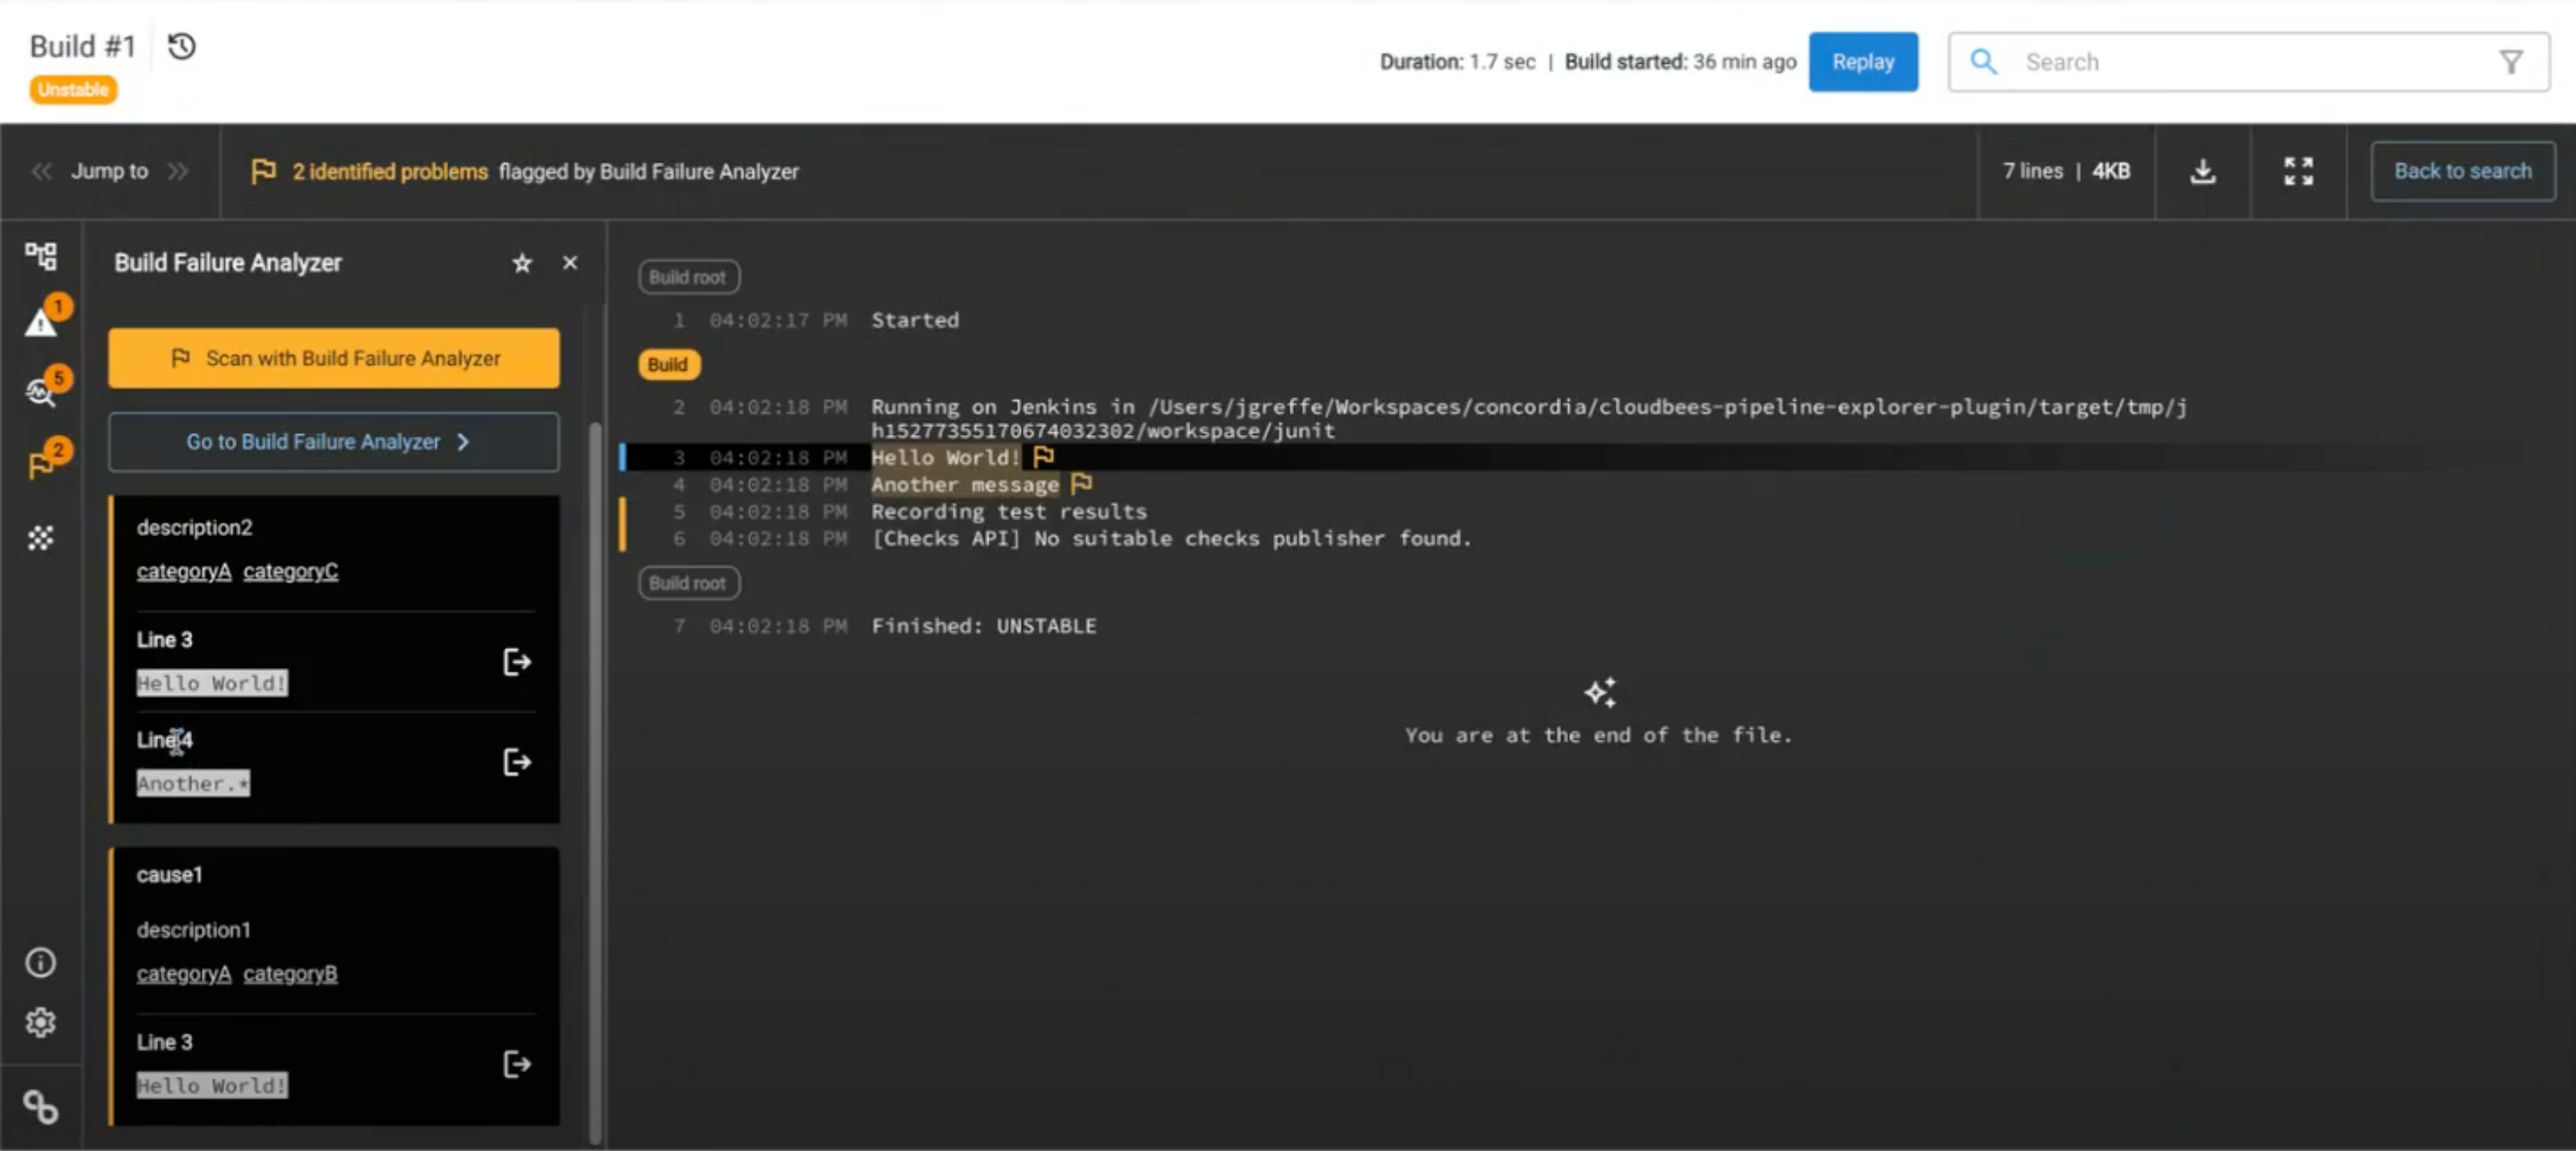
The CloudBees Pipeline Explorer users that installed the Build Failure Analyzer (BFA) plugin can access a side panel and view indications that are found after a BFA scan and are also marked in the logs.
The Build Failure Analyzer (BFA) displays the results from the BFA plugin. It displays a list of identified problems and you can view the annotated lines that are updated in the log view. The identified problems display the name, description, categories configured in the BFA plugin, and the related lines in the build.
You can also select the Scan with Build Failure Analyzer option to access the failed BFA builds, where you can scan either the non-scanned builds (the default) or all of the recurrent builds.
The following figure shows an example of the BFA display.
Access build artifacts
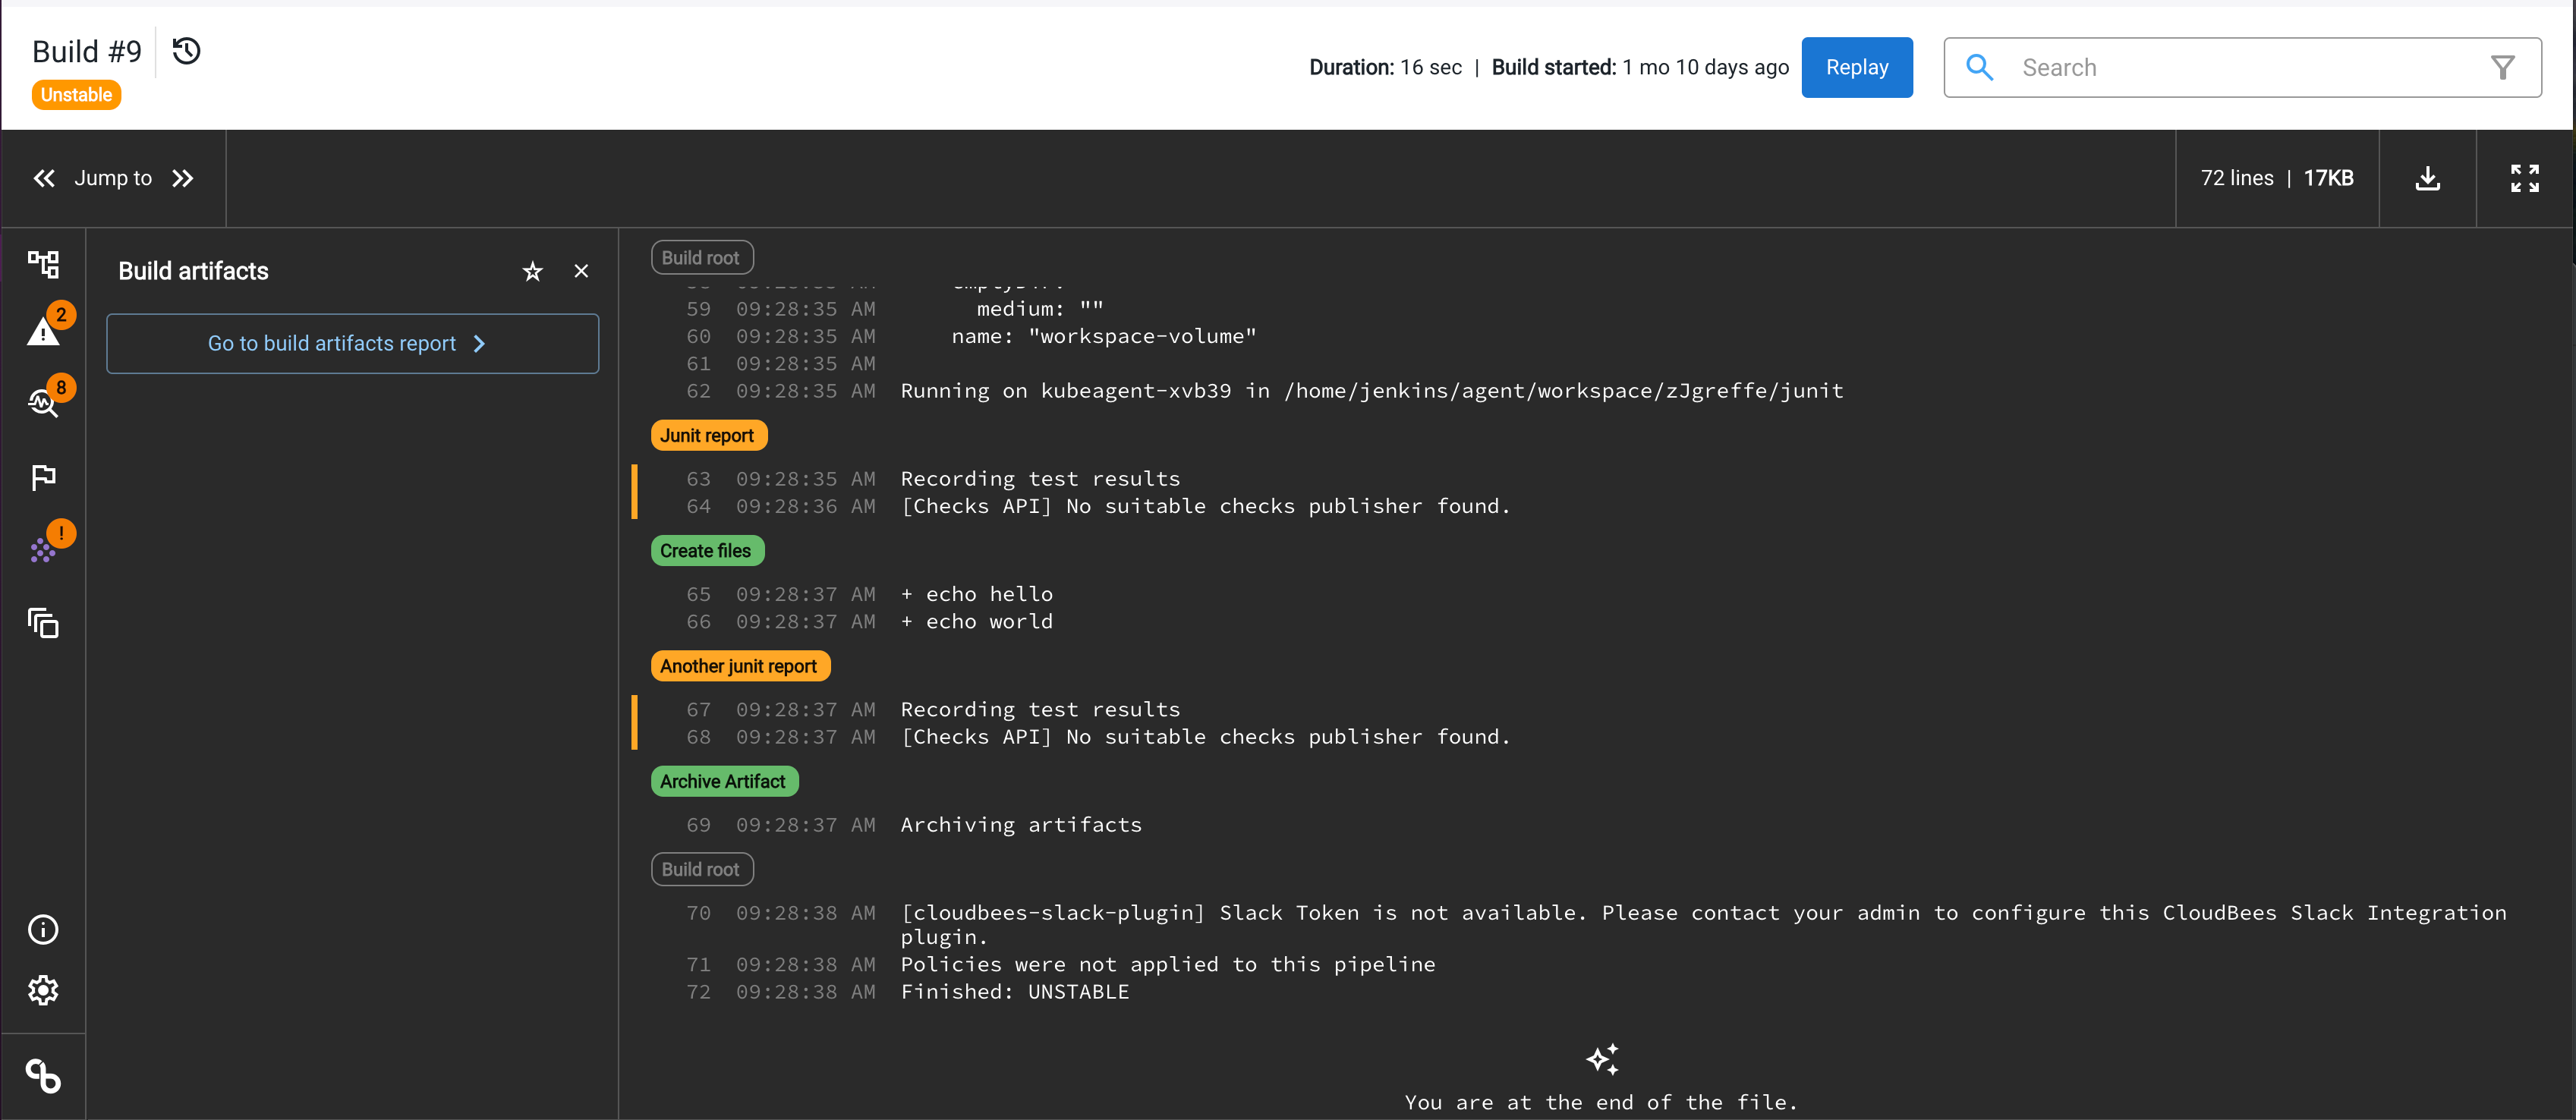
The build artifacts allow you to directly access your build artifacts with a link to the build artifacts report. Build artifacts are the files produced by a build and they typically include the distribution packages, WAR files, reports, and log files.
The following figure shows an example of the build artifacts display.
View related builds
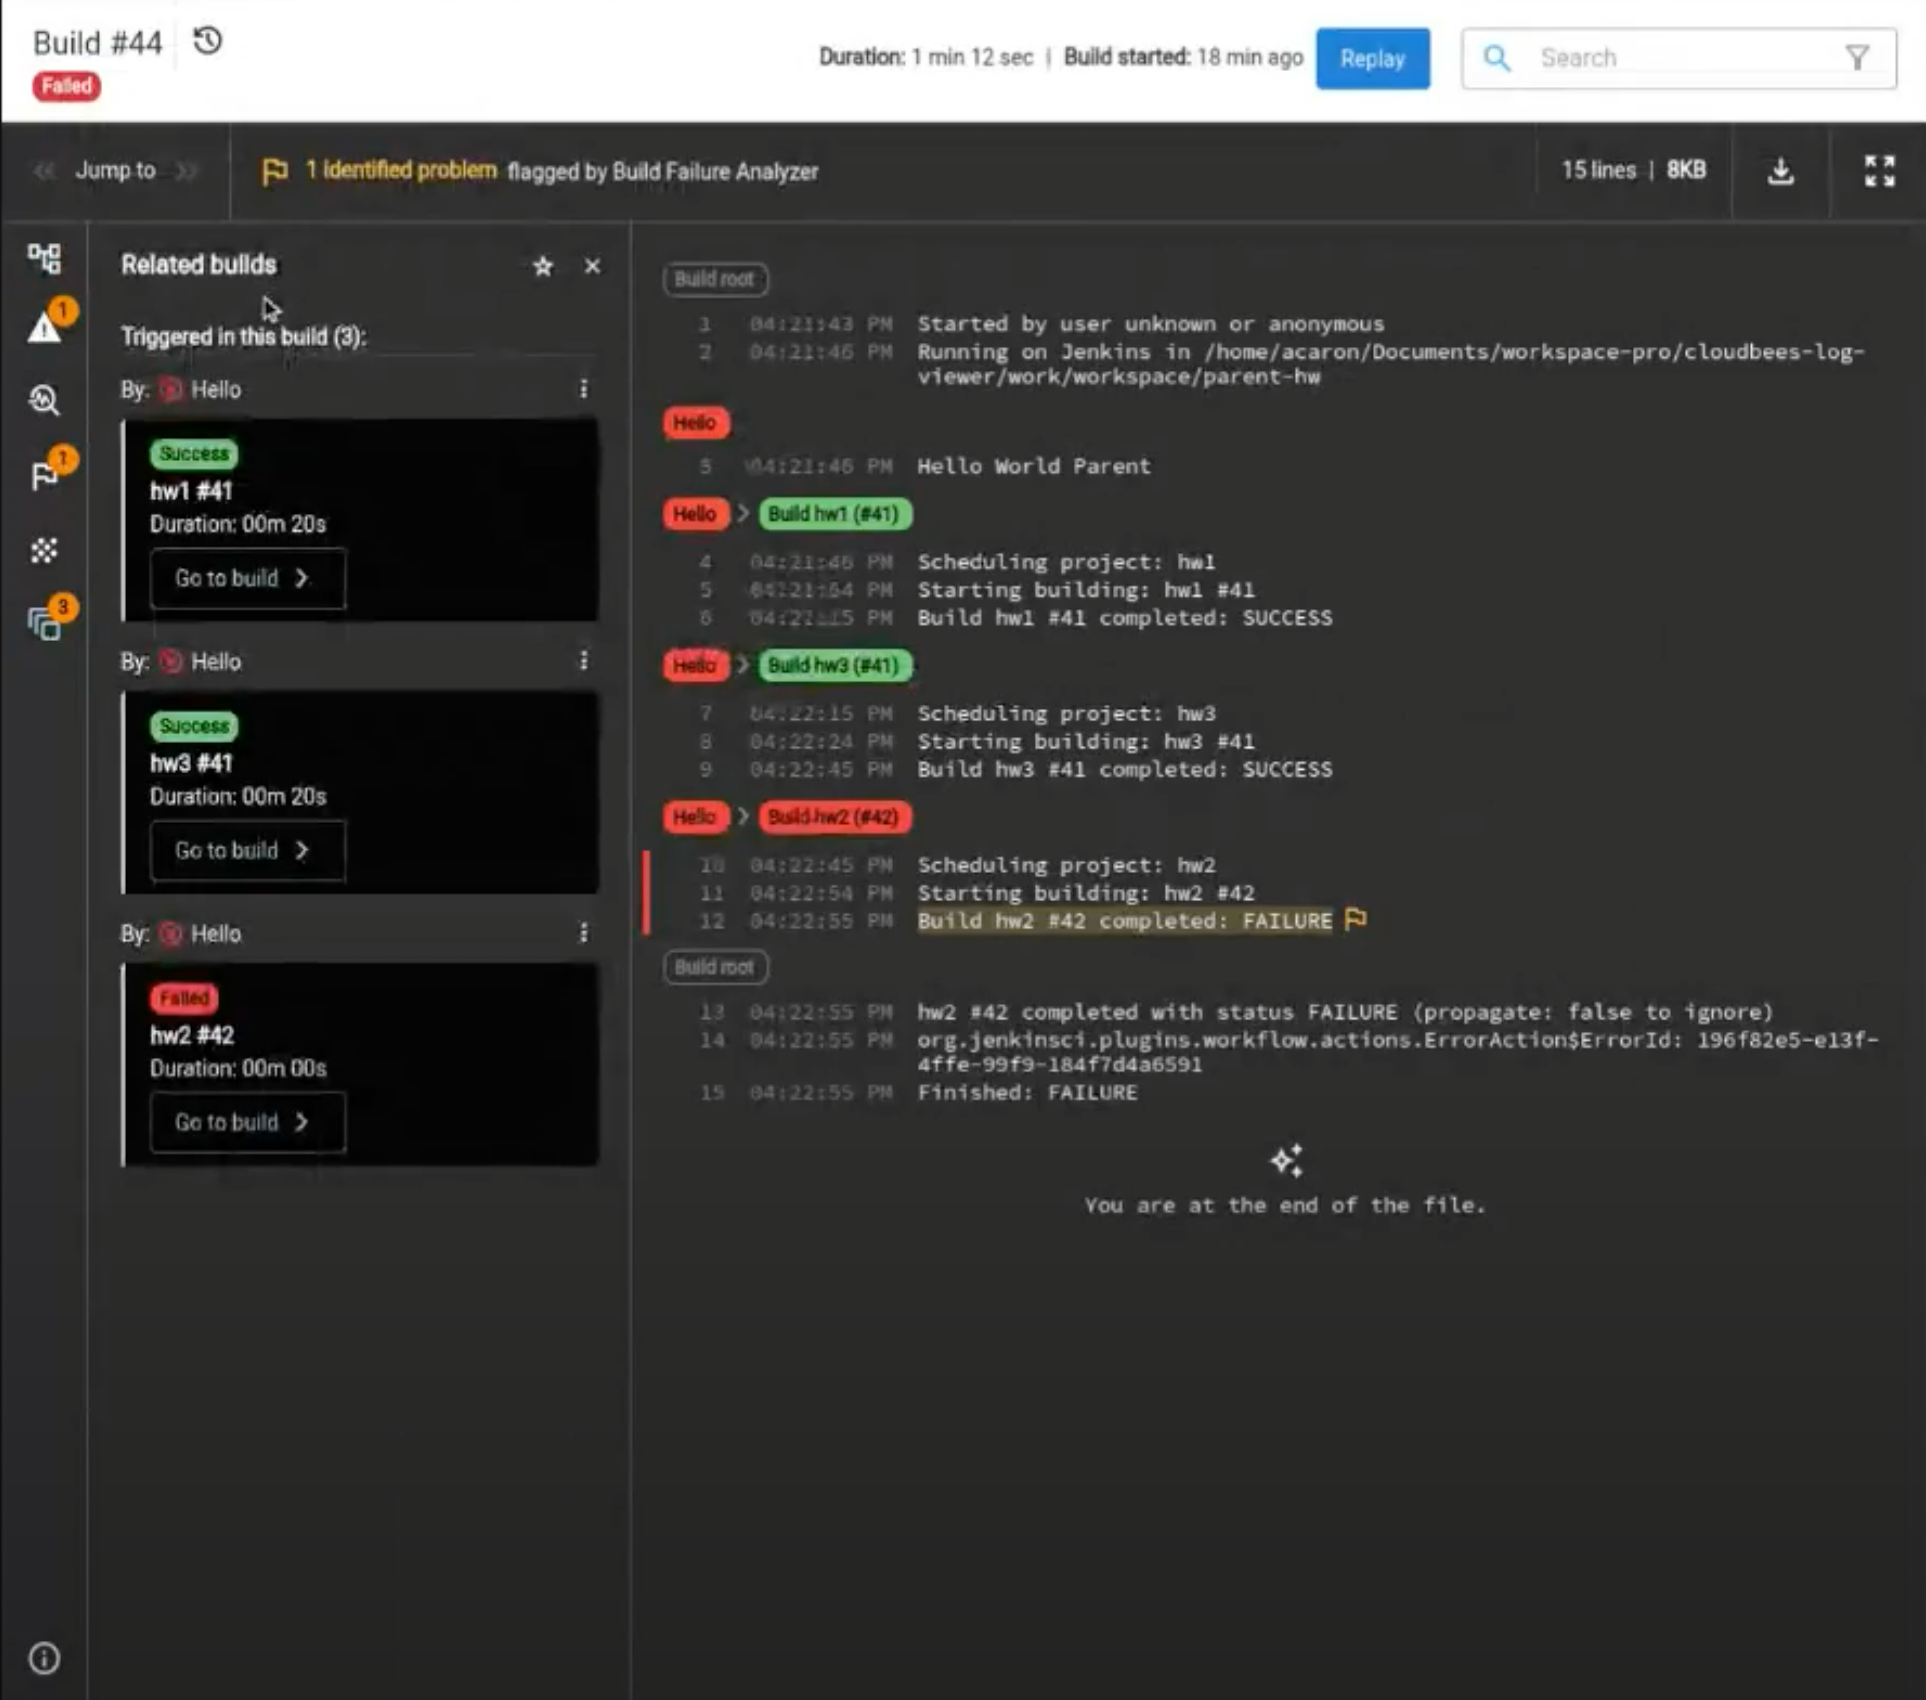
The related builds panel allows you to display the builds related to your current build. The tree view also displays the related builds in the stage in which the build was triggered. The related builds include the builds triggered in the current build and the origin (parent) build that triggered the current build.
The following figure shows an example of the related builds panel.
Autopoll
In the CloudBees Pipeline Explorer, when a build is in progress, you can enable autopolling to refresh the logs. If the related builds drawer is open, the related builds are also refreshed.
To configure autopolling, go to Jenkins > Manage Jenkins > System and enable the autopolling option.
For information about the CloudBees Pipeline Explorer plugin requirements and releases, refer to CloudBees Pipeline Explorer Plugin.