CloudBees Pipeline Explorer offers a scalable and performant approach to troubleshoot Pipelines and view logs to boost developer productivity and efficiency.
- Enhanced navigation and visualization
-
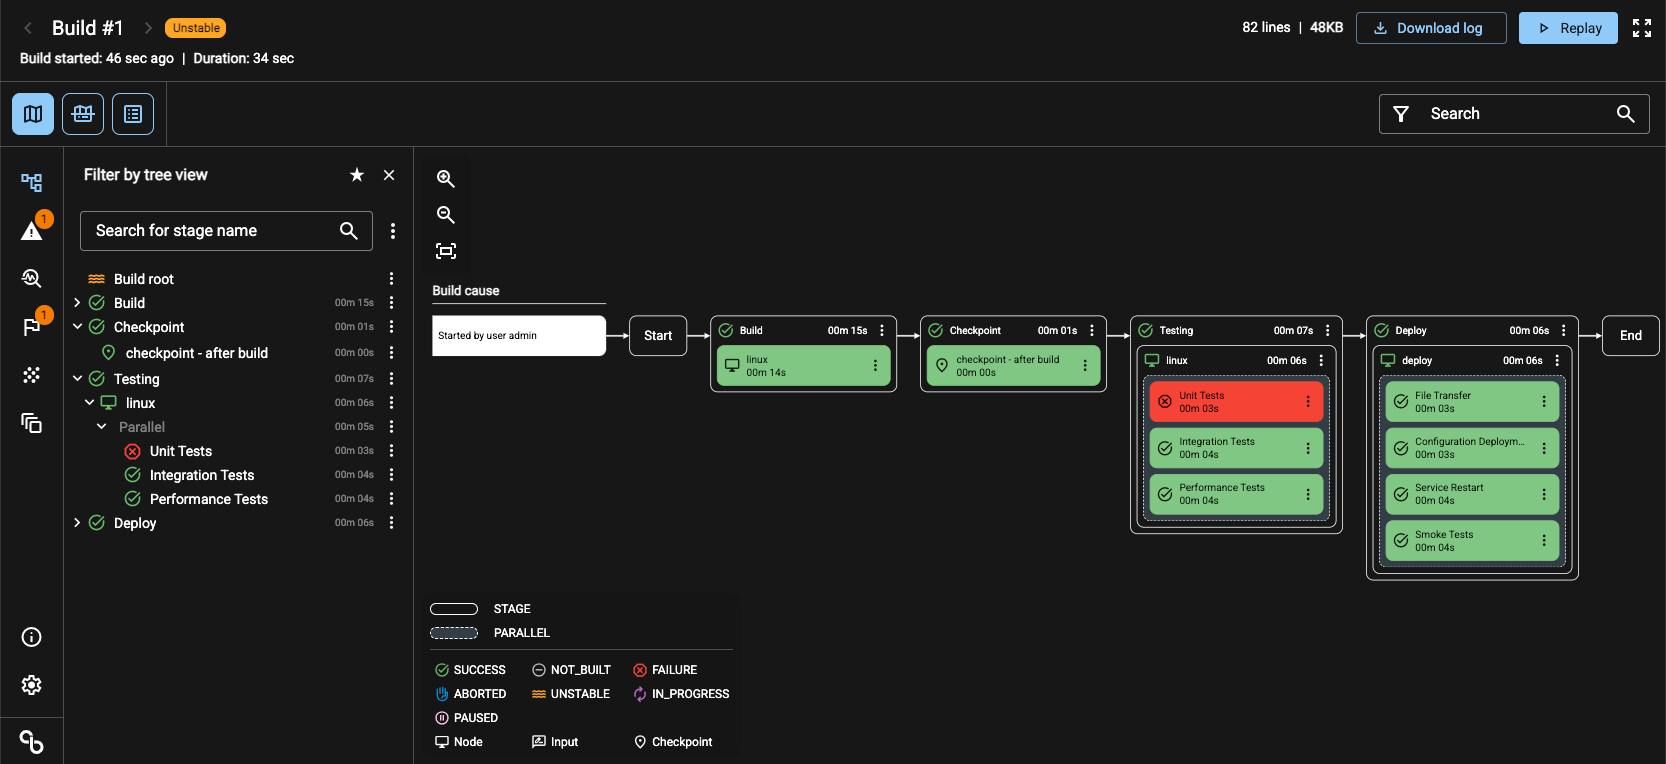
The CloudBees Pipeline Explorer map view simplifies troubleshooting by visualizing complex Pipelines. With intuitive map and tree views, you can quickly pinpoint problem areas and identify failed stages or steps.
- Intuitive overview and filtering
-
Gain a better understanding of complex Pipelines with an overview of the entire Pipeline and filtering for each stage. Filter to specific Pipeline steps, while preserving line numbers to maintain context of the steps in the log.
- Built-in search and issue discovery
-
Quickly search logs, remove the need for external tools that result in context switching, and get right to the issue in the log from a list of identified issues.
- CloudBees Pluggable Storage
-
CloudBees CI provides a scalable approach for storing Pipeline build logs to cloud object storage. For more information, refer to Archive Pipeline build logs with CloudBees Pluggable Storage.
| If your Pipeline generates ephemeral credentials at runtime, such as AWS STS tokens or JWTs, you can mask them automatically in build logs without requiring Pipeline changes. For more information, refer to Mask ephemeral secrets in Pipeline build logs. |
(Optional) Configure CloudBees Pipeline Explorer
CloudBees Pipeline Explorer is installed and enabled to CloudBees CI by default, and does not require additional configuration. However, you can optionally configure the following settings based on your specific requirements:
Modify the default CloudBees Pipeline Explorer settings
By default, auto-polling is enabled, log size limits are configured when performing searches, and CloudBees Pluggable Storage is not enabled. Administrators can modify these default settings on the controller.
-
Sign on to the controller as a user with Administer privileges.
-
Select in the upper-right corner to navigate to the Manage Jenkins page.
-
Select System, and then scroll down to CloudBees Pipeline Explorer, which is enabled by default.
-
Modify the CloudBees Pipeline Explorer settings.
-
Auto-polling is enabled and configured to refresh the logs every 10 seconds when a build is in progress or to refresh any related downstream builds when the Related builds panel is active. Optionally, disable auto-polling or modify the refresh rate.
-
The Log size limit when searching is configured to 1000 MB (1 GB). Optionally, modify the log size limit.
For large log files (approximately 1 GB or more) or slow storage systems, searches may take several minutes to complete. Running multiple searches in parallel can significantly impact controller-wide performance.
-
To archive Pipeline build logs with CloudBees Pluggable Storage, select CloudBees Pluggable Storage for Pipeline build logs. Refer to Archive Pipeline build logs with CloudBees Pluggable Storage for setup and configuration instructions.
-
-
Select Save.
Configure CloudBees Pipeline Explorer build links on the controller
Administrators can optionally route links to build logs and links in external notifications (for example, in Slack, GitHub, or emails) directly to CloudBees Pipeline Explorer. These settings apply to all users that are signed on to the controller, which can be useful when deploying CloudBees Pipeline Explorer on a new controller.
-
Sign on to the controller as a user with Administer privileges.
-
Select in the upper-right corner to navigate to the Manage Jenkins page.
-
Select Appearance.
-
Under Configure URL Provider, select Add, and then select CloudBees Pipeline Explorer. If there are links in CloudBees CI that typically navigate you to a build log, they will now take you directly to CloudBees Pipeline Explorer.
-
Select Save.
-
Select in the upper-right corner to navigate to the Manage Jenkins page.
-
Select System.
-
Under Default notification URL, select CloudBees Pipeline Explorer. If there are external links for specific builds (for example, in Slack, GitHub, or emails), they now take you directly to CloudBees Pipeline Explorer.
-
Select Save.
Configure CloudBees Pipeline Explorer build links for individual users
Individual users can optionally route links to build logs and links in external notifications (for example, in Slack, GitHub, or emails) directly to CloudBees Pipeline Explorer. These settings apply to the individual user only, and opts out of the settings configured by the administrator on the controller.
-
Sign on to the controller.
-
Select your username in the right of the top navigation bar, and then select Account.
-
Under Configure URL Provider, select Add, and then select CloudBees Pipeline Explorer. If there are links in CloudBees CI that typically navigate you to a build log, they will now take you directly to CloudBees Pipeline Explorer.
-
Under Default notification URL, select CloudBees Pipeline Explorer. If there are external links for specific builds (for example, in Slack, GitHub, or emails), they now take you directly to CloudBees Pipeline Explorer.
-
Select Save.
Troubleshoot Pipelines
CloudBees Pipeline Explorer allows you to quickly troubleshoot your Pipelines by allowing you to easily identify and locate issues within the Pipeline structure without having to manually review the logs.
To troubleshoot your Pipelines:
-
Sign on to the controller, navigate to the Pipeline, and optionally select Build Now in the left pane to run a new Pipeline build.
-
Select the appropriate build number, and then select CloudBees Pipeline Explorer in the left pane.
If you configured CloudBees Pipeline Explorer as the Console URL Provider on the controller or for an individual user, select the build status icon to navigate directly to CloudBees Pipeline Explorer. By default, the
 log view is displayed, where you can:
-
Use the Jump to option, to quickly navigate to the first or last lines of the log.
-
Enter a Line number to navigate directly to a specific line in the log.
-
Select to access the log line menu to select a line, or range of lines, and copy a link to the selected line(s) or copy the selected log content.
-
-
Optionally, select
 to display the map view or
  to display the split view, which allows you to see both the map and log at the same time.
The map view allows you to visualize and navigate through complex Pipelines, zoom in on problem areas, identify failed stages or steps at a glance, and restart the Pipeline from a top-level stage or checkpoint.
-
The left-to-right view represents sequential stages.
-
The top-to-bottom view represents parallel branches.
-
-
Select
 to configure your user preferences.
-
By default, when you launch CloudBees Pipeline Explorer, the log view automatically scrolls to the last line. If you prefer to start at the first line instead, disable the Scroll to last line on load option. If you prefer that the log view scroll to the first line in the log, disable the Scroll to last line on load option.
-
By default, the log view displays four color-coded context badges to easily identify enclosing stages for specific log lines. You can adjust the number of context badges that are displayed or disable the Limit context badges option.
-
CloudBees Pipeline Explorer supports light mode and dark mode themes, and matches your system theme by default. To customize the appearance, scroll down to Customize behavior, and then select the appropriate theme.
-
-
To troubleshoot your Pipeline, expand one or more panels in the left pane.
-
 Filter by tree view: View the Pipeline in a tree view to quickly filter the log lines or map view. To filter the log, either search for a stage or step name or select a stage or step in the tree view.
You can also select next to a top-level stage or checkpoint and restart the Pipeline.
-
To drill down into individual Pipeline steps within a stage, select next to a stage name, and then select Show steps in branch.
-
Once filtered, you can also search the filtered log.
-
To clear the active filter, select next to the stage name, and then select Clear filter.
-
-
 Unsuccessful steps: View individual Pipeline steps that were not successful, including errors that are not directly associated with any log lines.
Each issue displays the stage, the error message, and if possible, a link to the line number in the log where the error occurred.
Unsuccessful steps: View individual Pipeline steps that were not successful, including errors that are not directly associated with any log lines.
Each issue displays the stage, the error message, and if possible, a link to the line number in the log where the error occurred.Links to line numbers are only available if the first Pipeline step that encounters the error emits log output. -
 Test Insights: View a summary of test results and a list of test failures, which includes the stage name and a link to the failed test. You can also search for test and test class names, sort test failures by name or duration, and access the failed test results.
The JUnit plugin must be installed to the controller to view and access the Test Insights panel. -
 Build Failure Analyzer: View a list of identified problems that are found after a Build Failure Analyzer scan, including the name, description, and categories configured using the Build Failure Analyzer plugin, with the related lines highlighted in the log.
-
Select Scan with Build Failure Analyzer to scan failed builds.
-
Select Go to Build Failure Analyzer to view or modify existing failure causes or create new failure causes.
The Build Failure Analyzer plugin must be installed to the controller to view and access the Build Failure Analyzer panel.
-
-
 Build artifacts: Directly access your build artifacts, with a link to the build artifacts report.
Build artifacts are the files stored in CloudBees CI when using Pipeline steps such as
Build artifacts: Directly access your build artifacts, with a link to the build artifacts report.
Build artifacts are the files stored in CloudBees CI when using Pipeline steps such as archiveArtifacts, and typically include distribution packages,WARfiles, reports, and log files. -
 Related builds: View the builds related to your current build. This includes:
-
Build causes: Additional information about what triggered the build (for example, an SCM commit, a user manually running the build, an upstream build, or a previous build being replayed or rebuilt).
-
Triggered in this build: Downstream builds that the current build triggered.
If a downstream build is no longer available (for example, due to configured build retention policies), it is not accessible in CloudBees Pipeline Explorer.
-
-
-
Optionally, replay, rebuild, or abort a build.
-
Select Replay to navigate to the Replay page, modify the Pipeline script, and then rerun the Pipeline. This is useful for rapid iteration, prototyping, and troubleshooting Pipelines.
-
Select Rebuild to run a new Pipeline build using the latest code changes.
-
Select Abort to stop an in-progress build.
-
Search the logs
CloudBees Pipeline Explorer also provides the following built-in search functionality, to speed up the troubleshooting process:
Search the entire log file
To search the entire log file, use the search bar at the top right of CloudBees Pipeline Explorer; the search feature is case-insensitive. If the search takes longer than the timeout of one minute, the request is canceled with a warning message. If there is a search on a log or filter that is too large, the search is blocked.
|
For large log files (approximately 1 GB or more) or slow storage systems, searches may take several minutes to complete. Running multiple searches in parallel can significantly impact controller-wide performance. By default, CloudBees Pipeline Explorer does not allow you to search through more than 1 GB of log data at a time. Administrators can modify the default search log limit. |
Search a filtered log
You can also search a filtered stage log.
|
When searching filtered logs, CloudBees Pipeline Explorer first checks the log against the active filter. If you have configured the Log size limit when searching with a limit of 1 GB and you are searching a 10 GB log file, you cannot search the entire log file. However, if you apply a filter that only has 500 MB of logs, you can still search within the filtered logs. |
To search a filtered log:
-
Select
to open the Filter by tree view panel. -
To filter the log, either search for a stage or step name or select a stage or step in the tree view.
-
In the search bar at the top right of CloudBees Pipeline Explorer, enter a search term, select , and then press ENTER. The icon changes to
 , to indicate that you are searching filtered stage logs.
To search the entire log file, select
again; the default icon appearance is restored.