The CloudBees Prometheus Metrics plugin exposes basic metrics in Prometheus format. The CloudBees Prometheus Metrics plugin collects:
-
Basic system metrics, such as garbage collection, memory pools, class-loading, and thread counts.
-
Metrics collected by the Metrics plugin, which is installed by default in CloudBees CI on modern cloud platforms and CloudBees CI on traditional platforms.
| Other open source plugins can be safely installed to controllers to monitor a Jenkins-based instance. However, it is unsafe to install them in the operations center and is strongly discouraged. CloudBees recommends the CloudBees Prometheus Metrics plugin for the operations center. |
Installing and configuring the CloudBees Prometheus Metrics plugin
-
Ensure you are logged in to operations center as a user with the Administer permission.
-
Install the CloudBees Prometheus Metrics plugin. For more information, refer to Best practices for installing plugins on production instances.
Once installed, the Prometheus Metrics plugin can be configured to access and consume metrics from the instance.
-
From the operations center dashboard, in the left pane, select Manage Jenkins.
-
Select Configure System.
-
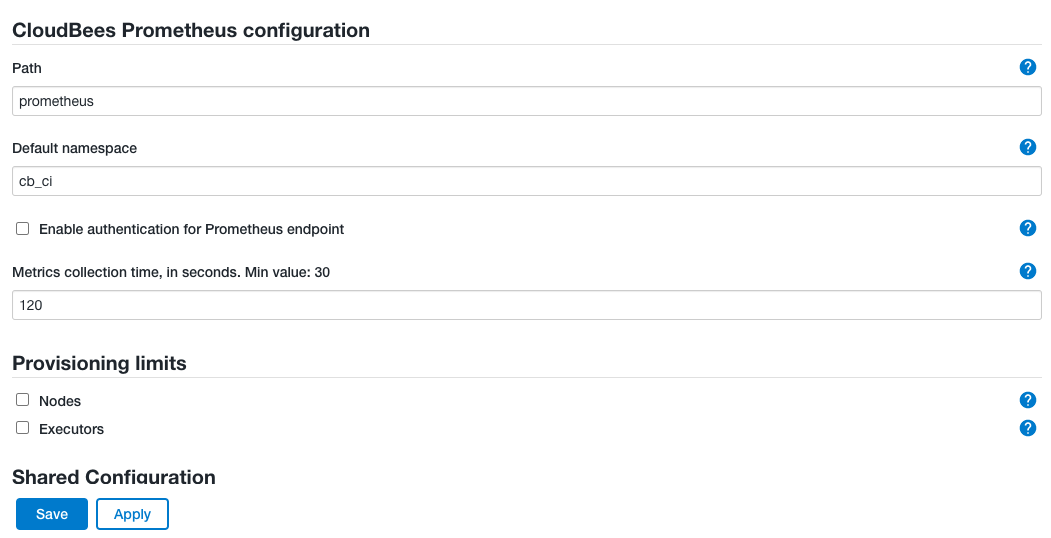
Scroll down to CloudBees Prometheus configuration and configure the plugin settings.
 Figure 1. Configure the Prometheus Metrics plugin
-
Path: The URL path to metrics exposed in Prometheus format. This path must be specified to prevent the metrics from being exposed in the instance root URL. If the path is not specified, the default prometheus path is used.
If the default prometheus path is used, the metrics can be read from ROOT_URL/prometheus. However, more complex paths are supported. For example, if compose/path/to/metrics is the specified path, it can be read from ROOT_URL/compose/path/to/metrics. -
Default namespace: The default namespace used by some basic metrics exposed in Prometheus format. Generally, the default namespace is ignored by Prometheus, so CloudBees recommends you leave this at the default cb_ci value.
-
Enable authentication for Prometheus endpoint: Enables authentication for the Prometheus endpoint.
While it is possible to enforce authentication by selecting this field, it is not recommended. If this option is selected, the user accessing the endpoint (a logged user, or an anonymous user) must be granted the Metrics.VIEW permission. -
Metrics collection time, in seconds: The amount of time, in seconds, that must elapse for the metrics to be collected again. The metrics collection period must be a valid positive value, or the default metrics collection time of 120 seconds is used.
Any change in this value is loaded after the next scheduled collection or after a restart, whichever occurs first.
-
-
Select Save.