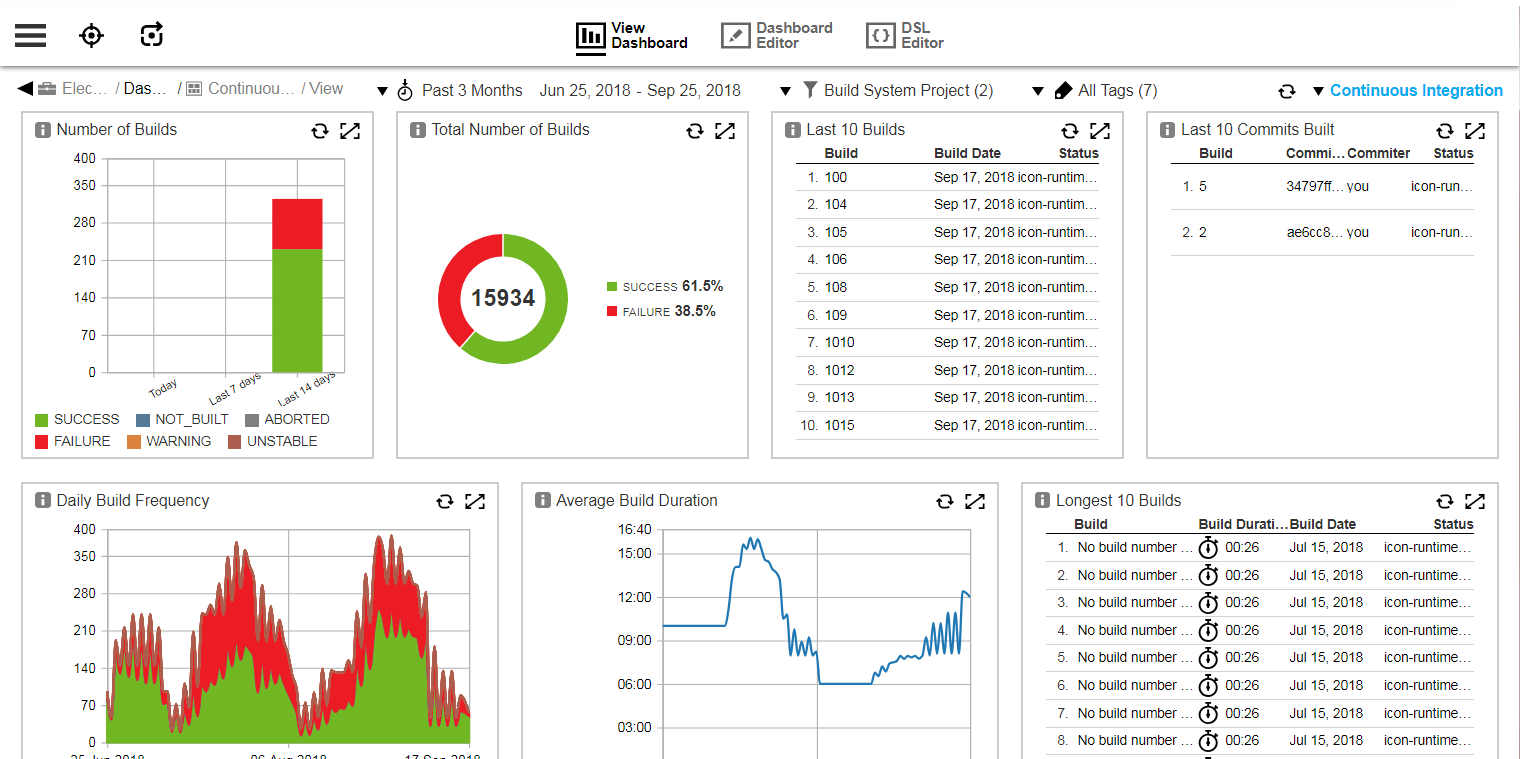
The Continuous Integration dashboard displays key metrics for builds that can be used to gain insight into your organization’s build throughput and identify any potential build issues. The Continuous Integration dashboard provides indicators to measure agility of development.

Filters
This dashboard provides menus that let you filter by time period, project, and tags:

Time filter
Filters the builds based on the selected time range. The time filter applies to the build end time, which is set as the timestamp field value for the build records.
By default, the build metrics for the past three months appear. You can change the date range by selecting the menu on the top of the dashboard. In addition to the preset ranges such as Current Week and Past 15 days, you can also specify a custom date range by using the Custom… option.
Build system project filter
Filters the builds based on the project that the builds are associated with in the native build system using the projectName field. For builds, this is the project name of the build procedure, while for Jenkins, this is the Jenkins project name.
Build metrics for all build system projects display by default. You can choose specific build system projects by selecting the menu for projects at the top of the dashboard. The build metrics are filtered based on those projects.
Tags filter
Filters the builds based on the tags marked on the builds. These are the tags set on the build job and tags set on the build procedure, which are passed on to the build job.
Build metrics for all builds display by default. You can choose specific builds marked with specific tags by selecting the menu for tags at the top of the dashboard. The build metrics are filtered based on those tags.
Examples are deployment tags such as prod or UAT and feature tags from JIRA such as webapp. For more information, refer to Create object tags.
Visualizations
Number of Builds |
This chart provides the number of builds that have occurred today, during the last seven days, and during the last 14 days. These durations are fixed and are therefore unaffected by the time filter. |
Total Number of Builds |
This chart provides the total number of builds that have occurred and shows a breakdown by different build outcomes. These are the possible outcomes: |
Last 10 Builds |
This report lists the last ten builds. You can drill down into a build by selecting that build. This opens your CI system, such as Jenkins or CloudBees CD/RO. |
Last 10 Commits Built |
This chart shows the last ten code commits that have been built. You can drill down into a build by selecting that build to open the build details page in your CI system, such as Jenkins or CloudBees CD/RO. |
Daily Build Frequency |
This chart shows the number of builds that have occurred over time. The duration depends on the time range selected using the Time Reference filter at the top of the dashboard. |
Average Build Duration |
This chart shows the average build duration over time. The duration depends on the time range selected using the Time Reference filter at the top of the dashboard. |
Longest 10 Builds |
This report lists the ten longest builds that have occurred. The duration depends on the time range selected using the Time Reference filter at the top of the dashboard. You can drill down into a build by selecting that build to open the build details page in your CI system, such as Jenkins or CloudBees CD/RO. |
View Jenkins data in the dashboard
Configure the Jenkins integration for the Analytics server to collect build and quality data and view it on the Continuous Integration dashboard.
Prerequisite requirements
Before starting the integration setup, consider the following:
-
Identify the release to be used for this integration.
-
The Jenkins plugin must already be installed. Refer to Jenkins plugin for more information.
-
A job that performs continuous integration for the release must already be configured in Jenkins.
Follow the instructions below to create the connection from Jenkins to CloudBees CD/RO:
-
Navigate to a releases: .
-
Select a release. The Release editor window opens.
-
Select .
-
Select
 . The Command Center Setup opens.
 -
In the Command Center Setup window, locate the Continuous Integration type.
-
Select the Add. The Command Center Setup, Data Source Configuration window opens.
-
Source: Select the drop-down to display the list of configured Jenkins sources. Select the source of data for this dashboard.
-
Data Source Name: This field is autopopulated based upon the selection in the Source field.
-
Configuration Name: Select or add the configuration containing the Jenkins configuration in CloudBees CD/RO. For example, it could be a project that includes a plugin configuration for EC-Jenkins.
-
Jenkins Project: Enter the name of the Jenkins job that performs continuous integration for the release.
-
Is Multibranch Pipeline?: Select this checkbox if the Jenkins job includes a folder of pipeline jobs.
-
Starting Commit ID: If multibranch pipelines is selected, enter the initial commit ID of where the build process should start.
-
Test Results URL: Enter the relative URL to use to retrieve the test results.
-
Polling Frequency (in mintes): Enter the frequency for data retrieval from Jenkins.
-
Select OK to complete the configuration.
-
Select the X in the upper-left corner of the window to close the Command Center Setup window.
-
Select to open the Command center dashboard for the release.
Three widgets for the Jenkins build success rate should now display on the dashboard:
-
Build Success Rate
-
Successful Builds
-
Time to Build