The CloudBees Analytics Report editor lets you define a report based on criteria such as filters (search criteria), aggregations, and sorting. You create the query definition for a report by using the Report Editor.
These reports are based on Elasticsearch Query DSL and provide an interface to common Elasticsearch queries. The Report Editor includes an Advanced mode, which lets you edit the query DSL directly.
You can add, remove, or alter reporting filters or parameters for command center dashboards in the same manner as the standard types of dashboards. You cannot add, remove, or alter reporting filters or parameters for the built-in Release Command Center dashboard. However, you can edit a custom copy of the Release Command Center dashboard, because a copy of the Release Command Center dashboard is created when you edit and save it for the first time.
You select from a list of available reports when you create a CloudBees Analytics dashboard widget.
The Reports list
To open the reports list, from the main menu select ; the Reports list opens.
The reports list shows all reports that are available in the selected project or projects. The list comprises reports included with CloudBees CD/RO, as well as any custom reports that you have created. By default, the reports are listed for all projects. You can filter this list by any combination of projects via the projects menu.
CloudBees CD/RO includes a variety of built-in reports. These reports can help you learn about the reporting functionality and how to create your own reports. You can also make copies to use as report templates. These reports are in the CloudBees project and are not editable.
Select Views of a specific report for quick access to its Report editor and Tabular preview.
Creating a custom report
To create a report:
-
From within the reports list, select New.
-
Select . The CloudBees Analytics Report Editor displays.
This shows the standard editing mode, which is the default mode when you open the report editor. The editor lets you define any number of search criteria and aggregation types for creating custom reports.
| Make sure you have a good understanding how your report queries, data, and resulting response can affect system performance when report is run. |
Editing a report query
-
Use the report editor to create your report’s query. As you create the report, the Code View window shows a read-only view of the underlying DSL code for your query. This view changes dynamically as you modify the report.
-
Select Save on the right side of the page to save your changes: you must save the report if you want to subsequently edit the underlying DSL code directly.
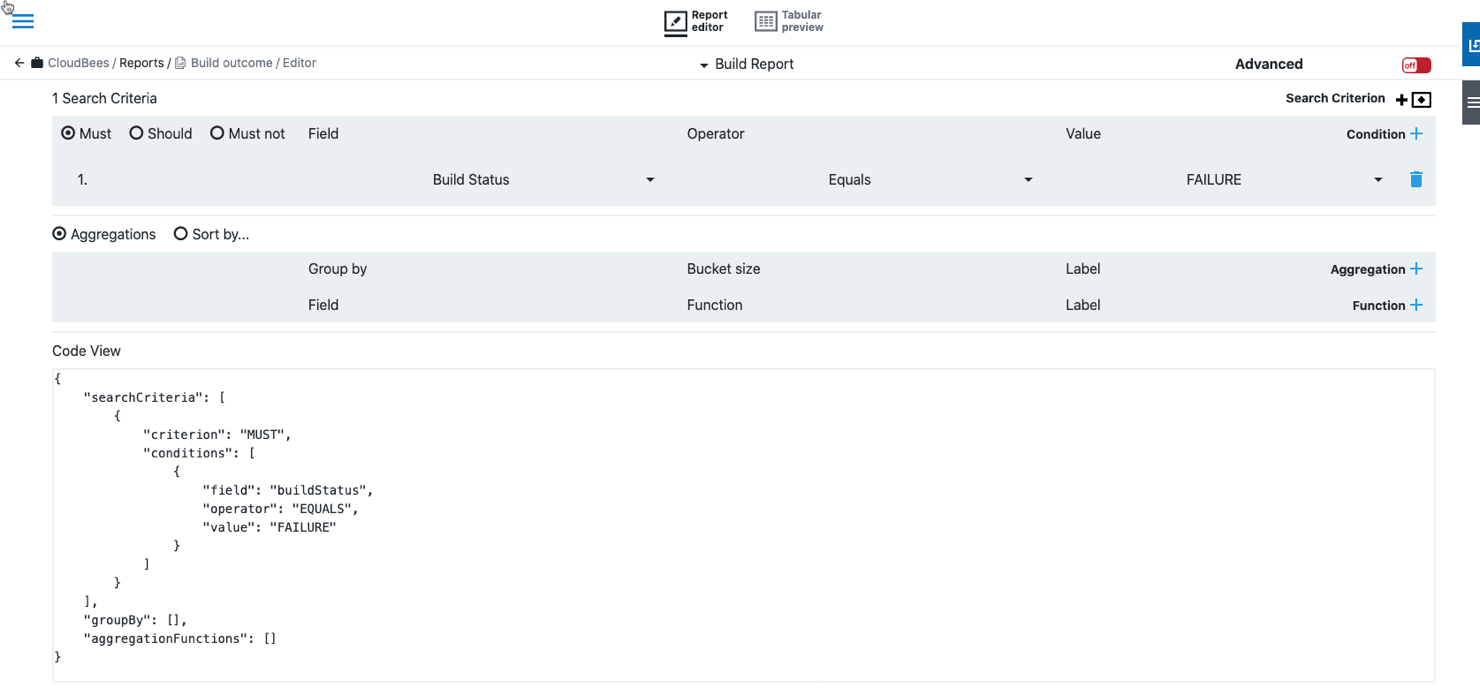
Report search criteria
The list of search criteria determines the matching for specific object attribute values. You can add one or more search criteria by selecting the Search Criterion button in the report editor.
Object attribute fields
The Fields menu displays the list of available object attributes. Examples are Build Name, Build Status, Controller URL, and so on.
If the pipeline run, job, or process has output parameters, they display in the Fields menu and can be used in the report definition just like any other field. For example, for an output parameter named test, Output Parameter: test is available from the menu. If a desired output parameter is not available in this list, refer to Sending Additional Data for Pipeline Runs, Deployments, and Jobs to the CloudBees Analytics server for instructions.
| Object attribute fields are only available with the CloudBees CD/RO capability. |
Search operators
The following search operators are available:
| Operator | Applicable Attribute Data Types |
|---|---|
Equals |
All |
Exists |
All |
Not Exists |
All |
Greater than |
All data types except BOOLEAN |
Greater than or Equals |
All data types except BOOLEAN |
Less than |
All data types except BOOLEAN |
Less than or Equals |
All data types except BOOLEAN |
Between |
All data types except BOOLEAN |
Aggregations and sorting
Aggregations and sorting determine the grouping or order of the query results, respectively. You can choose either aggregation or sorting, but not both.
Query result aggregations
You can add aggregations by selecting the Add Aggregation button.
You can add functions by selecting the Add Function button. The following functions are available:
| Function | Applicable for Attribute Types |
|---|---|
Average |
NUMERIC, PERCENT |
Count |
All |
Distinct Count |
All |
Max |
NUMERIC, PERCENT, DATE, DATETIME |
Min |
NUMERIC, PERCENT, DATE, DATETIME |
Sum |
NUMERIC, PERCENT |
Query result sorting
As an alternative to aggregating the query results, you can sort them. For example:
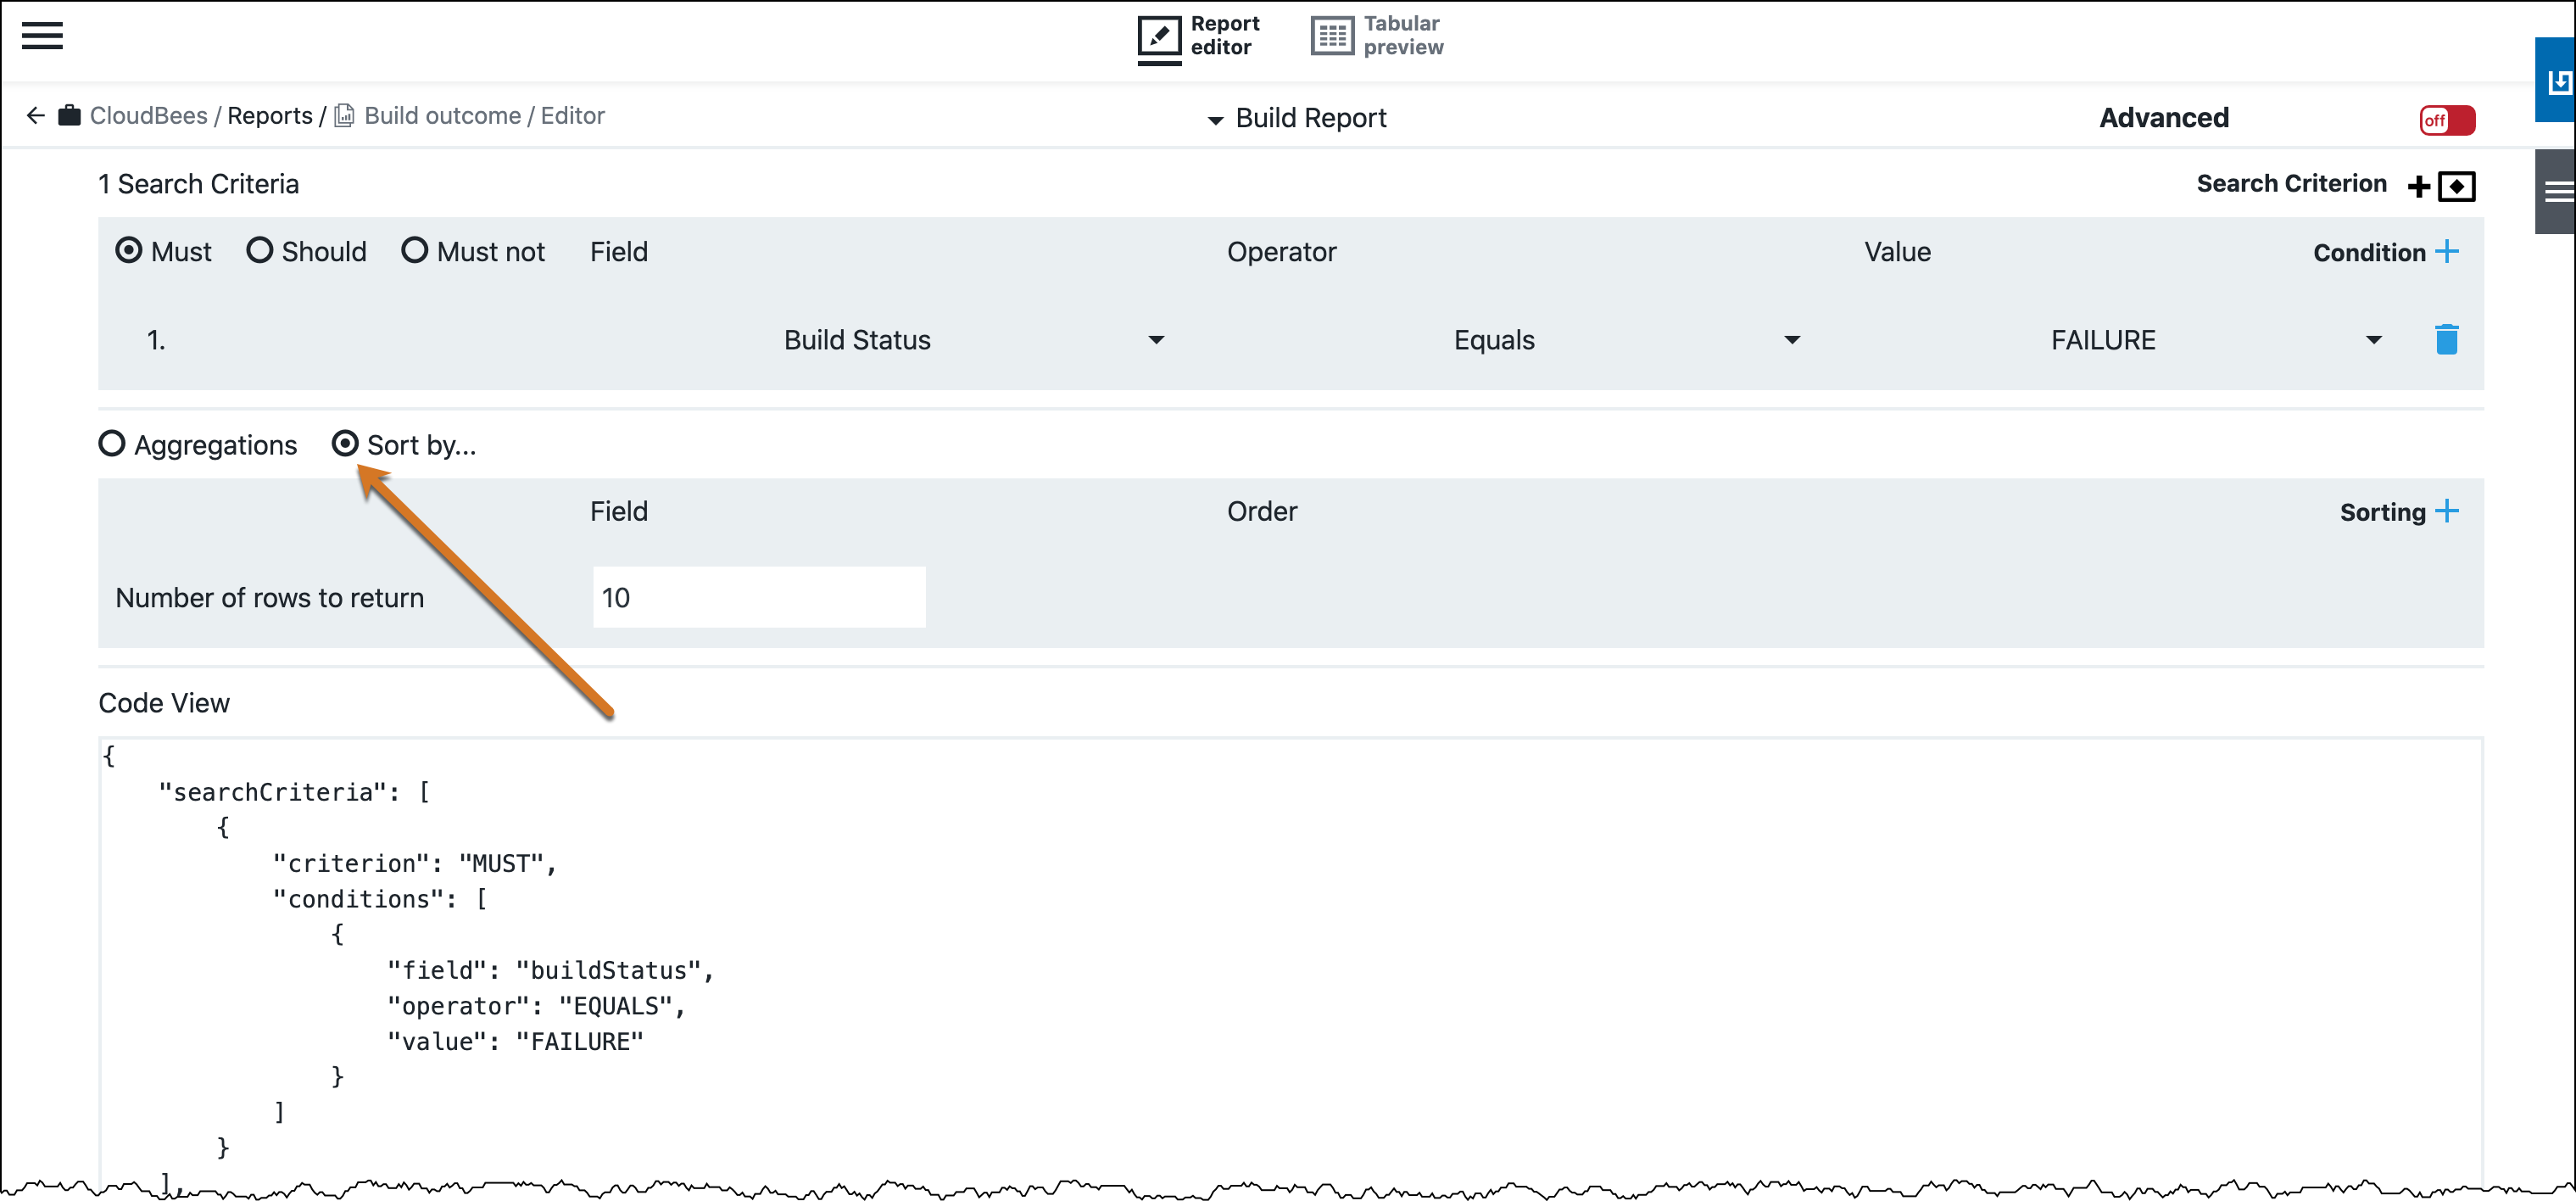
You can sort the query results by a specific object attribute field in ascending or descending order. You can specify the number of rows for the query to return. To add a secondary sorting field, select Sorting.
Editing advanced mode report queries
Advanced mode shows a view of the underlying query DSL code. You enter and exit advanced mode by selecting the Advanced slider button in the upper right corner of the UI. You can now edit the query DSL code directly.
Note that editing the query DSL code makes it incompatible with Standard mode in the Report Editor. The following warning is always present in Advanced mode as a reminder:
| If you make modifications in Advanced Mode and save them, they do not carry over to the Report editor. |
For details about Elasticsearch Query DSL, refer to Elastic Stack and Product Documentation.
Using tabular preview
To check your query results, select Tabular preview at the top of the page. This view shows the first 20 rows of output so that you can test your report criteria. The tabular preview provides a preview of the report data from the CloudBees Analytics server.
The tables in the following examples describe some of the columns that might be returned based on the report that you have defined.
Example report: Build outcome
This report is included in CloudBees Analytics.
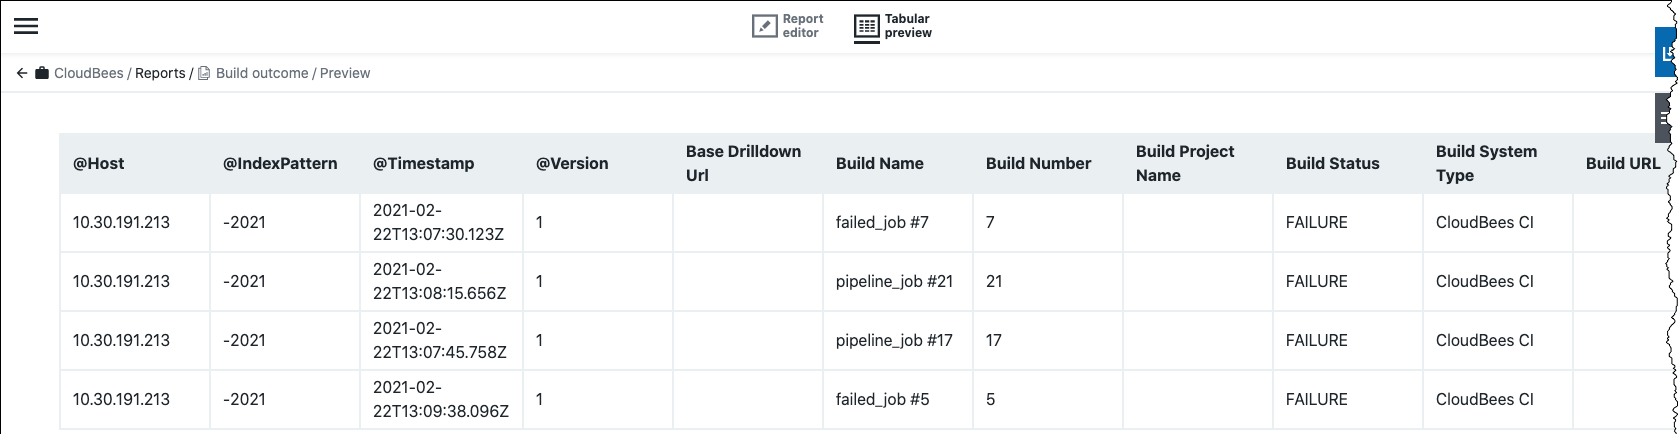
The following table shows some date-based fields stored in Elasticsearch for this report and their corresponding formatted fields.
| Column | Description |
|---|---|
Timestamp |
Time of the build. |
Build Number |
Unique build number or identifier assigned to the build by CloudBees CI. |
Build System Type |
Name of the continuous integration system. For example, |
Sending additional data
The data that CloudBees CD/RO manages for runtime objects (pipelines, jobs, and deployments) and sends automatically to the CloudBees Analytics server is predetermined based on the specific object type. However, adding output parameters to the runtime objects of your choice in the CloudBees CD/RO Deploy UI lets you capture their data so that it is sent to CloudBees Analytics in the same payload that is normally sent by CloudBees CD/RO for these objects. In this way, output parameters provide an extensible mechanism for adding fields for these objects to a report.
Adding an output parameter to a report is much simpler than adding an input parameter, because you actually create the output parameter outside the Report Editor. To send additional data from pipeline runs, deployments, and jobs to the CloudBees Analytics server:
Output parameter prerequisites
-
Declare the output parameter on the desired runtime object in the Flow UI at the object level.
For details, refer to Declaring an output parameter.
-
Set the output parameter’s value in some manner on the object.
For details, refer to Creating or editing an output parameter.
The menu display name for any output parameter that is available for use in reports is Output Parameter: < parameter_name >. For example, for an output parameter created in the CloudBees CD/RO UI named
test, the menu display name in the Report Editor is Output Parameter: test.Output parameters are sent as regular fields in the payload but are prefixed with
ec_param_for identification purposes. For example, for an output parameter namedtest, the value is saved asec_param_testin the CloudBees Analytics server: -
Run the pipeline, job, or deployment.
For details, refer to Running Pipelines.
After the first runtime of that object, the parameter is pushed to the CloudBees Analytics server and is then available to add to a report.
Creating a custom report by copying an existing report
Copying another report lets you create a custom report more quickly. You can copy your custom reports as well as reports that are included with CloudBees CD/RO. You cannot edit reports that are included with CloudBees CD/RO, but copying them provides a substitute for customizing their functionality while preserving them to use as templates for future custom reports.
-
From within the Reports list, select New.
-
Select . The From Report dialog displays.
-
Select the name of the report that you want to copy.
You can narrow down the list of projects by selecting one or more projects from the projects menu or by entering search terms into the Search field. The New Report dialog appears.
-
Enter the new report name into the dialog, and then select the project that will contain the report.
By default, new reports are added to the CloudBees project. You can enter a report description into the comments field if needed.
-
Select OK to save your changes. The new report displays in the Report editor.
-
Customize the new report’s query as described in Report search criteria.
Editing a custom report
Any custom report is editable. To edit a report:
-
Open the reports list as described in the reports list.
-
Do one of the following to open the Report Editor:
-
Select the report.
-
Select the corresponding view selector button for the report, and then select Report editor.
-
-
Edit the report as described in Editing a custom report.
Input parameters for reports
Parameters are free-form input values that can be fed to a dashboard or report to filter the data based on the parameter value. For example, the Release Command Center dashboard shows metrics and trends over the last 10 days.
You might want to view the trend over a different time interval such as the last month or last two weeks based on the duration of your releases. In this case, parameters let you define the time interval as a parameter that can be used by the dashboard or report viewer to change the time interval for viewing the Release Command Center metrics.
For details about how to add input parameters, refer to Parameters - Adding Parameters.