This example shows how to deploy the application multiple times with different runtime conditions.
First run
In the applications list, select ![]() and then select New Run to to configure the runtime settings.
and then select New Run to to configure the runtime settings.
-
In the Select Process drop-down, select the process where deployment starts.
-
In the Select Environment field, select the environment.
-
You can select a snapshot in the Select a Snapshot field if you have one or more.
-
For the first run, all artifacts are deployed.
-
Smart Deploy and Stage Artifacts are enabled.
Click OK to start the application run.
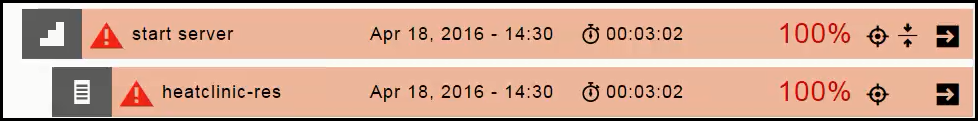
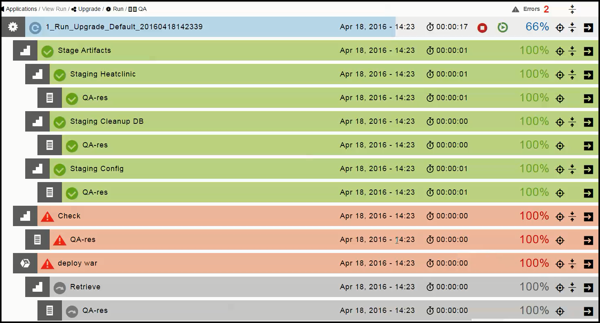
The Application Deployments list shows the progress of the application run:
-
The blue steps are running (in progress).
-
The green steps were completed successfully.
-
The red steps failed.
-
The gray steps are skipped.
Select a deployment to open the details page where you can begin the troubleshoot the step.
Subsequent runs
After the first application run, you can deploy the Run process to another environment with other deployment options.
- Based on the last run
Select Run and then Last Run opens the dialog box where you can set the runtime settings. It displays the runtime settings from the previous. You can deploy the application using the same settings as the previous run or you can modify one or more them for the current run.
- Based on schedules
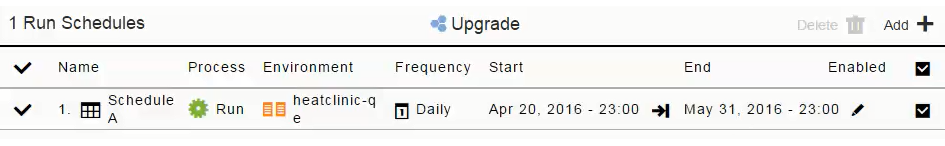
Select Run and then Schedule opens the list of schedules for the application. If there are no schedules, click There are no Run Schedules to add one.
-
Select Create new to create a new schedule, and then enter the schedule details .
-
Select from Previous Runs to create a schedule based on a previous application run.
A list of the last five application runs appears. Select an application run, and then enter the schedule details.
The dialog box where you can set the runtime settings appears. You can also modify the runtime settings at this time. Click OK. A configuration message is displayed with the deployment run time.
When you view the list of schedules for the application again, the schedule that you created appears in the list.
Runtime settings
-
Select
 to open the list of artifacts and containers that can be deployed in the application process. Artifacts are grouped by application tier. You can enable or disable an artifact within a tier or the entire tier itself as part of a deployment.
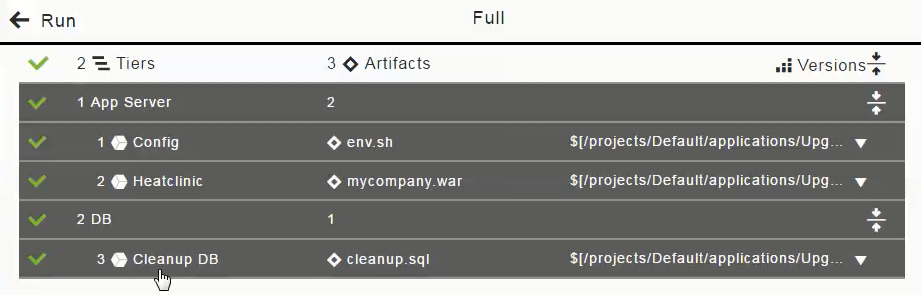
-
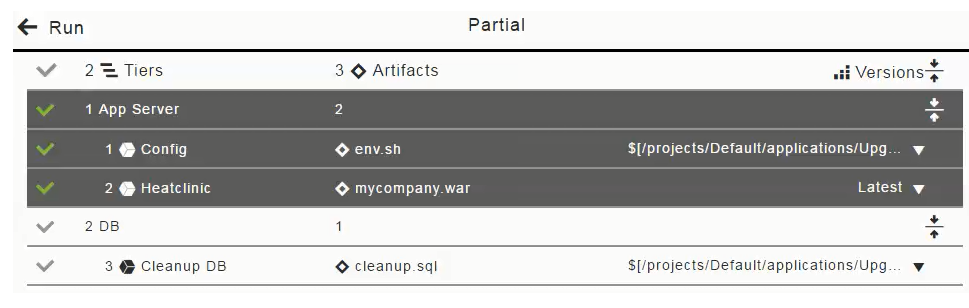
If you only want to deploy the cleanup.sql artifact, clear the Config and Heatclinic components in the 1 App Server column that are based on the env.sh and mycompany.war artifacts, and then select OK.
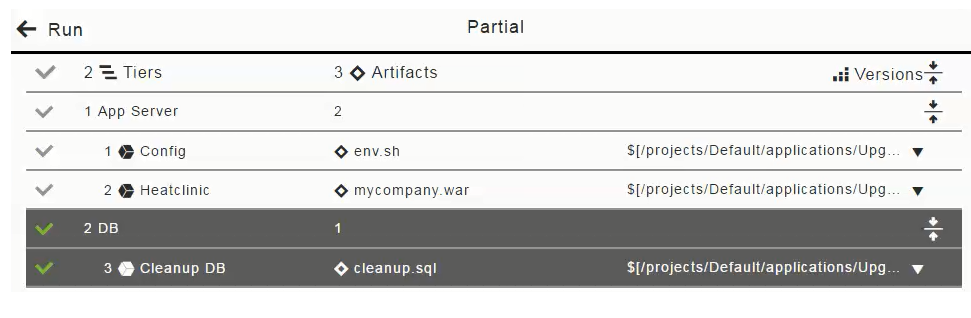
The Artifacts field now looks like this for a partial run:

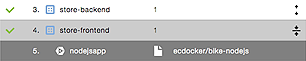
With microservices and containers, you can enable or disable a service. You cannot, however, disable an individual container within a service.
-
In the list of artifacts to be deployed in the application process, select the 2 DB row to clear the Cleanup DB component that is based on the cleanup.sql artifact, select the latest version of the mycompany.war artifact, and then select OK.
The Artifacts field now looks like this for the partial run:

-
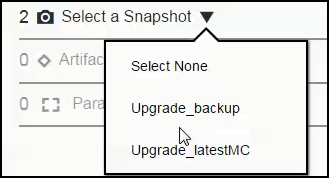
Snapshot with partial deploy and with smart deploy and artifact staging are enabled. In the Select a Snapshot field, click the down arrow and select the Upgrade_latestMC snapshot.
-
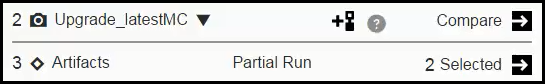
In the list of artifacts to be deployed in the application process, click in the "1 Config" row to deselect (disable the selection of) the Config component (based on the
env.shartifact) and click OK.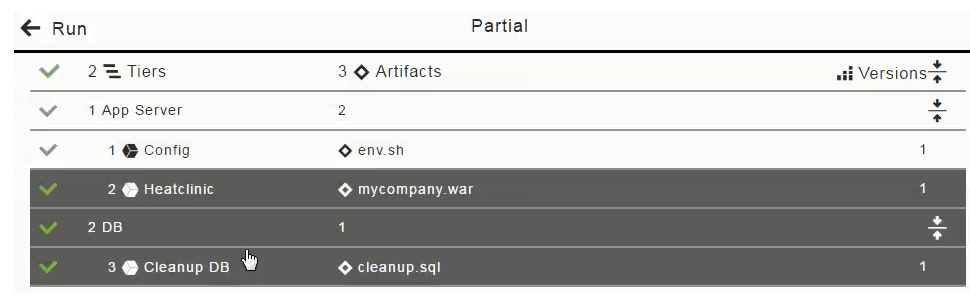
-
The Select a Snapshot and Artifacts fields now look like this for the partial run:
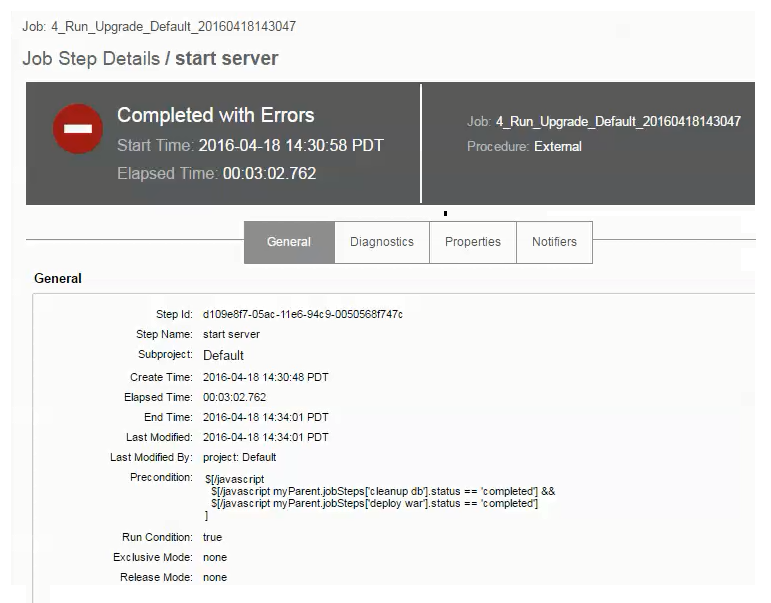
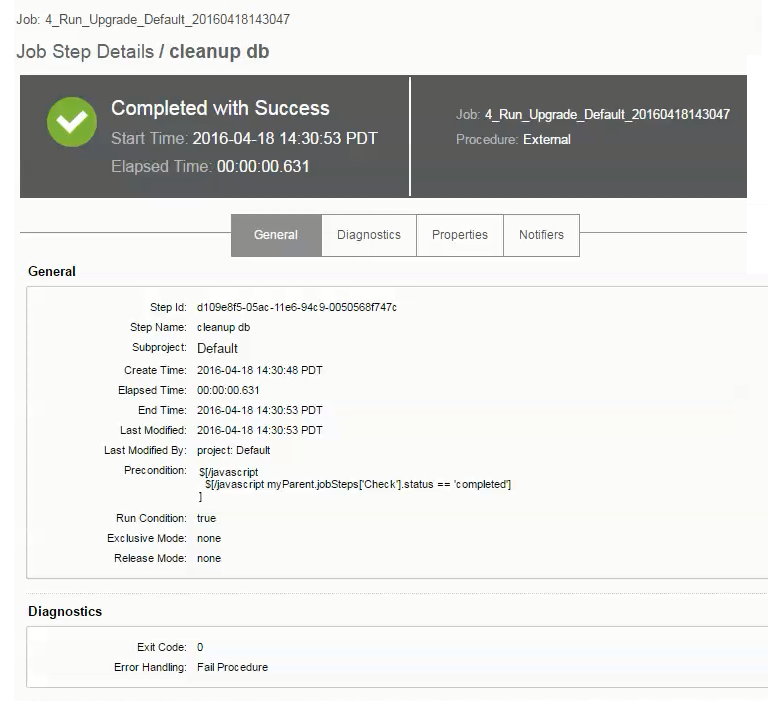
Viewing the real-time progress of deployments
This example shows the job details for a specific step. Select ![]() in the Cleanup DB step to open the Job Details page:
in the Cleanup DB step to open the Job Details page:
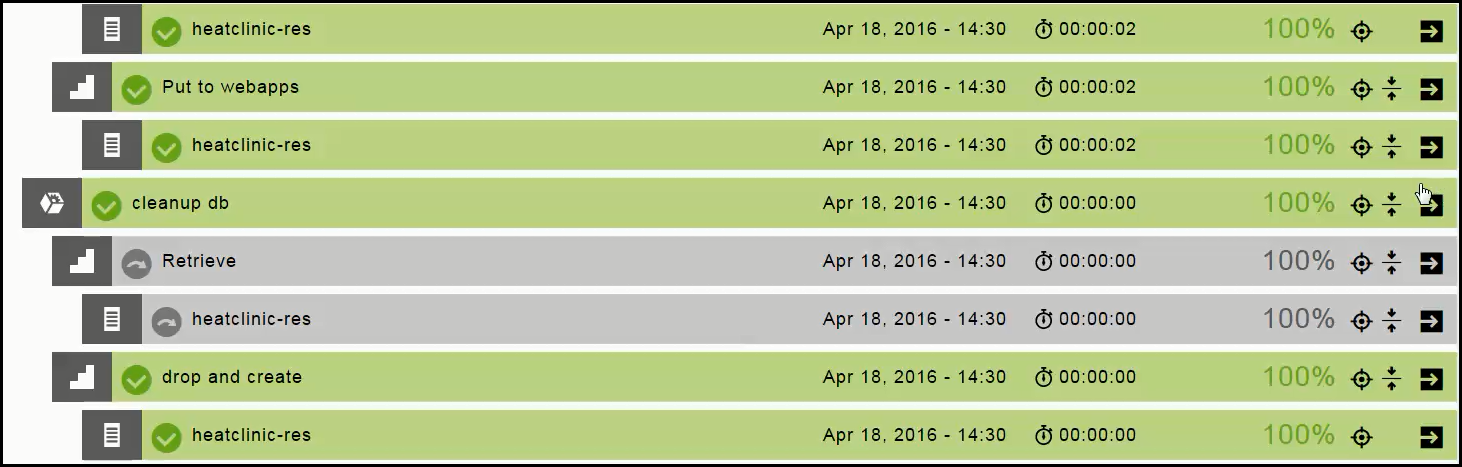
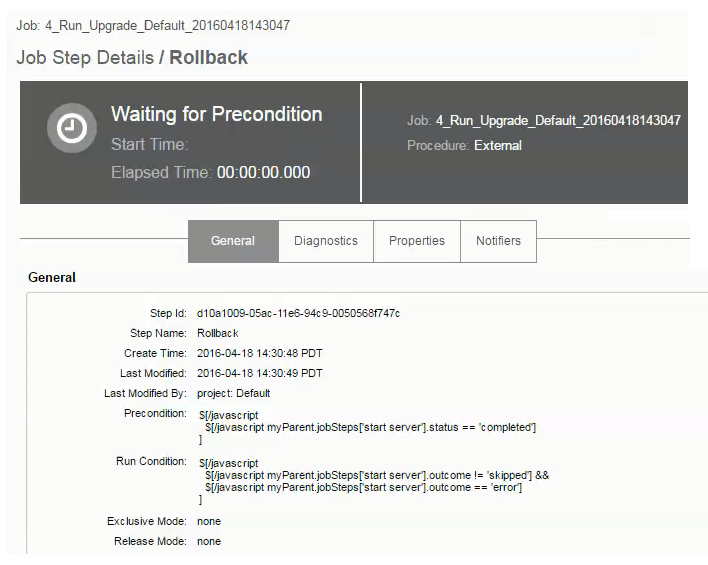
This example shows that the rollback step has not run yet:

Select ![]() in the rollback step to open the Job Details page, showing that the status is Waiting for Precondition. This step does not run until the precondition is met.
in the rollback step to open the Job Details page, showing that the status is Waiting for Precondition. This step does not run until the precondition is met.