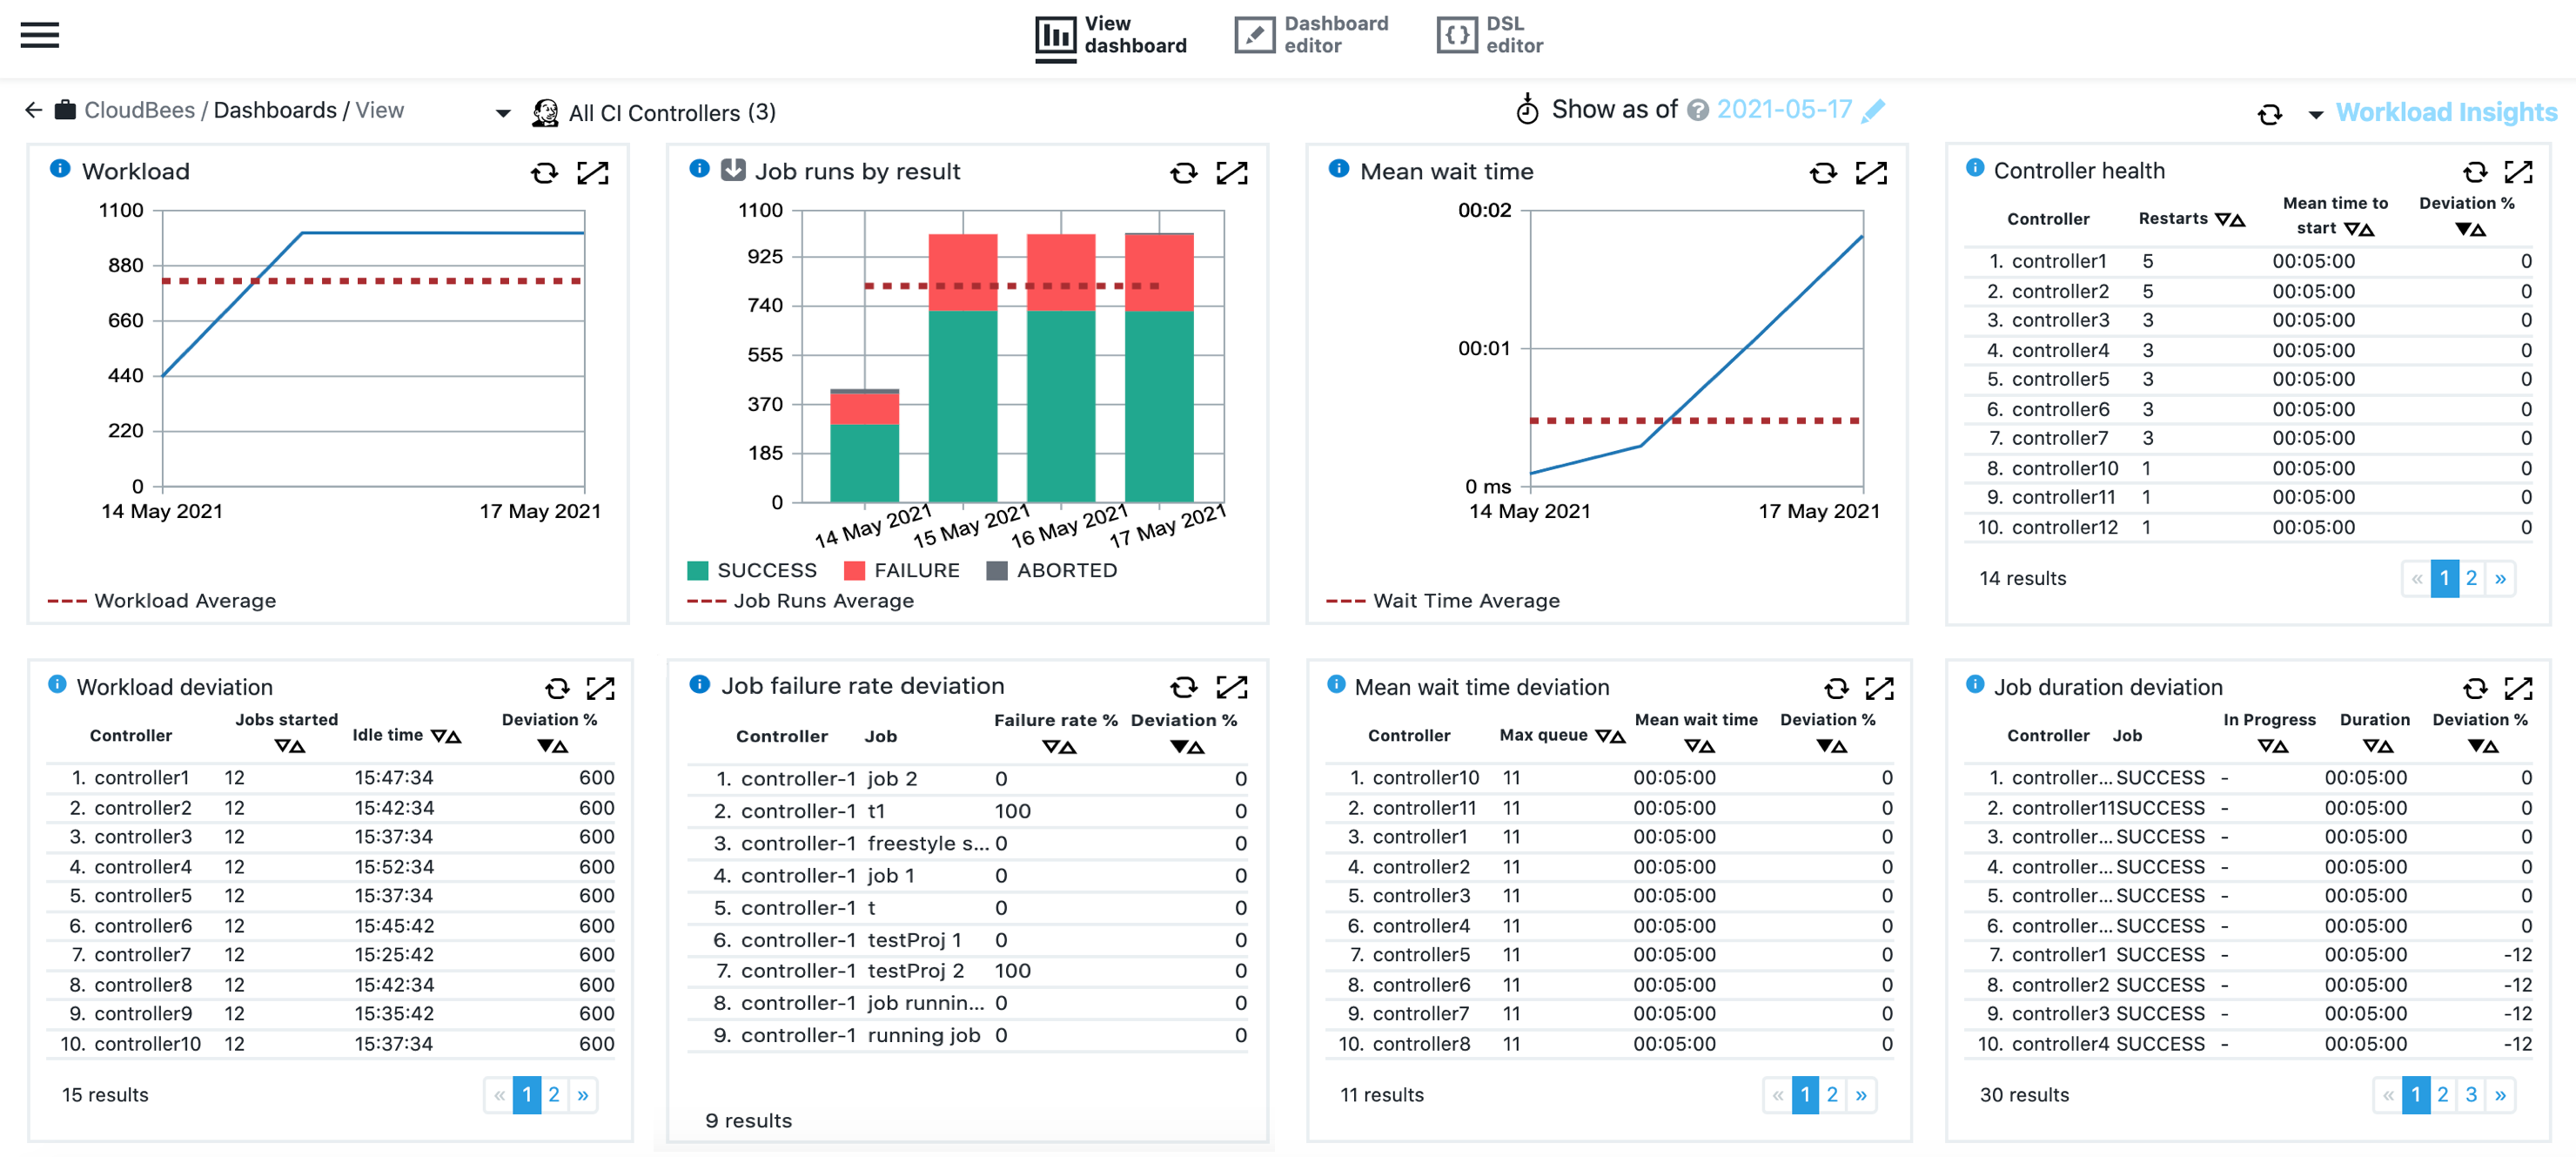
The Workload Insights dashboard displays key metrics in order to gain insight into your organization’s build throughput and CI system resources. This dashboard provides insight in the following:
-
Underlying problems in controller health.
-
Optimization opportunities in controller jobs.
-
Under- or over-utilization patterns within the current infrastructure.
This dashboard directly helps an organization’s infrastructure teams, developers, and engineering managers who are involved in managing their CloudBees CI instance to ensure their controllers and pipelines are operating efficiently.
|
It is necessary to wait at least 24 hours, and up to one week, before receiving sufficient data to detect any deviation in the provided metrics. During this waiting period, a message is posted to the Workload Insights dashboard informing that it is awaiting data. If after 24 hours, you are not receiving sufficient data, check your CI connection. Refer to Configuring the CloudBees Analytics server. Optionally, it is possible force the last week of data, but this is not recommended for controllers with a large number of jobs. |
Accessing Workload Insights
Follow these steps to access Workload Insights:
-
Select Analytics from the CloudBees navigation. The analytics dashboard list displays. Dashboards in the list vary based on the CloudBees capabilities for which you have licenses.
If Analytics is not active from the CloudBees navigation, select Learn more for licensing information. -
Select Workload Insights from the list. The Workload Insights dashboard displays.
Tables on the dashboard list first ten records from the data set. Use up/down arrows on columns to sort records and pagination controls to view pages of data.
 Figure 1. Workload Insights dashboard
Filters
Control the set of data used in visualizations with these filters:
-
Controllers: Filters the insights based on the selected controller. By default, data for all configured controllers is used.
-
Parameters: Filters the insights based on the selected parameters. This is pre-populated with the parameter,
dashboardShowAsOfDat, that allows you to set the effective date for the metrics. The default is today’s date.
Visualizations
Workload
Line chart showing the number of builds started per day for the selected controllers during the week ending today (default) or ended by selected date. Dashed line denotes workload average for the week.
Job runs by result
Bar chart showing the number of builds per day for the week ending today (default) or ended by selected date. Dashed line denotes the 90% level of runs for the week. A bar represents three different results: * Success: green bar * Failure: red bar * Unstable/Aborted/Cycle: yellow bar
+ Additionally, the dashed line indicates the 90% level of runs.
Mean wait time
Line chart showing the mean time to wait for the selected controllers based on the selected period.
Controller health
A table showing controllers by the percent deviation of their mean time to start or restart a build during the week ending today (default) or ended by selected date. The mean time to restart a controller is the time from the controller start event until the first job after that event starts. When controllers fail, they automatically try to restart. With this list, you can identify problems with a specific controller and the builds related to it.
-
Controller: Controller names.
-
Restarts: Number of restarts.
-
Mean time to start: The time from the controller start event until the first job after that event starts. High values indicate there is a potential problem with the controller plugins.
-
Deviation: Percent deviation of mean time to start for the selected day versus average mean time to start for the previous seven days.
Workload deviation
A table showing controllers by percent deviation of jobs started versus previous idle time for the given controller. This table helps to identify under or over utilization patterns within the current infrastructure.
-
Controller: Controller name.
-
Jobs started: Number of jobs completed on the controller.
-
Idle time: Amount of time without builds in progress.
-
Deviation: Percent deviation of number of jobs started for the selected date versus the average number of jobs started in the previous seven days.
Job failure rate deviation
A table showing jobs sorted by percent deviation of job failures versus the mean value of the entire history for the corresponding job. This table catches plugin or connectivity problems in any of the jobs.
-
Job: Job name in the format
<controller>/<job-name>(# <build number>). -
Failure rate: The current failure rate.
-
Deviation: Trend and percent deviation versus the mean value of the entire history for the corresponding job.
Mean wait time deviation
A table showing controllers sorted by the percent deviation of their mean waiting time in the selected period. This table helps to identify recent deterioration of the quality of your service.
-
Controller: Controller name.
-
Max queue: Current queue size.
-
Mean waiting time: Time since the job has been added in the queue until it starts to be executed.
-
Deviation: Trend and deviation in the mean waiting time versus the values in the selected period.
Job duration deviation
A table showing jobs sorted by the percent deviation in their duration. The list includes executed or in progress jobs for the selected period. This information helps to identify optimization opportunities for those builds that are increasing the mean waiting time, and it might be necessary to stop them.
-
Job: Job name in the format
<controller>/<job-name>(# <build number>). -
In progress: Whether the job is in progress.
-
Duration: Duration of the last run of the job.
-
Deviation: Trend and percent deviation of job build duration versus previous builds.