The Plugin Usage dashboard provides visibility for all plugins installed across the organization’s CloudBees CI enterprise.
Plugins are the heart and soul of CloudBees CI and, hence, tracking the usage of plugins is a fundamental need. Large DevOps teams typically need hundreds of plugins to support their CI pipelines and application development teams. CloudBees CI administrators need to maintain and periodically clean-up their inventory of plugins to keep their CloudBees CI instances lean. This is considered best practice to ensure system stability and optimal performance. Fewer plugins also typically means less upgrade risk and less verification effort needed during an upgrade.
Accessing plugin usage
Follow these steps to access plugin usage analytics:
-
Select Analytics from the CloudBees navigation. The dashboard list displays. Dashboards in the list vary based on CloudBees capabilities for which you have licenses.
If Analytics is not active from the CloudBees navigation, select Learn more for licensing information. -
Select Plugin Usage from the list. The Plugin Usage dashboard displays.
 Figure 1. Plugin Usage dashboard
Plugin Usage dashboard UI
Control the set of data used in visualizations with these filters |
|
1 |
Time range: The time range to use in analytic calculations. Defaults to past three months. |
2 |
Controller: The list of controllers to use in analytic calculations. By default, data for all configured controllers is used. |
3 |
Types of plugin usage: The types of plugins usage shown in the analytic calculations. By default, data for all types of plugin usage is considered.
|
4 |
Parameters: Time slice (days): Plugins not updated for more than the selected number of days are considered to be outdated in the metric calculations. Defaults to 180 days. |
View plugin usage details |
|
5 |
Donut graphs. Selecting a donut graph arc pops up detailed information for the particular arc. Use the Find box on the popup table to search for the controller of interest. 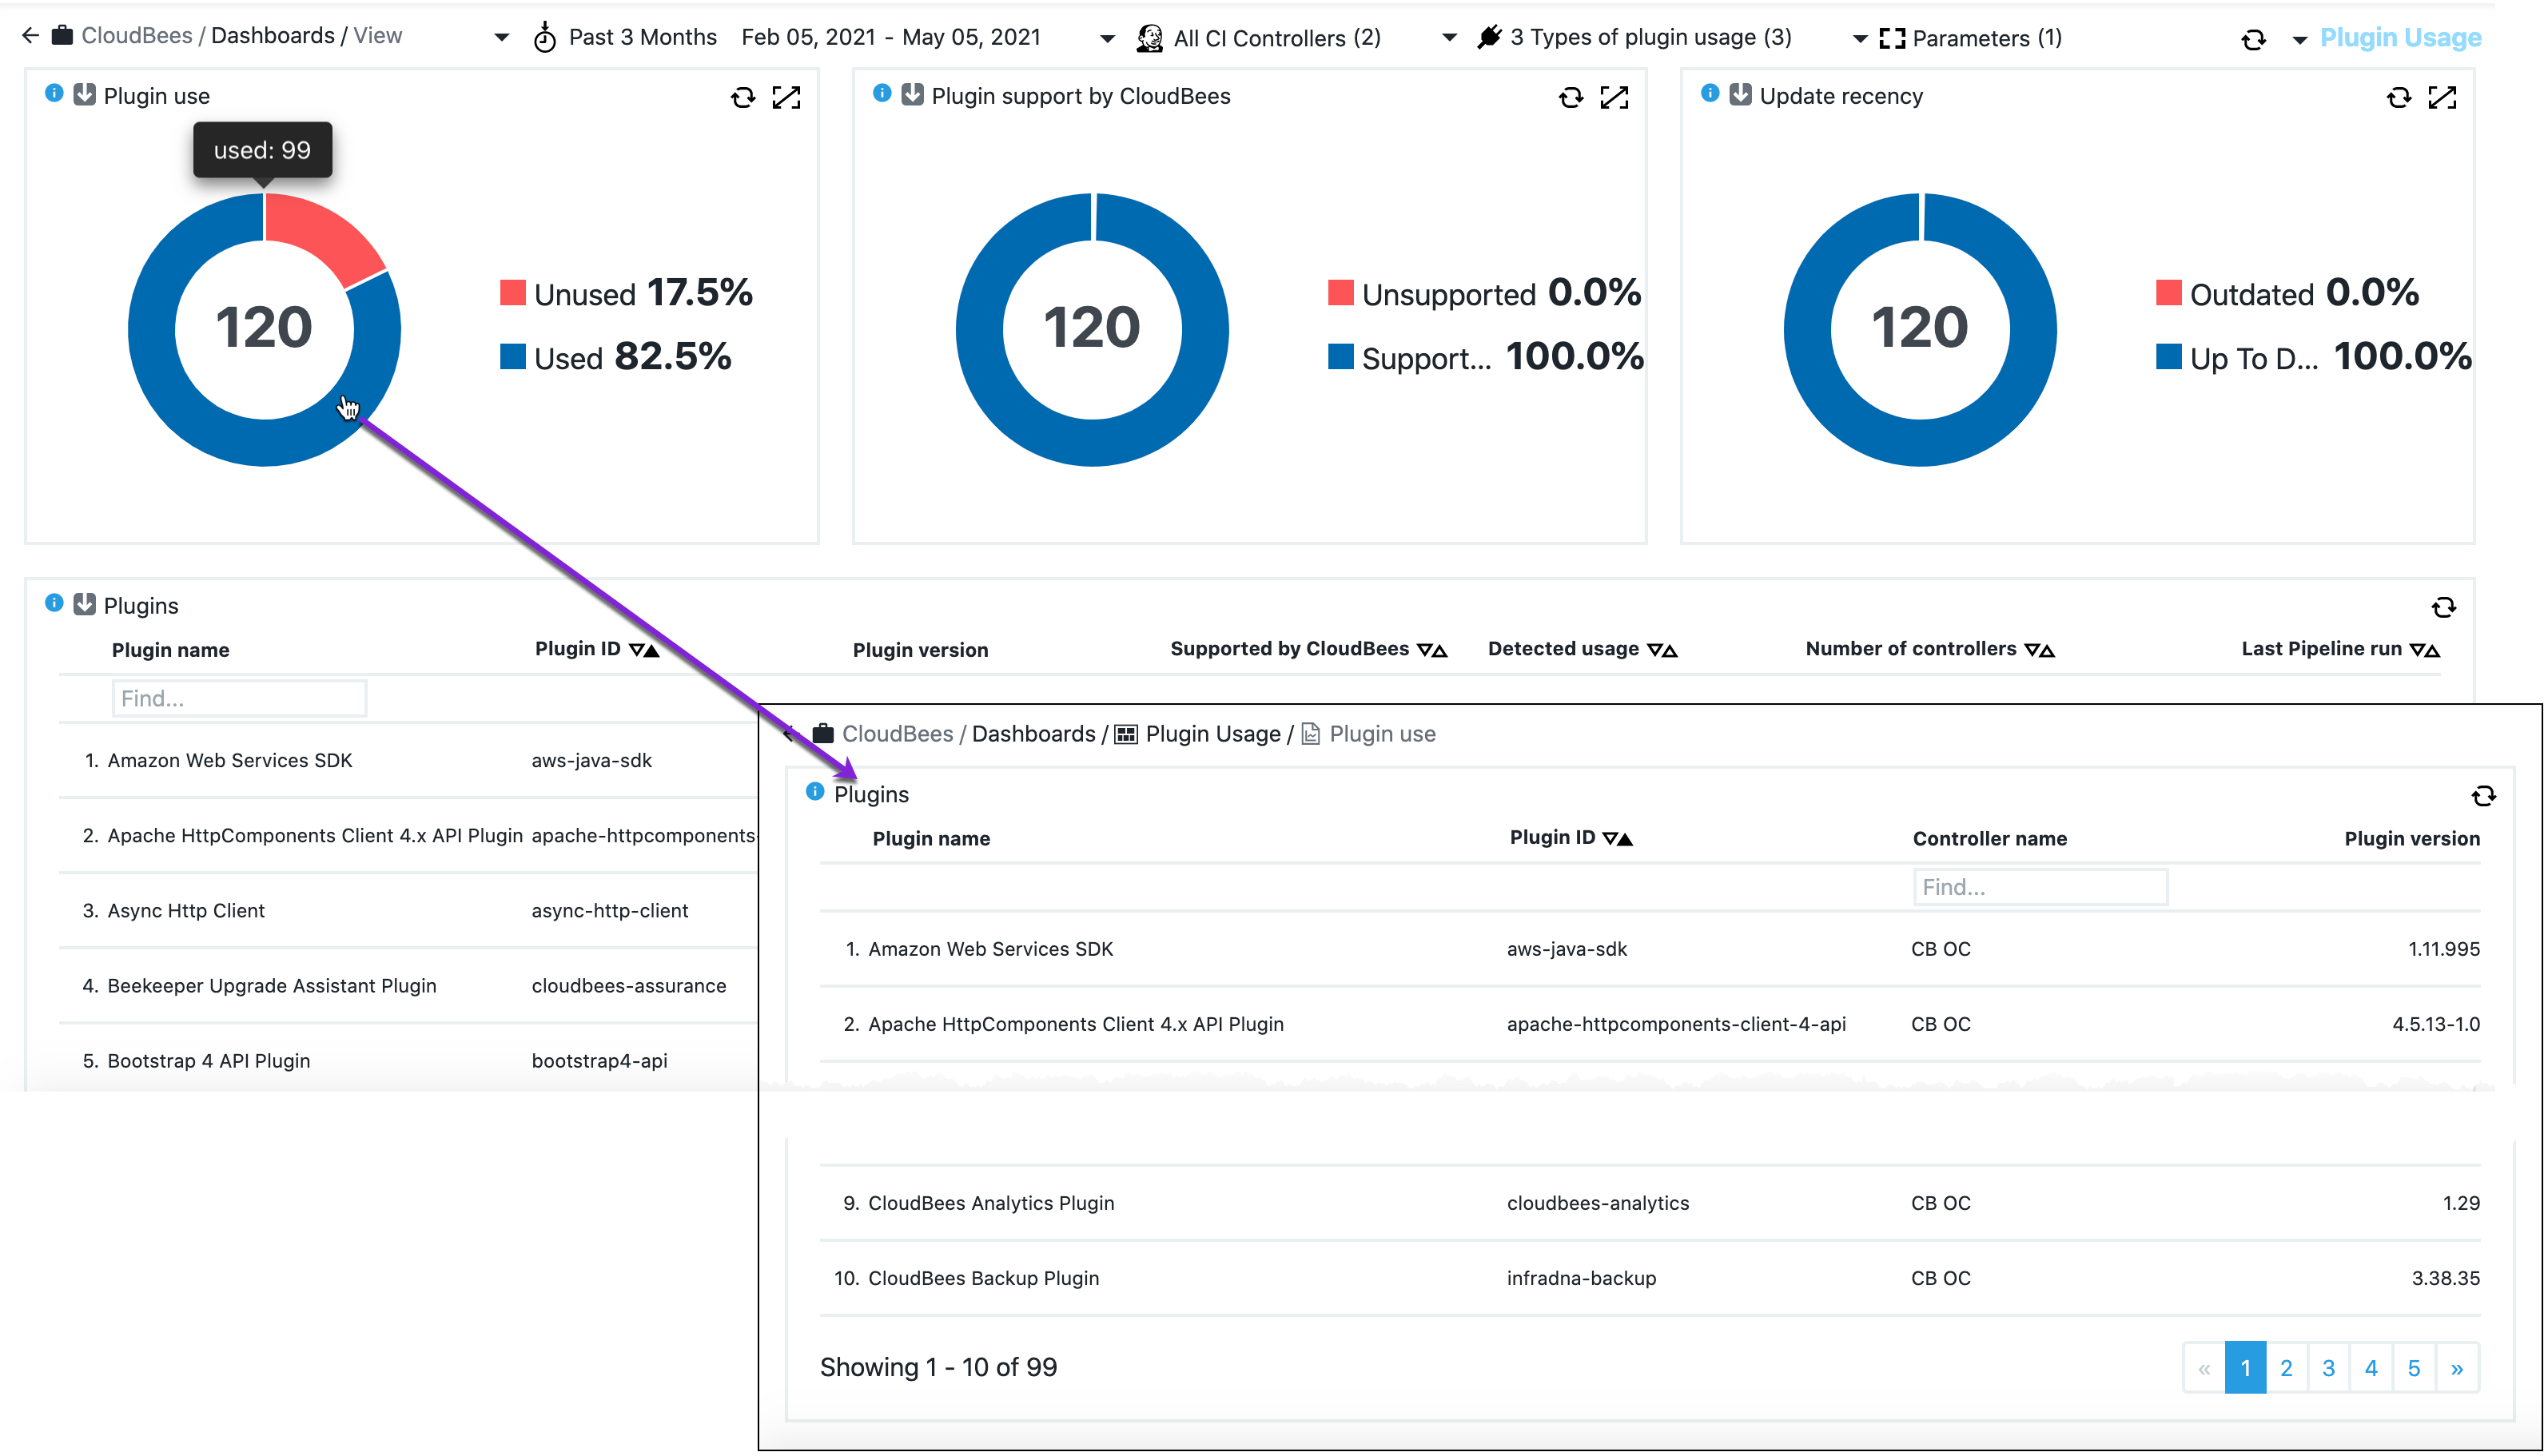
|
6 |
Search for a subset of plugins. Just start typing in the Find box and results are dynamically listed. Leading spaces are trimmed. This type of search box appears in various places throughout the various dashboard tables. |
7 |
Selecting a plugin name drills down to the plugins detail page. |
8 |
Pagination indicator lets you know the number of pages in the table; 10 entries are displayed per page. |
Visualizations
The visualizations on this dashboard correlate data based on filter settings.
-
Plugin use: The installed plugins by usage. Plugins that are not directly mentioned in any stored configurations, do not contribute anything to jobs, and are not dependencies of any other plugin, for example security plugins such as active-directory and LDAP, are reported as
Unused. -
Plugin support by CloudBees: A breakdown of the plugins usage by support. All tier 1 and tier 2 plugins are reported as
Supported. Refer to CloudBees plugin support policies for support details. -
Update recency: The installed plugins by update recency. If a plugin has not been updated in the last 180 days, it is reported as
Outdated. This value can be changed using the filter above. -
Plugins overview table: Tabulates installed plugins based on selected filters. Selectors at the top of each column allow you to sort by that column’s content.
Column name Description Plugin name
The plugin name.
Plugin ID
The plugin ID.
Plugin version
The plugin version. When there are different versions of the plugin installed on different controllers, the most recent version is shown in this column.
Supported by CloudBees
Whether the plugin is supported by CloudBees. Refer to CloudBees plugin support policies for support details.
Detected usage
The number of times the plugin has been used. Multiple occurrences of the same usage in the same object are counted just once. For example, if a plugin is used in a pipeline, then this contributes to one usage count in this column, regardless of how many times the pipeline is run. If a plugin is used in multiple pipelines, then each pipeline where it’s used is counted as 1 detected usage. Refer to How to determine if a plugin is in use for more details.
Number of controllers
The number of controllers on which the plugin is installed.
Last Pipeline run
The last time the plugin was used in a pipeline run.
-
Plugin details table: Selecting a plugin in the plugins overview table displays the plugin details table. It tabulates all the detected usages of the selected plugin. Selectors at the top of each column allow you to sort by that column’s content.
Column name Description Controller name
The name of the controller where the plugin is installed and where a usage is detected.
Type
The plugin usage type.
Details
Details about the plugin usage. Depending on the plugin usage type, this field provides more detail about the usage. *
Configurationusage type shows the object name where the plugin is mentioned in its configuration. *Dependencyusage type contains the name of the plugin that is dependent on the selected plugin. *Pipelineusage type contains the pipeline name.Version number
The plugin version used.
Used at
Date of plugin usage.