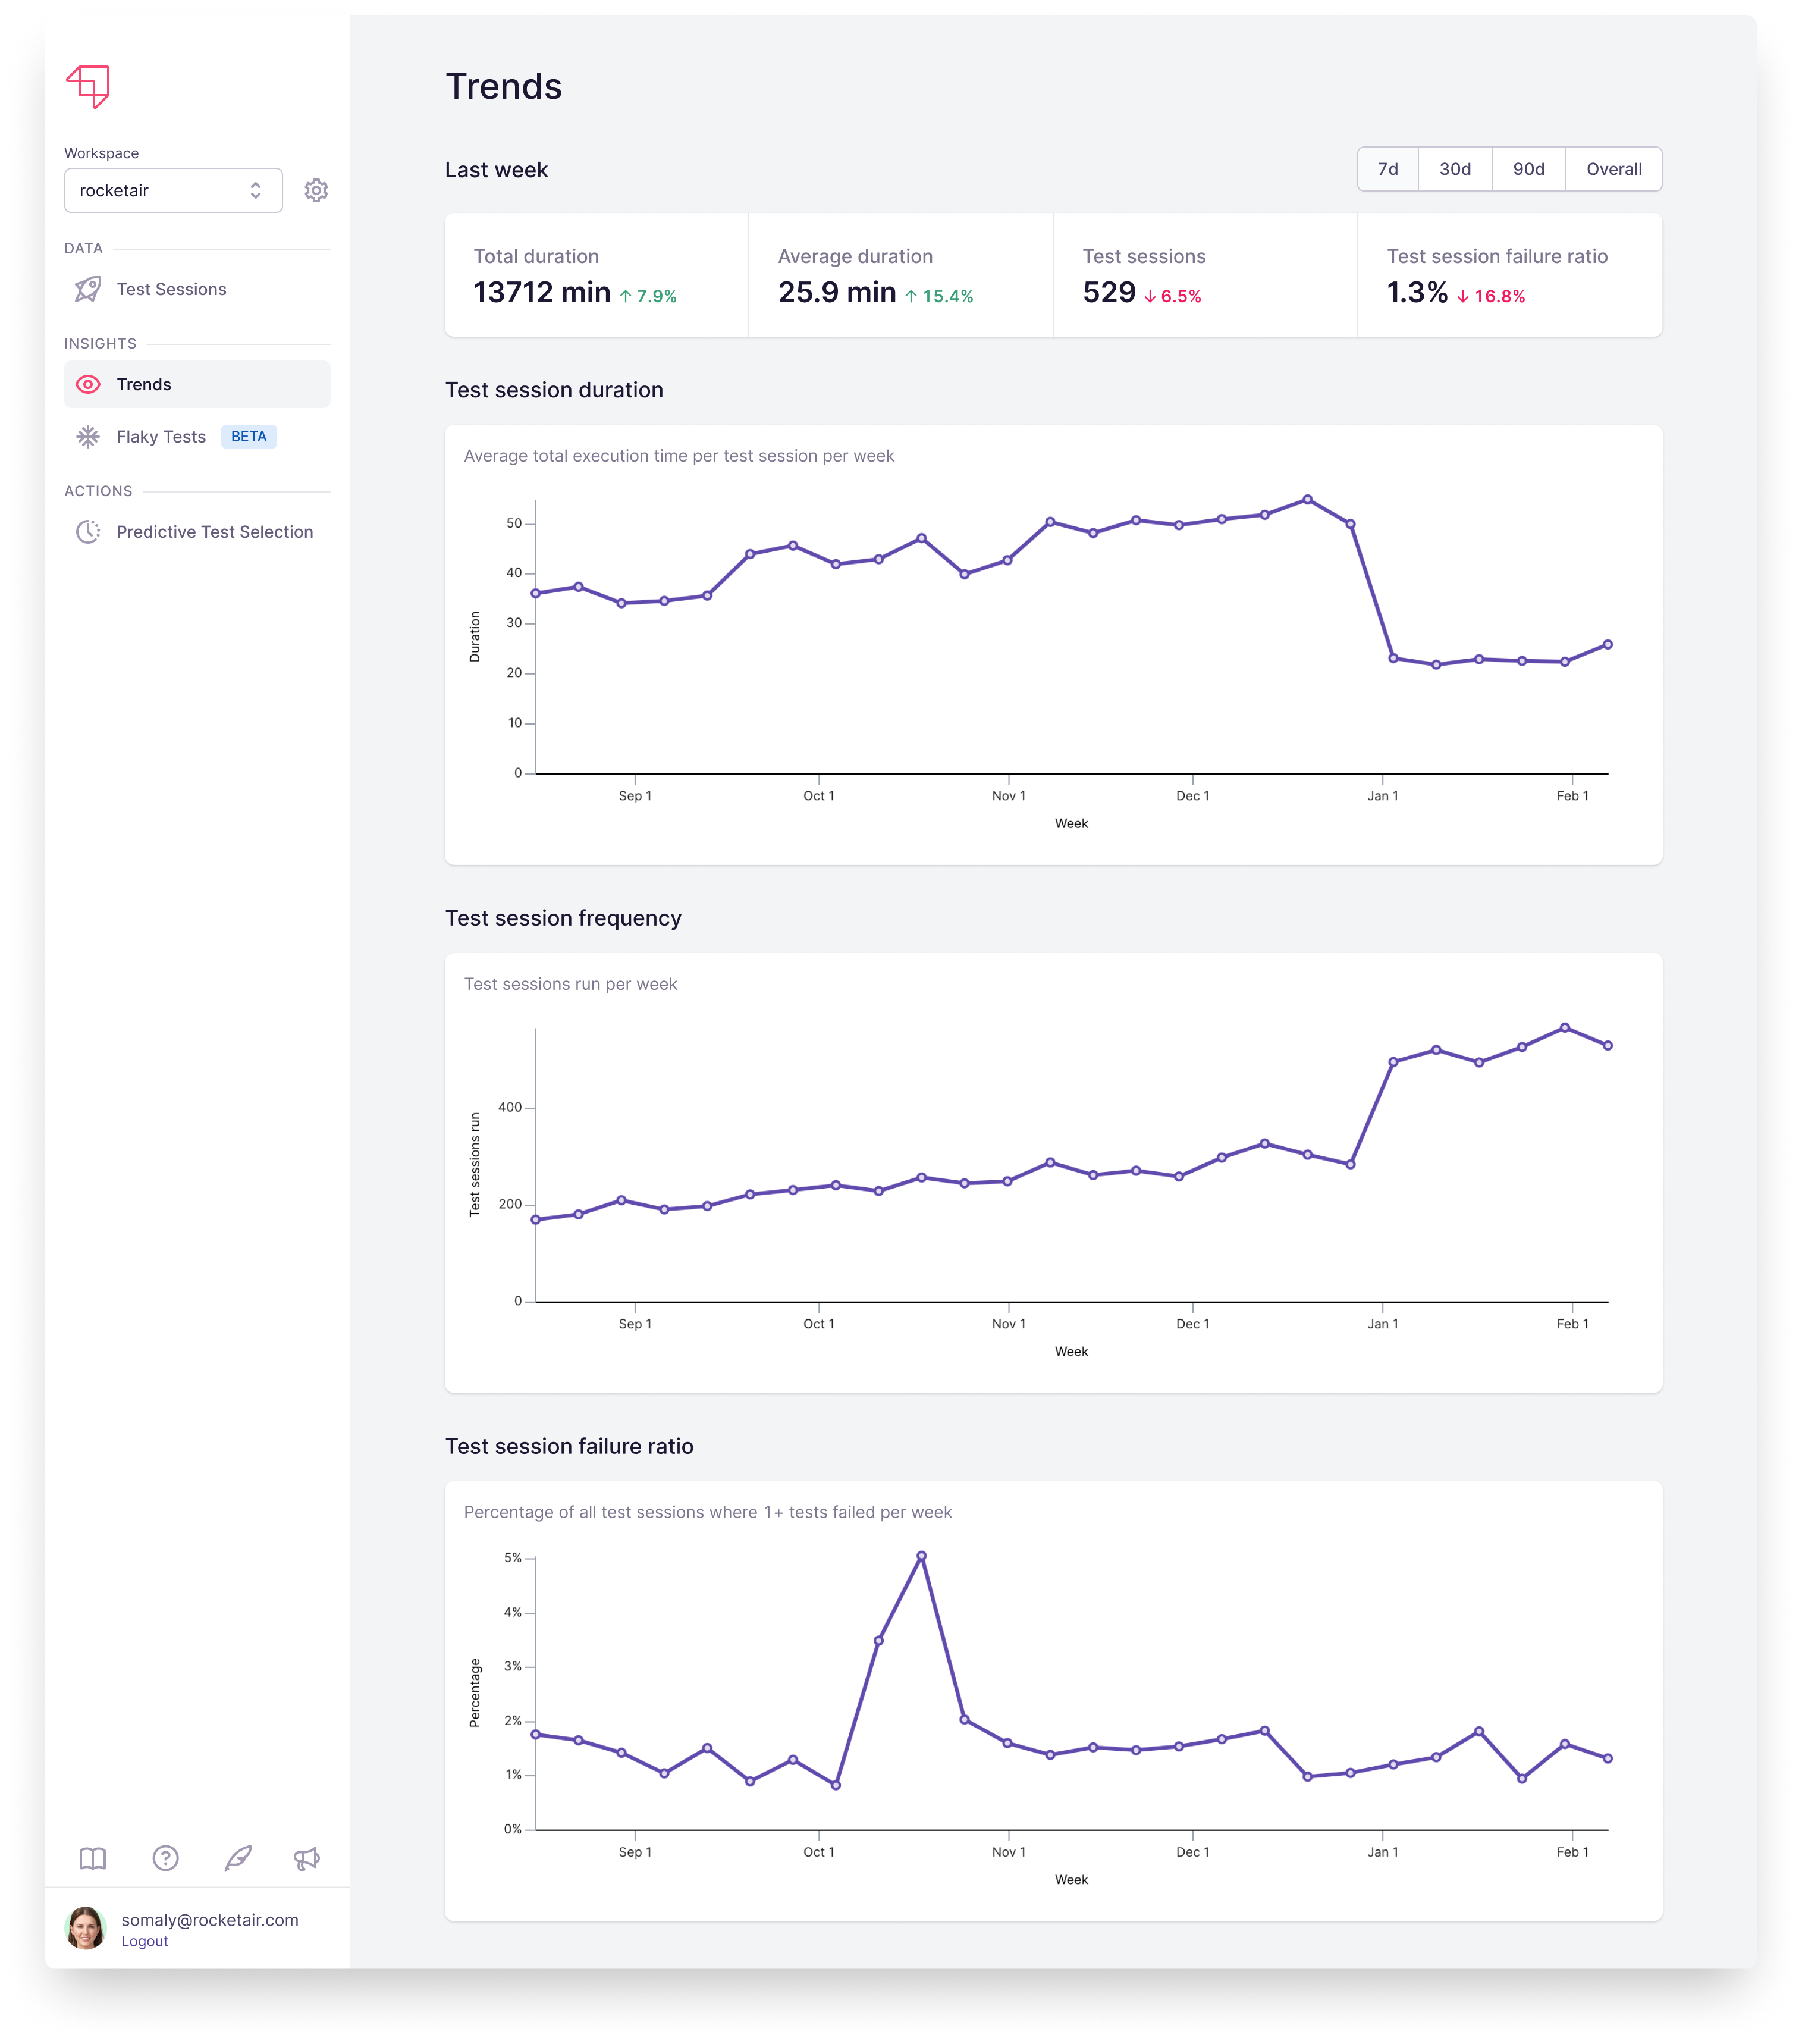
The Trends page shows aggregate info about your test runs, including average test session duration, test session frequency, and how often sessions fail.
Seeing this data over time gives you a picture of how your test suite is evolving; for example, perhaps your tests are taking twice as long as they did six months ago, and you need to cut it down! Similarly, perhaps your team’s running tests a lot more often than expected drives up resource costs. Or maybe you have some broken tests driving up the overall failure rate.