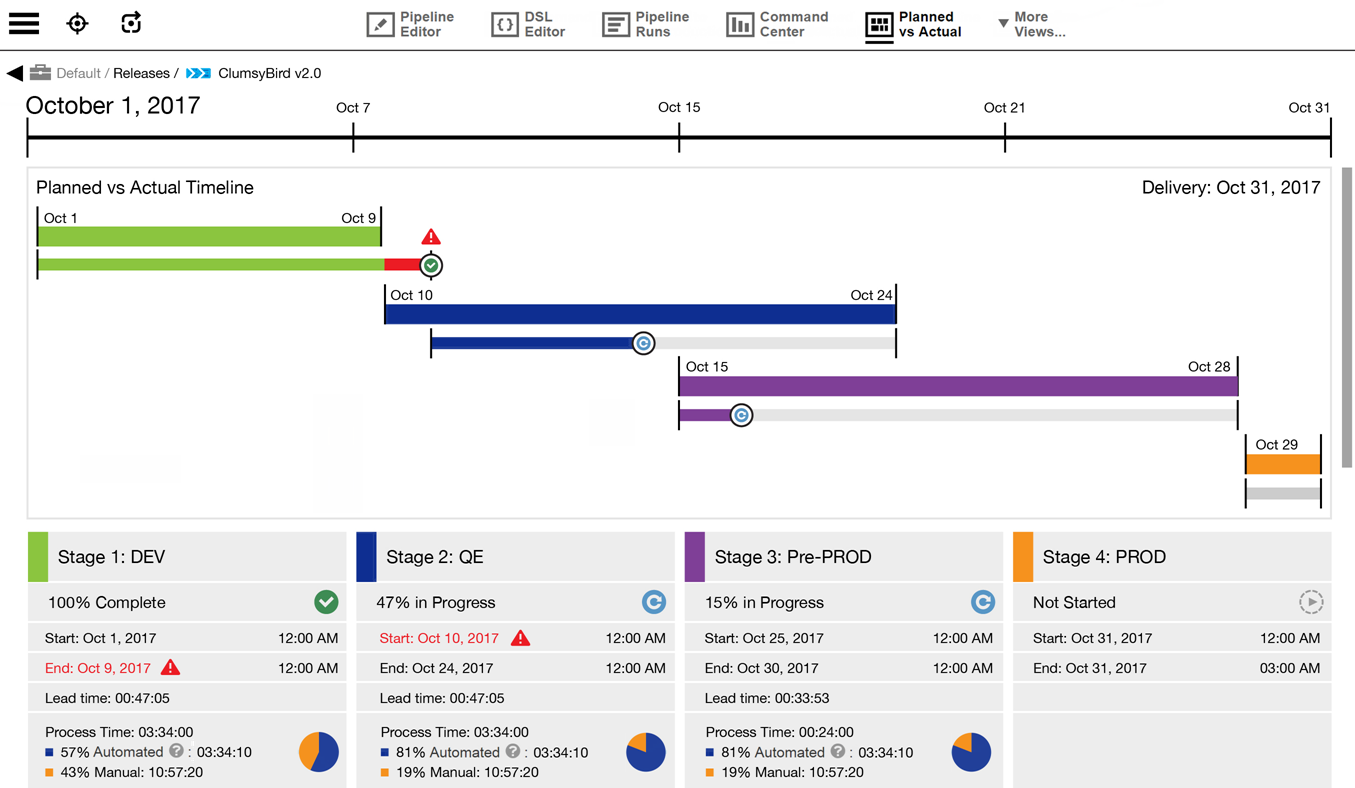
The Planned vs Actual view shows a bar-chart timeline of each pipeline stage versus your plan and the percentage complete of each stage to show where you are on your milestones. This view also shows the total time spent per stage and the time spent in automated versus manual activities. To see this view, click the Planned vs Actual button in the menu bar. Following is an example:
Viewing Key Details for a Pipeline Stage
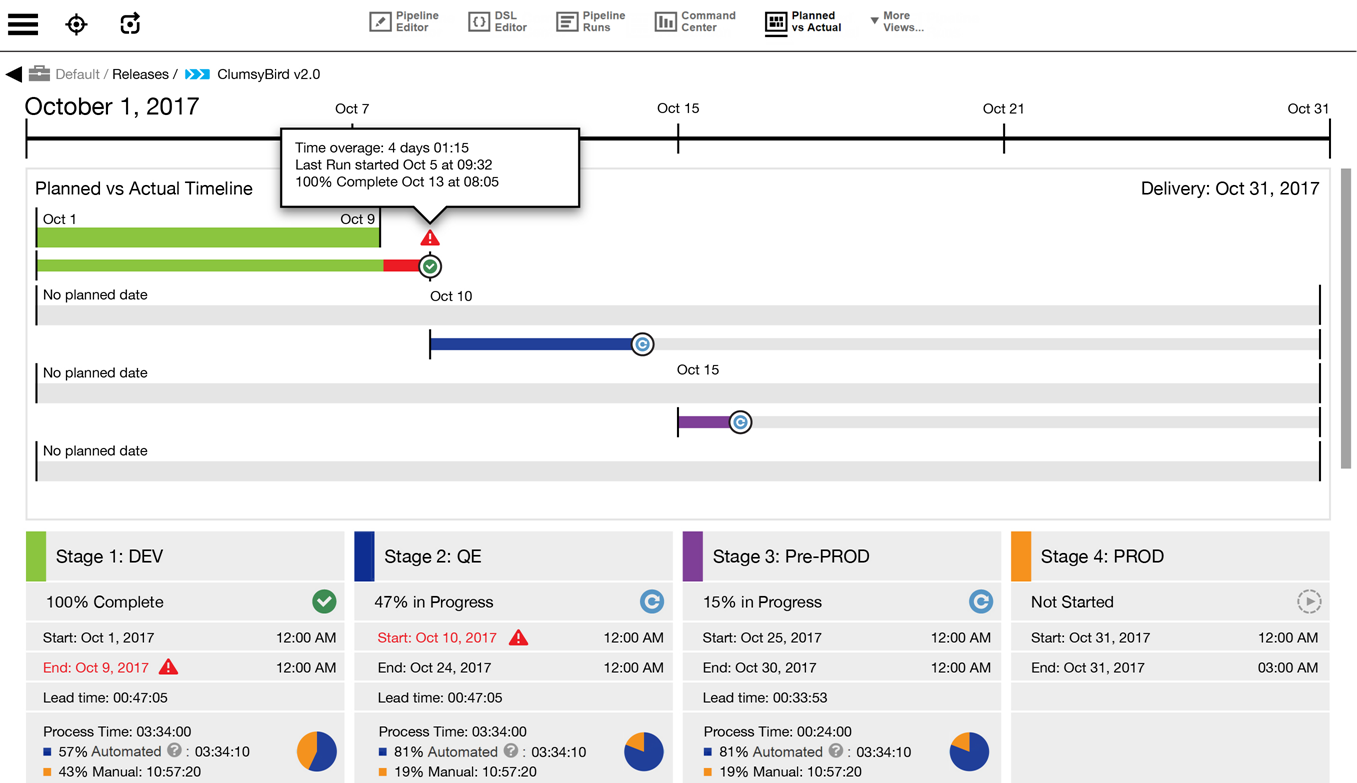
Click the end point of an actual progress bar for a pipeline stage to view key details. For example:
Changing the Color Coding for Pipeline Stages
You can customize the color in which a new stage appears in the Planned vs Actual view by clicking the Assign Color button in the pipeline stage details dialog box as in the following screenshot and then choosing a color from the palette that appears.
You can also change the color coding for an existing stage. To do so:
-
Select the
 button in the stage and then select Details. The Details dialog for the stage appears.
 -
Select Assign Color. The color palette dialog appears.
-
Select a color and then select OK to save your change.
You can optionally create custom colors and add them to the Custom colors palette for later selection via the Add to Custom Colors button.