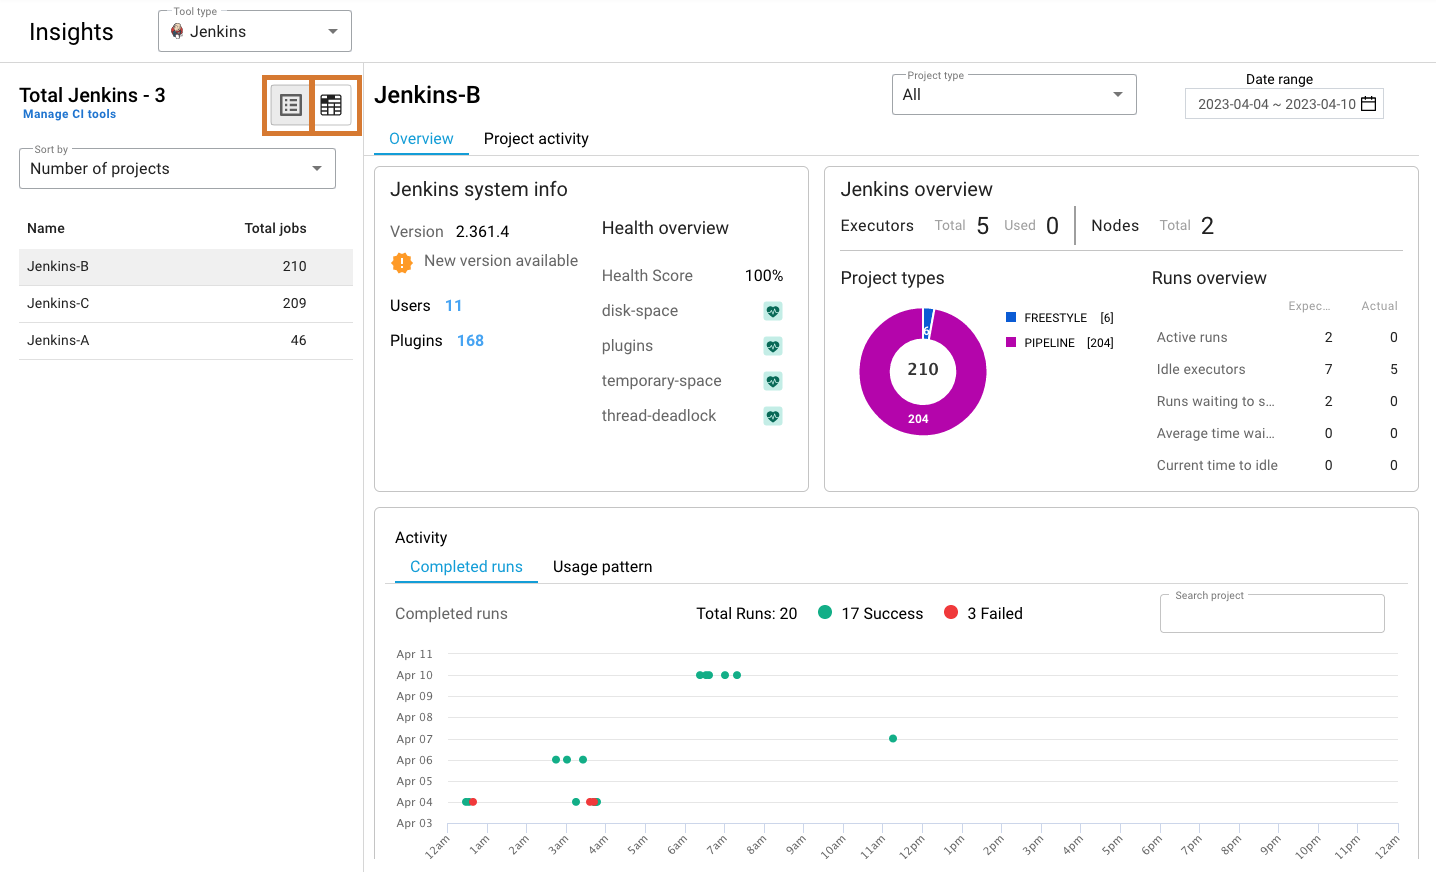
CloudBees Release Orchestration SaaS Insights, for CloudBees CI, CJOC, and Jenkins, enables users to understand project development performance in a given timeframe. Insights provides a range of information on project activity, including run time, total number of runs, jobs configured, system health, and usage patterns. You can display the data in either a tab or heatmap view.

Calculations are based on the total number of runs executed during the timeframe.
Sort the tab and heatmap views by:
-
Project name
-
Project failure rate
-
Number of projects
-
Last active project
Accessing Insights
To access Insights, select from the CloudBees Release Orchestration SaaS Home page.

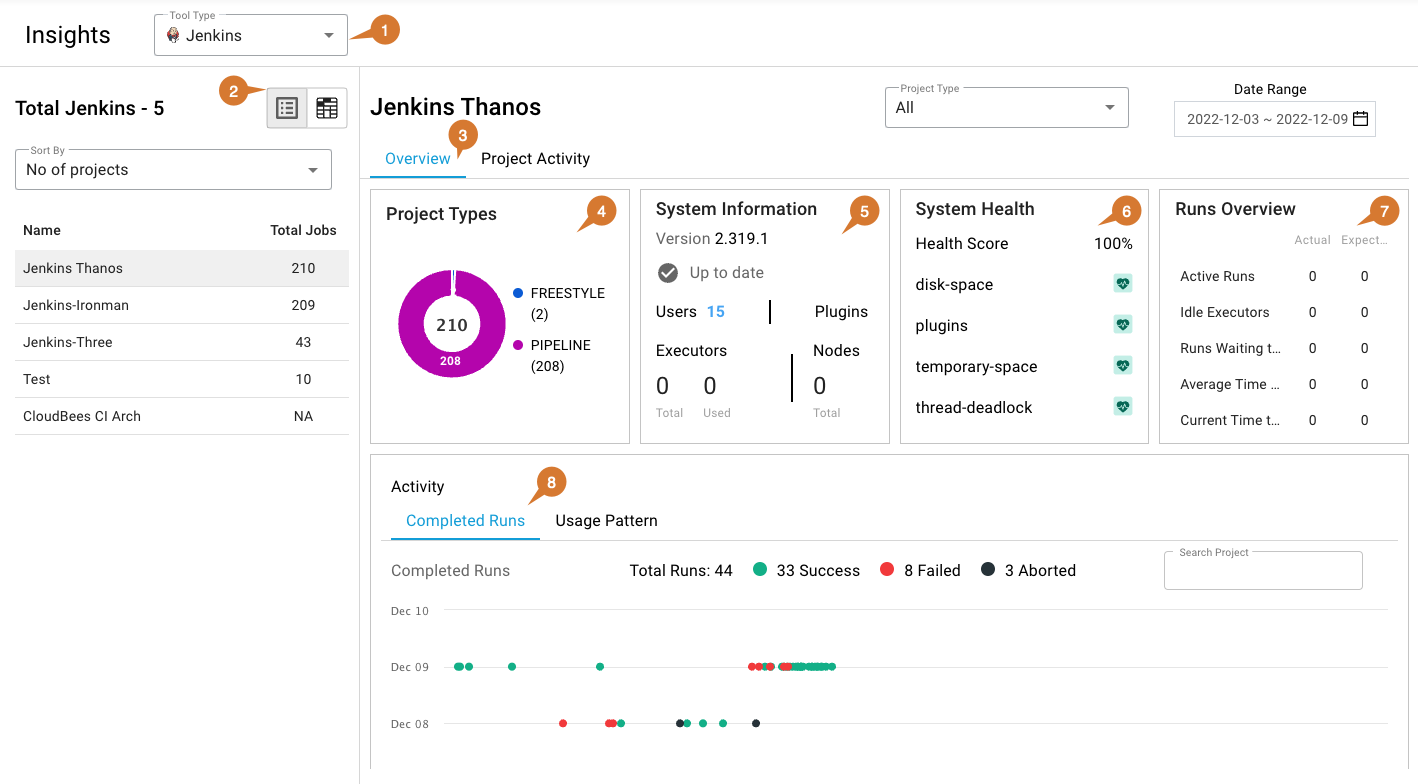
As displayed in Figure 2, Insights provides the following information in Overview:
-
Switch between CI tool types.
-
Switch between Heatmap View and Tab View.
-
Select Overview.
-
The doughnut graph in Project Types displays the project types.
-
System Information displays the version, number of users, plugins, executors, and nodes.
-
System Health checks:
-
Disk space
-
Plugins
-
Slowest
-
Temporary space
-
Thread deadlock
-
-
The Runs Overview, which is also shown in Usage Pattern, displays actual and expected for:
-
Active runs
-
Idle executors
-
Number of runs waiting to start
-
Average time waiting to start
-
Current time to idle (before new builds can start)
-
-
Completed Runs displays a chart of the run information for the time frame with the following color designations:
-
Successful runs are green
-
Failed runs are red
-
Aborted runs are black
-
| Hover over a run (shown as a dot) to display the run details. |

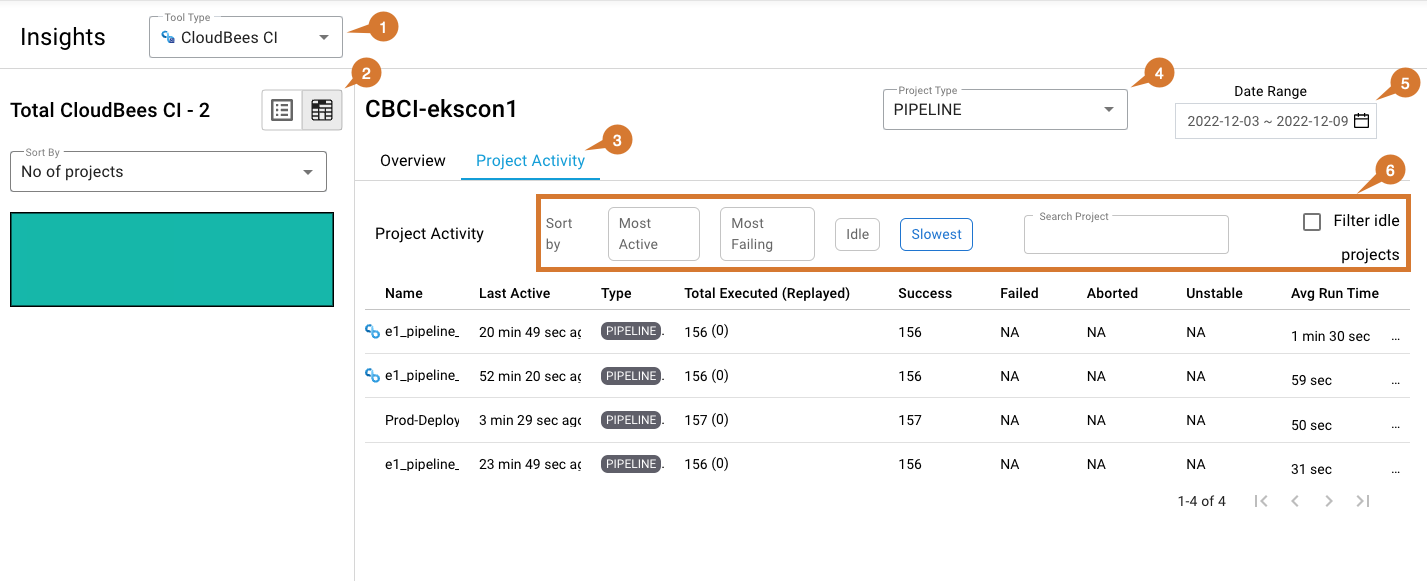
As displayed above, Insights provides the following information in Project Activity:
-
Switch between CI tool types.
-
Switch between Heatmap View and Tab View.
-
Select Project Activity. Project Activity displays:
-
Project name
-
Time last active
-
Project type
-
Total executed (and replayed)
-
Number of successful, failed, aborted and unstable runs
-
Average run time
-
-
Select from the Project Type options.
-
Select a date range. The default is seven days.
-
Sort by:
-
Most active
-
Most failing
-
Idle
-
Slowest
-
Project name
-
Filter out idle projects
-