With CloudBees Release Orchestration SaaS, you get complete visibility into pipelines, which helps both engineers and DevOps teams. Developers can check test stability, and DevOps teams can check build script functioning.
The Executive Summary provides you with release pipeline insights, but the Pipelines screen enables you to delve into analysis and functioning of all aspects of your pipelines.
| You must have the Admin, Developer, DevOps, or Manager role to access the Pipelines screen. |
-
From the CloudBees Release Orchestration SaaS Home page, select .
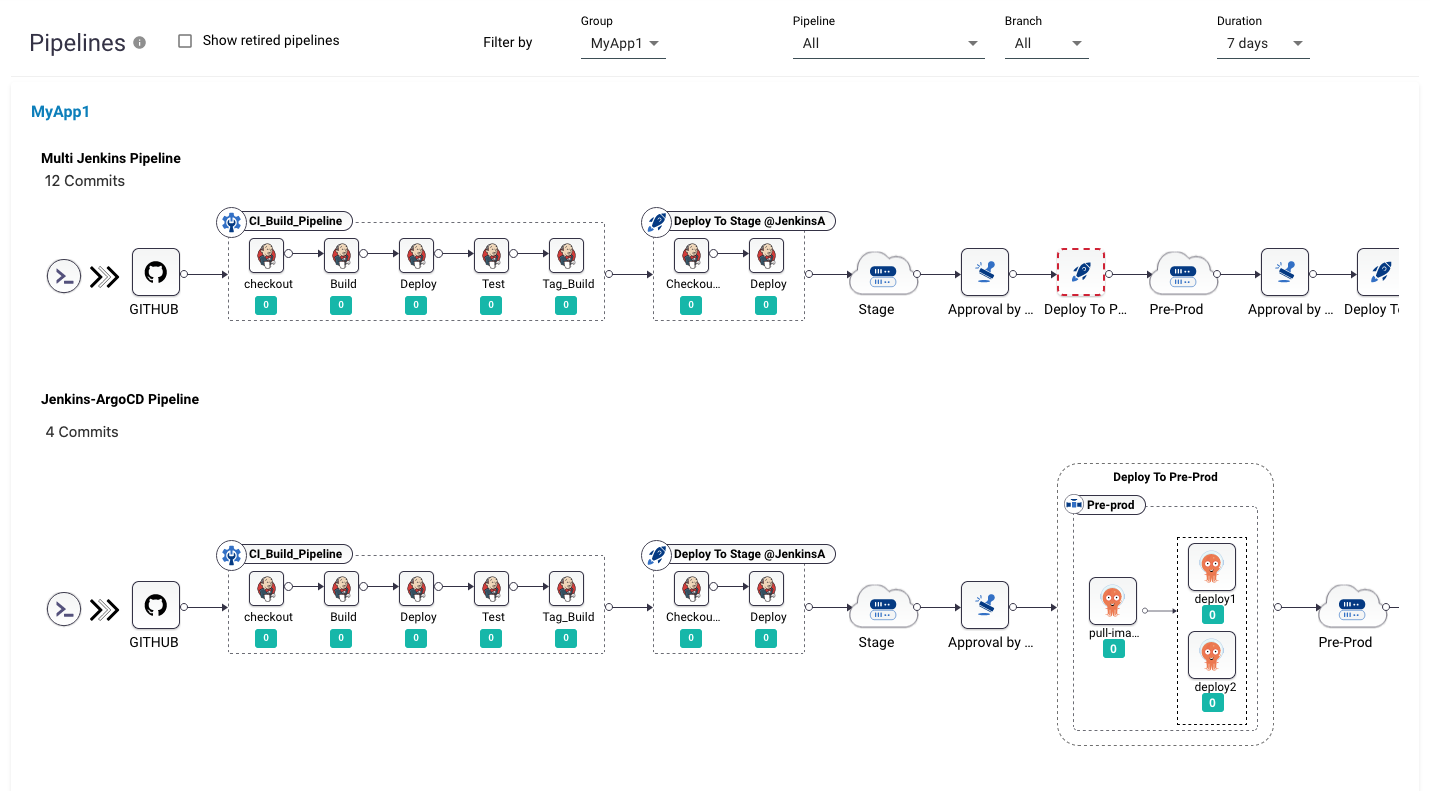 Figure 1. A list of pipelines
 -
Select a pipeline. In the example below, three commits are made into the GitHub repository.
 Figure 2. An example pipeline with commits
 -
Select the Deploy to Build step to display detailed information of the build, as shown in the example below.
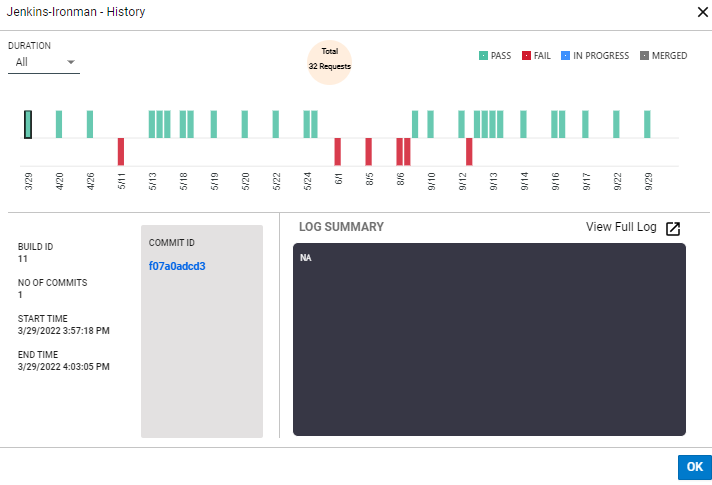 Figure 3. An example of detailed information for a build
 -
Select the Deploy to Stage step to display detailed information of the stage history, as shown in the example below.
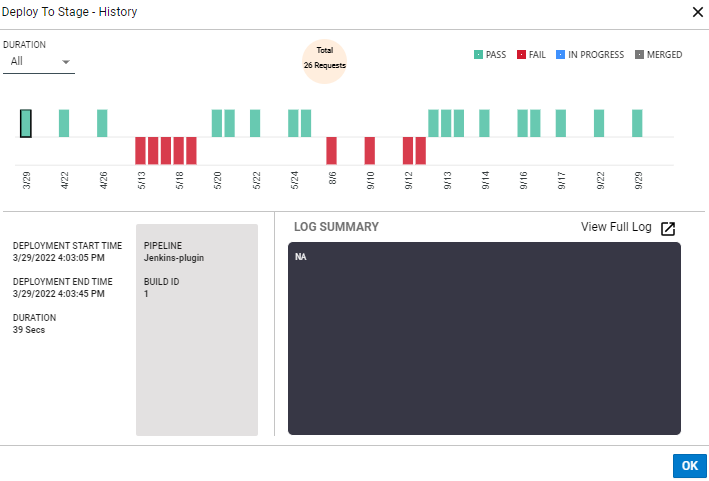 Figure 4. An example of stage history details
 -
Select Auto/Manual test to display detailed information on the tests performed, as shown in the example below.
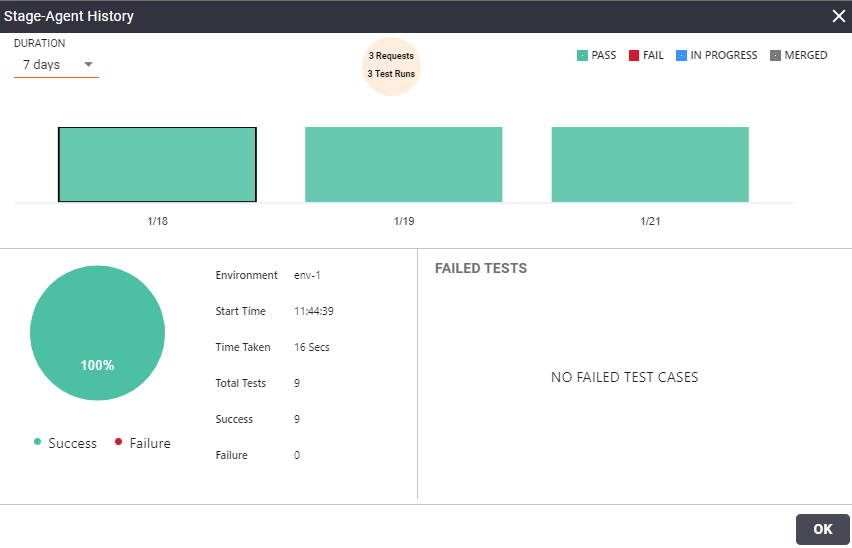 Figure 5. An example of test information
 -
Select Approval to display detailed information on approvals, as shown in the example below.
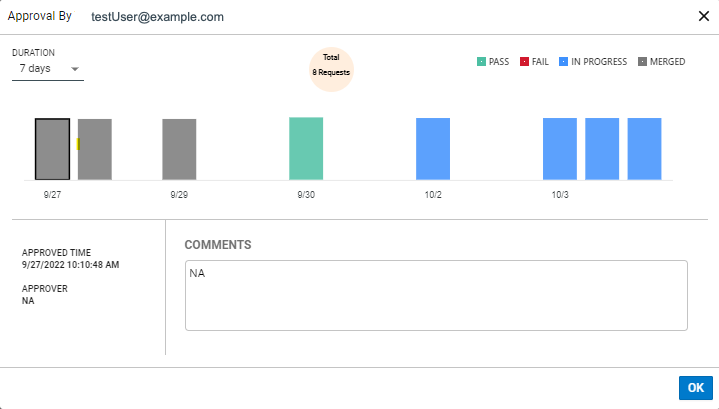 Figure 6. An example of the pipeline approval process
 -
Select Deploy to Prod to display detailed information on the deploy to production history, as shown in the example below.
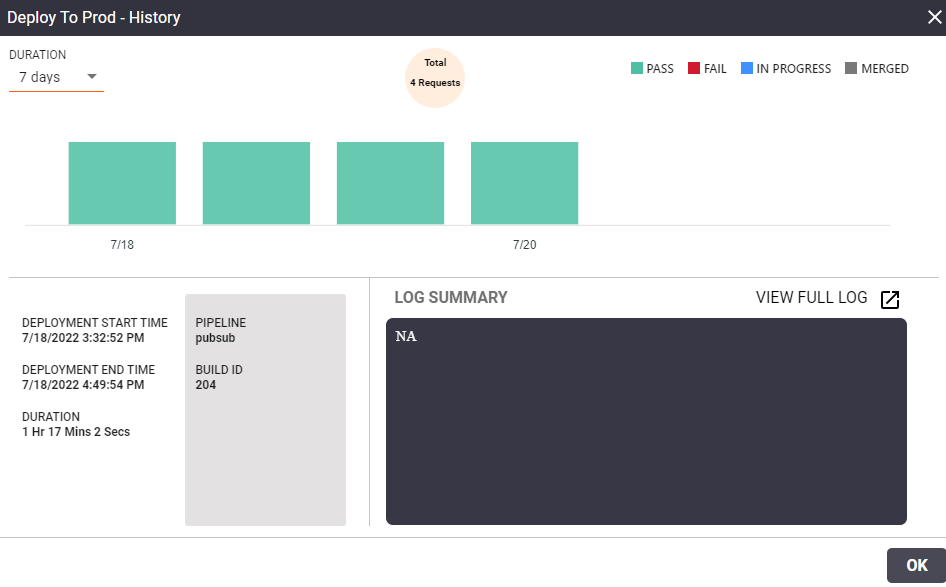 Figure 7. An example of information on the production deployment
 -
Select the Build step to display the number of passing and failing builds.
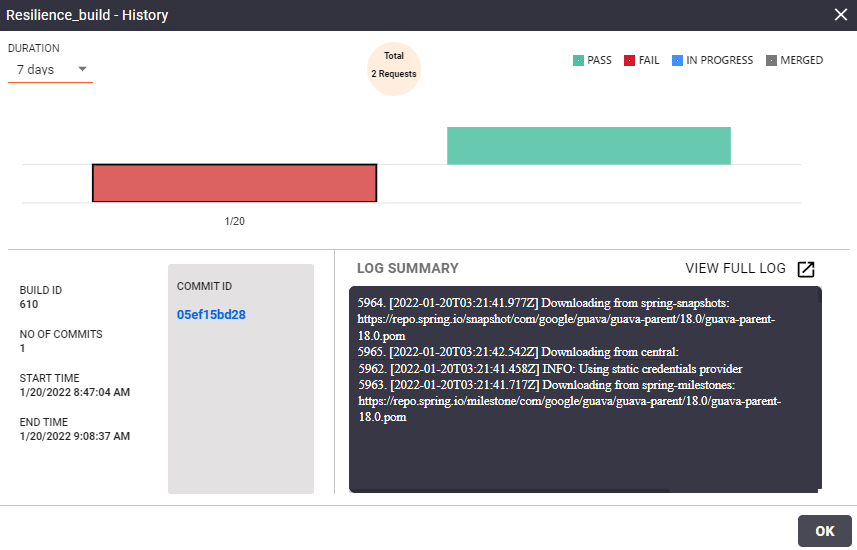 Figure 8. An example displaying passing and failing builds
 -
If an individual build is successful, a green block is displayed. Select the green block to display insights, such as Build ID, number of commits, start time, and end time. If the build fails, the block is displayed as purple. Select the purple block to display the build failure log.