|
This is Rollout-legacy documentation. For Rollout customers: This (Rollout) documentation remains available through your end-of-service date. CloudBees Feature Management is now part of CloudBees Unify. Refer to CloudBees Unify Feature management documentation. |
CloudBees Feature Management flag impressions allow you to visualize and analyze your feature flag configuration data. Impressions are captured by adding the impressionHandler to each installed SDK, and are displayed in the flag’s Impressions tab.
Every time a flag is evaluated, that evaluation is counted as an impression. The CloudBees Feature Management impression handler evaluates a combination of the number of times the flag configuration is accessed by visitors, and the flag value that is displayed.
| Impression data is fetched and reported every few minutes. |
Configuring the impression and fetched handlers
The impression and fetched handlers must first be added to the SDK before they are reported to the CloudBees Feature Management Impression tab.
To add the handlers to the SDK, refer to the following pages for instructions:
When your handlers have been added to the SDK you can analyze the impression data from within CloudBees Feature Management.
Accessing impression data
When your impression and fetched handlers are added to the SDK, you can access the data in the flag’s Impressions tab.
To access the flag impressions:
-
From the CloudBees Feature Management Home page, select your email and avatar, and then select the organization. Disregard this step if you are a member of only one organization.
-
Select All apps from the left pane, and then select the app that contains the flag.
-
Select the environment from the left pane, and select the flag.
-
Select the Impressions tab.
The flag impressions are displayed within a view on the main screen.
Analyzing impression data
Impressions are reported to the flag’s Impressions tab, and are displayed in a data visualization.
To analyze the impressions received:
-
From the top-right corner of the data visualization on the main screen, select the Last 7 days or Last 24 hours to update the view.
-
Hover over a bar within the view to access the following impression data:
-
The creation date and time:
-
For the Last 7 days the time is reported at 12:00:00 AM UTC.
-
For the Last 24 hours the time is reported by hour.
-
-
The flag value for each impression:
-
A flag’s value can be a configured set of flag values, or the true or false percentage of visitors the flag is active for.
-
-
The number of impressions for each flag:
-
Displayed after the flag value (for example, at end of the string), and separated by a colon.
-
-
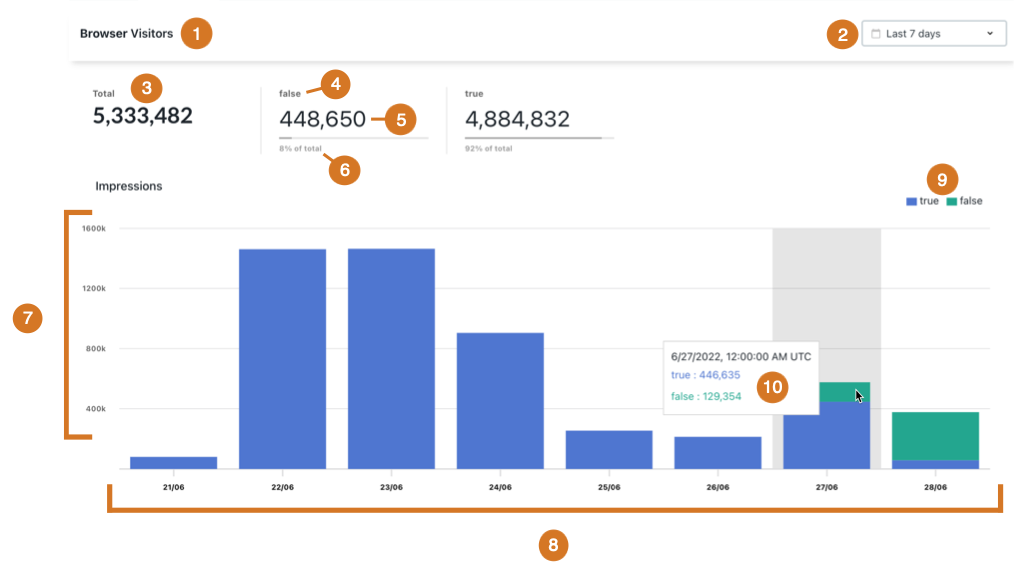
The impressions view
This section describes the data that is displayed in the Impressions view.
-
Visualization title: Browser Visitors or Platform Visitors
-
Time duration of reported impressions: Can be configured as Last 7 days or Last 24 hours
-
The total number of all impressions within the specified time duration
-
The flag value, such as the following:
-
The string value
-
Multiple flag values
-
False: The configuration is not active
-
True: The configuration is active
-
-
The number of impressions for the specified flag value
-
The percentage of impressions for the specified flag value
-
The number of impressions axis: A continuous range based upon the total number of impressions
-
The range of time axis: A range of days or hours based on the selected duration
-
The legend: May include the number of times the flag is evaluated as True or False, the string information, or a variable set by the flag configuration for example
-
The tooltip display when hovering over the impressions bar
Reporting impressions to third party data visualization tools
You can also add a function to the SDK to report the flag state or other data to third party data visualization software or application performance management systems. Refer to your third party analytics provider SDK for more information.