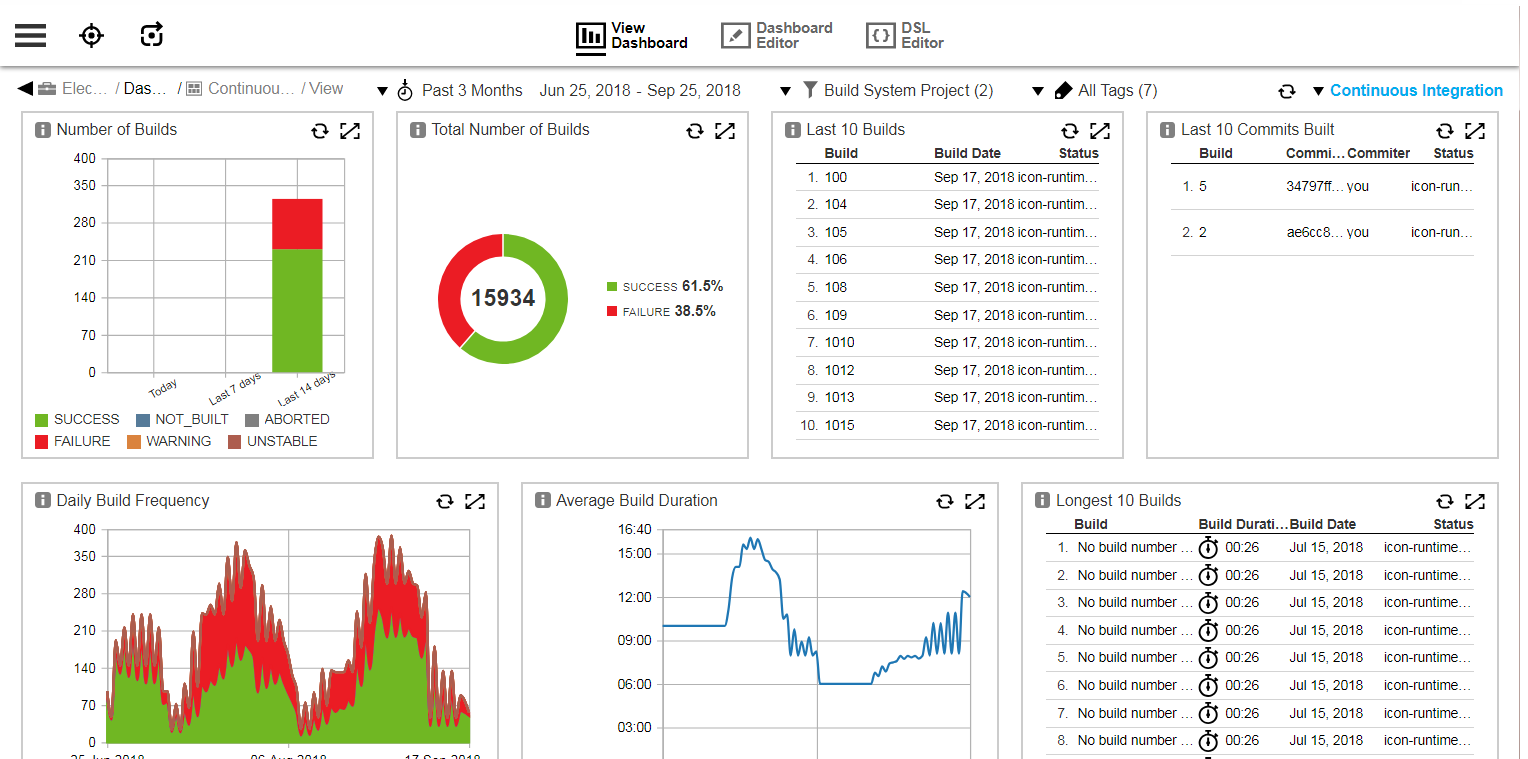
The Continuous Integration dashboard displays key metrics for builds that can be used to gain insight into your organization’s build throughput and to bubble up any potential build issues. The Continuous Integration dashboard provides indicators to measure agility of development.
Filters
This dashboard provides drop-down menus that let you filter by time period, project, and tags:

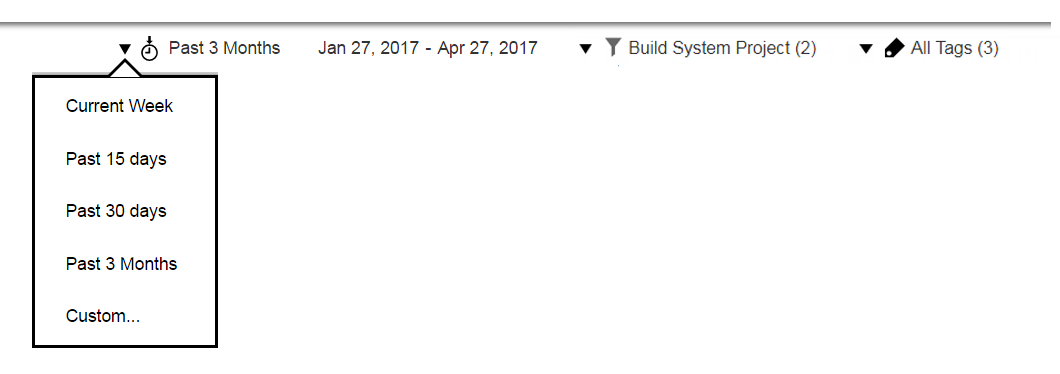
Time filter
Filters the builds based on the selected time range. The time filter applies to the build end time, which is set as the timestamp field value for the build records.
By default, the build metrics for the past three months appear. You can change the date range by selecting the drop-down menu on the top of the dashboard. In addition to the preset ranges such as Current Week and Past 15 days, you can also specify a custom date range by using the Custom… option.
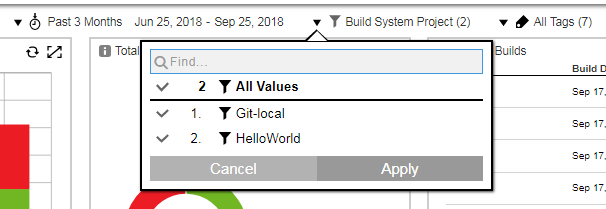
Build System Project Filter
Filters the builds based on the project that the builds are associated with in the native build system using the projectName field. For CloudBees CD builds, this is the project name of the build procedure, while for Jenkins, this is the Jenkins project name.
By default, build metrics for all build system projects appear. You can choose specific build system projects by selecting the drop-down menu for projects at the top of the dashboard. The build metrics are filtered based on those projects.
Tags Filter
Filters the builds based on the tags marked on the builds. For CloudBees CD builds, these are the tags set on the build job and tags set on the build procedure, which are passed on to the build job.
By default, build metrics for all builds appear. You can choose specific builds marked with specific tags by selecting the drop-down menu for tags at the top of the dashboard. The build metrics are filtered based on those tags.
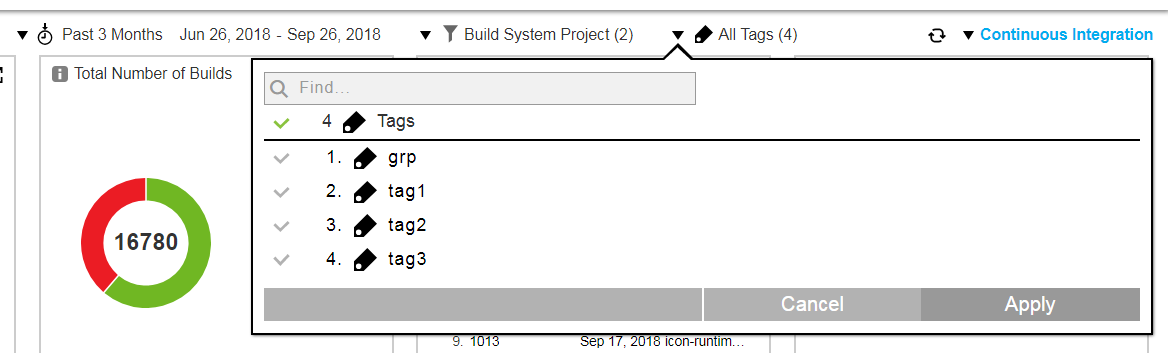
Examples are deployment tags such as prod or UAT and feature tags from JIRA such as webapp . For more information about tags, see "Object Tags" in the CloudBees CD User Guide .
Visualizations
Number of Builds
This chart provides the number of builds that have occurred today, during the last seven days, and during the last 14 days:
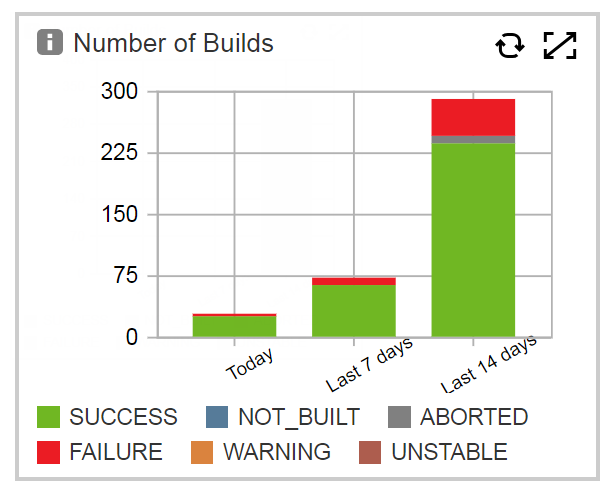
These durations are fixed and are therefore unaffected by the time filter.
Total Number of Builds
This chart provides the total number of builds that have occurred and shows a breakdown by different build outcomes. These are the possible outcomes: SUCCESS, FAILURE, UNSTABLE, NOT_BUILT, ABORTED, and WARNING.
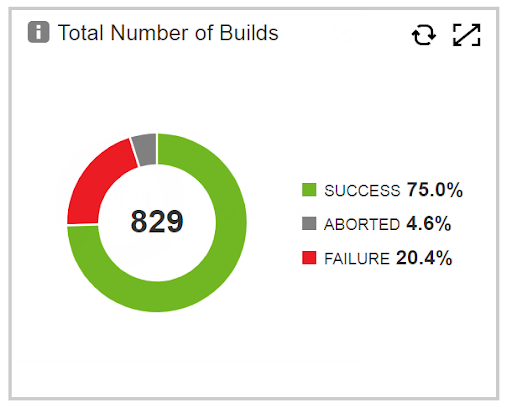
The duration depends on the time range selected using the Time Reference filter at the top of the dashboard.
Last 10 Builds
This report lists the last ten builds:
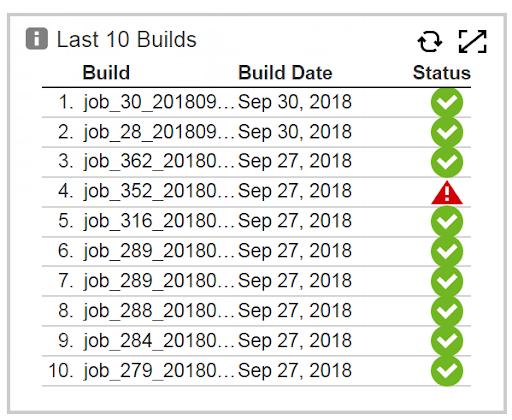
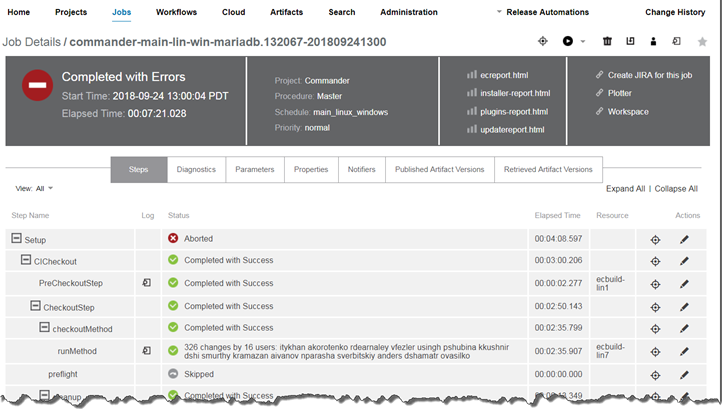
You can drill down into a build by clicking that build. This opens your CI system such as Jenkins or CloudBees CD. For example, if you are using Jenkins:
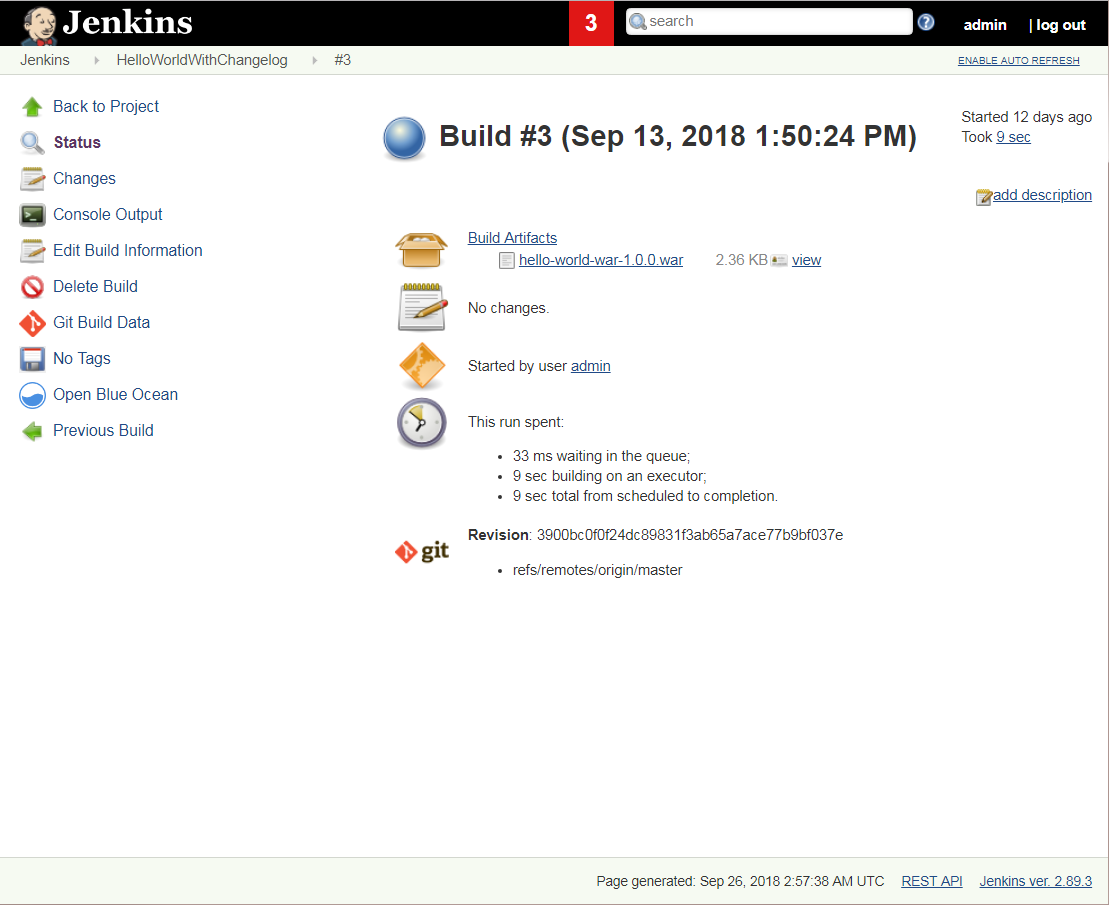
Also, for example, if you are using CloudBees CD:
Last 10 Commits Built
This chart shows the last ten code commits that have been built:
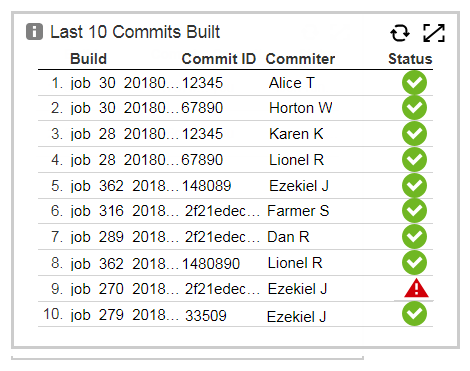
You can drill down into a build by clicking that build to open the build details page in your CI system such as Jenkins or CloudBees CD as described above.
Daily Build Frequency
This chart shows the number of builds that have occurred over time:
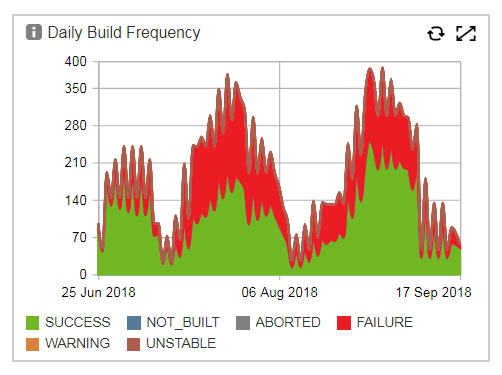
The duration depends on the time range selected using the Time Reference filter at the top of the dashboard.
Average Build Duration
This chart shows the average build duration over time:
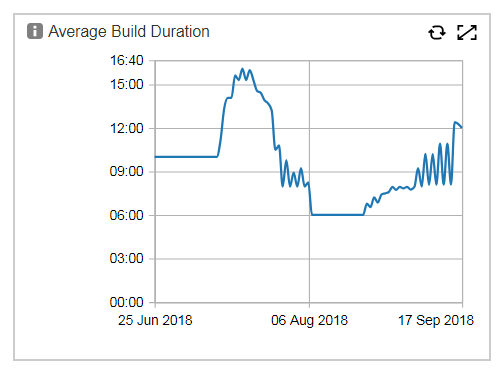
The duration depends on the time range selected using the Time Reference filter at the top of the dashboard.
Longest 10 Builds
This report lists the ten longest builds that have occurred:
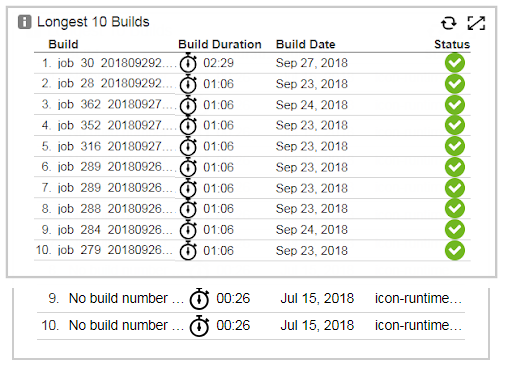
The duration depends on the time range selected using the Time Reference filter at the top of the dashboard.
You can drill down into a build by clicking that build to open the build details page in your CI system such as Jenkins or CloudBees CD as described above.