The Home page provides a news feed, links to documentation and other assistance, instruction for novice users, and real-time charts for agent usage and build durations during the past 24 hours.
Banner pulldown menus
The banner contains two pulldown menus, which are located in the top right of the banner.
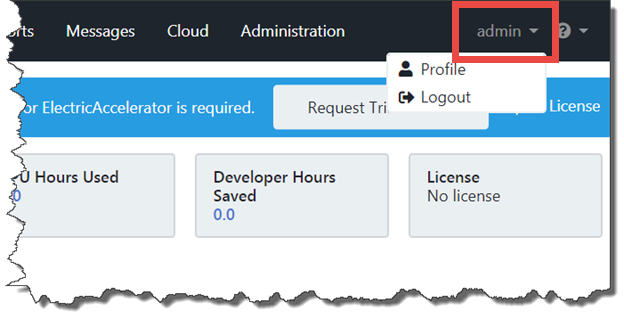
Current user pulldown menu
This menu provides a link to the current user’s profile page and a Logout link.
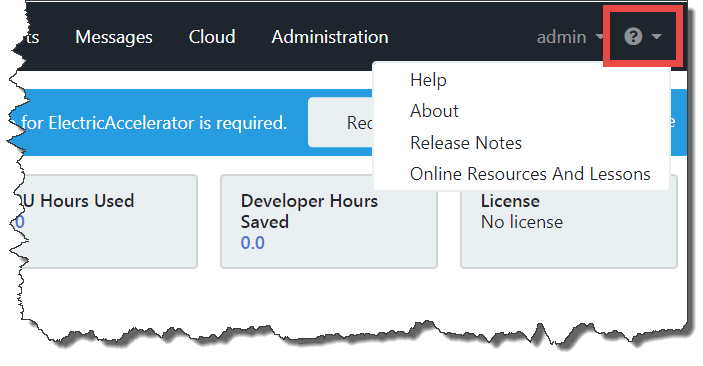
User assistance pulldown menu
This menu provides several links for more information about the Cluster Manager.
-
Help —Opens page-specific (context-sensitive) HTML help throughout the web UI.
The help is loaded from the CloudBees Build Acceleration documentation web page. The web UI also provides overview and concept help topics that are not context-sensitive (meaning that they are not linked to a specific page in the web UI). The left pane (table of contents) of any help page that appears will contain the list of help topics.
-
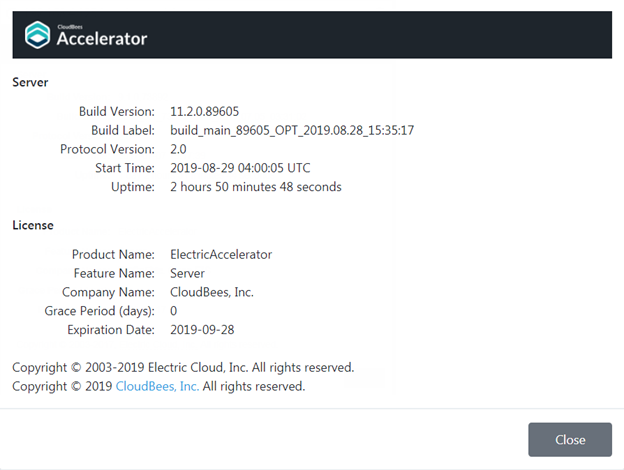
About —Displays information about the Cluster Manager server (such as the product version) and information about the Cluster Manager license (such as the expiration date and the grace period for renewal).
-
Release Notes —Opens a welcome screen containing new release announcements and links about the related release notes and downloads page.
-
Online Resources And Lessons —Provides a quick start guide and instructional videos for beginners as well as resources for documentation and other forms of assistance (such as the Knowledge Base and the “Ask” user forum).
The banner also provides the following key statistics about the cluster:
-
Agents —Number of agents that are currently running in the cluster.
-
Running builds —Number of builds that are running currently in the cluster.
-
CPU Hours Used —Total hours of CPU time used by all builds on all agent machines in the cluster since it was established.
-
Developer Hours Saved —Total hours of build time saved versus builds without build acceleration since the cluster was established.
-
License —Number of days remaining in the Cluster Manager license.
Tabs
The Home page and all other pages in the Cluster Manager web UI provide tab-based access to administration functions as well as information about builds, agents, reports, agent cloud bursting, and messages.
-
Home — Opens the Home page.
-
Builds —Opens the Builds page, which displays running and completed builds, additional build information, and whether completed builds succeeded or failed. For details, see Builds.
-
Agents —Opens the Agents page, which lets you view details about each agent in the cluster, such as the agent host machine, agent software version, and agent status (such as whether it is running, has a problem, or if it failed). For details, see Agents.
-
Reports —Opens the Reports page, which provides many types of analytics about your build cluster and uses several types of data visualization, such as scatter plots and pie charts. For details, see Reports.
-
Messages —Opens the Messages page, which displays messages from the Cluster Manager, agents, and eMake. For details, see Messages.
-
Cloud —Opens the Cloud page, which stores cloud platform credentials, cloud burst resource status, and messages related to cloud platforms. For details, see Cloud.
-
Administration —Opens the User Settings page, which lets you view and edit the details about the current logged-in user (such as full name, email address, and assigned groups). For details, see User Settings.
Online resources
This section provides online resources for documentation and other forms of assistance such as the CloudBees Build Acceleration Knowledge Base.
Lightning lessons
This section provides a quick start guide and instructional videos for beginning users.
Agent usage (last 24 hours) report
This report is a stacked area chart that shows the agent license count and agents available versus agent demand in a specified time period. For details, see Agent Usage Report.
Build duration report
This report is a scatter plot that shows the durations of builds over a specified time period. For details, see Build Duration Report.