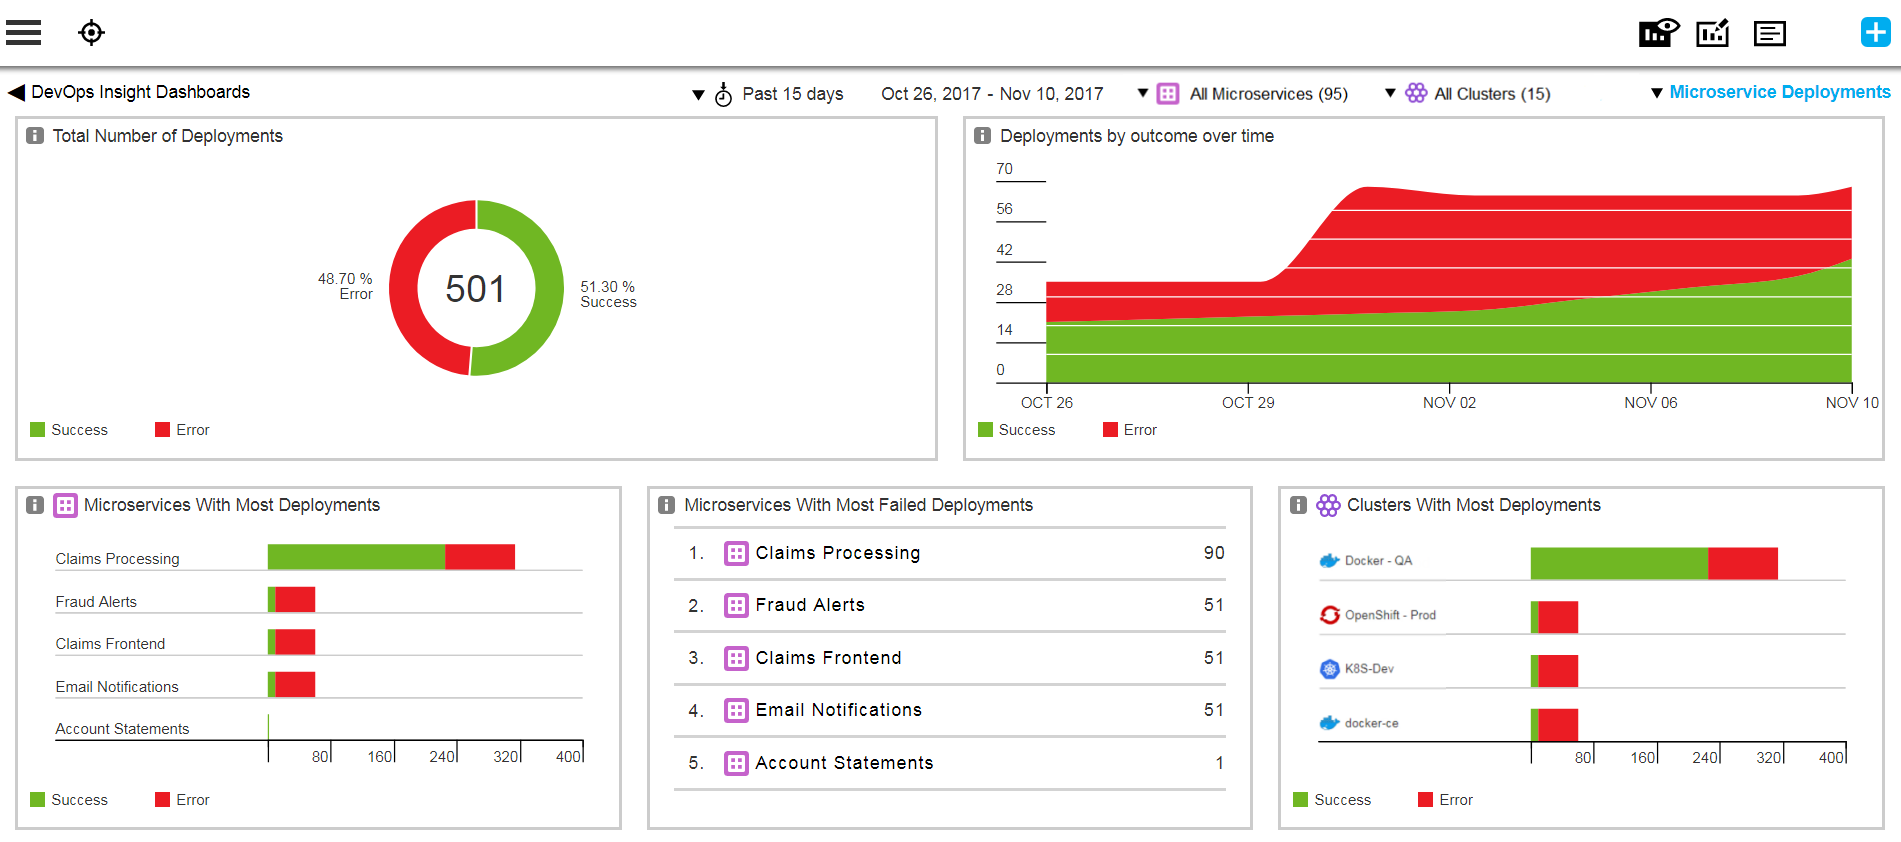
The Microservice Deployments dashboard displays key metrics for microservices deployed to different container orchestration platforms. These metrics can be used to gain insight into your organization’s throughput and to bubble up any potential bottlenecks in your microservice deployment processes so that they can be addressed quickly.
The Microservice Deployments dashboard can be used to identify problem hotspots and measure the reliability of microservices running on your container clusters. This dashboard provides indicators to measure agility of development and reliability of microservice deployments.
This dashboard does not include application deployments. This dashboard includes metrics only for independent (project-level) microservices and does not include metrics for microservices within applications.
Filters
This dashboard provides drop-down menus that let you filter by time period, microservice, cluster, and tags:

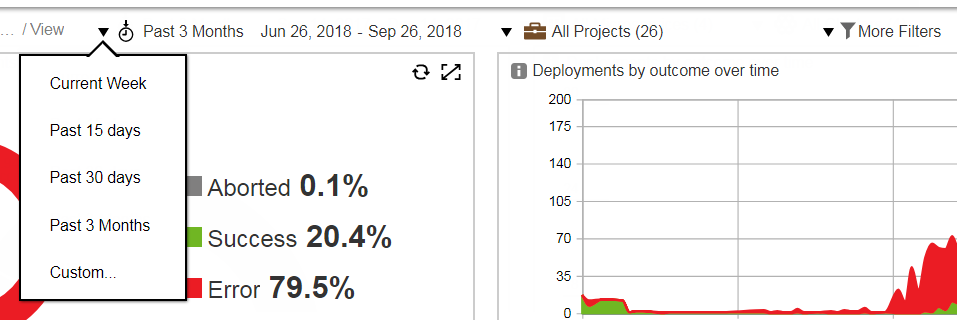
Time Filter
By default, the microservice deployment metrics for the past three months appear. You can change the date range by selecting the drop-down menu on the top of the dashboard. In addition to the preset ranges such as Current Week and Past 15 days, you can also specify a custom date range by using the Custom… option.
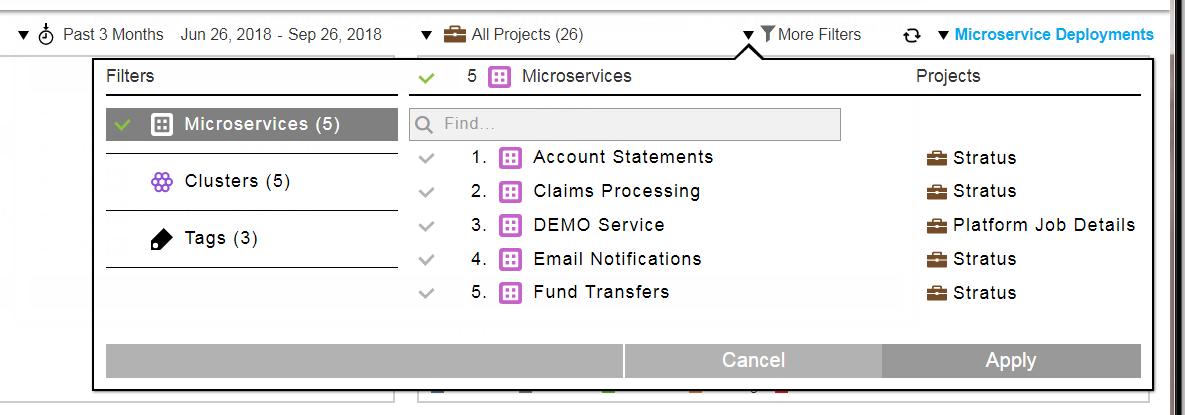
Microservices Filter
By default, microservice deployments metrics for all microservices appear. You can choose specific microservices by selecting the drop-down menu for microservices at the top of the dashboard. The microservice deployments metrics are filtered based on those microservices.
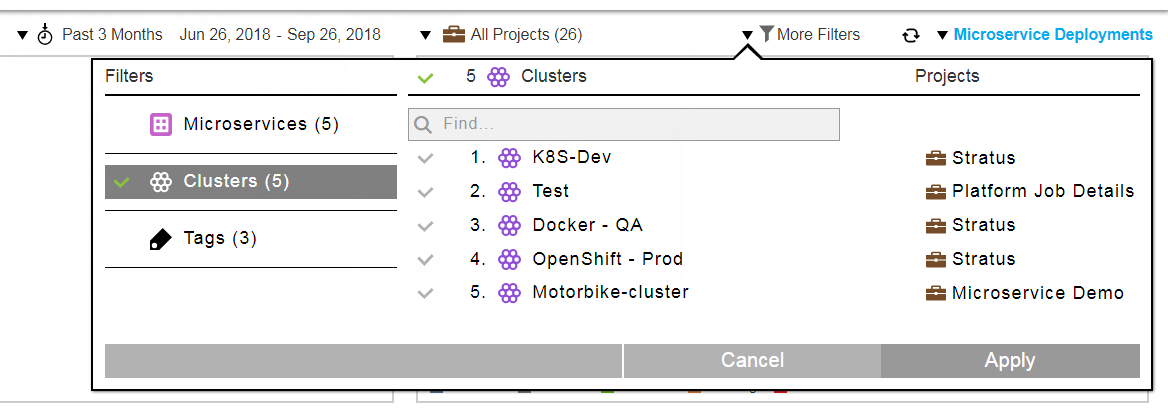
Clusters Filter
By default, microservice deployments metrics for all clusters appear. You can choose specific clusters by selecting the drop-down menu for clusters at the top of the dashboard. Then the microservice deployments metrics will be filtered based on the selected clusters that were used for microservice deployments.
Tags Filter
Filters the microservice deployments based on the tags marked on the builds. By default, build metrics for all microservice deployments appear. You can choose specific microservice deployments marked with specific tags by selecting the drop-down menu for tags at the top of the dashboard. The microservice deployments are filtered based on those tags.
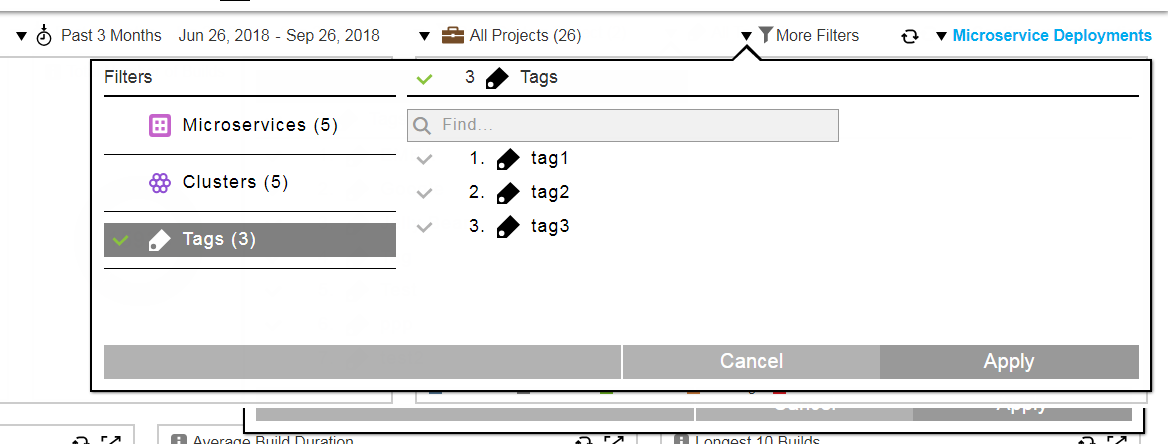
Examples are deployment tags such as prod or UAT and feature tags from JIRA such as webapp . For more information about tags, see "Object Tags" in the CloudBees Flow User Guide .
Visualizations
Total Number of Deployments
This chart provides a breakdown of all microservice deployments by their outcome. This lets you measure the reliability of your microservice deployments.
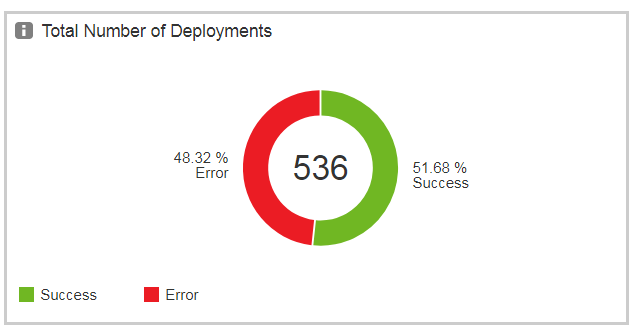
You can drill down into the Total Number of Deployments cell by clicking a slice or clicking on the legend (useful if the slice is too small to click on). The microservice deployments for the outcome in the selected slice appear on the Microservice Deployments page. For example, if you click on Error, only the failed deployments are listed in the Microservice Deployments page. Examples of possible outcomes are Success, Error, Warning, and Aborted.
Deployments by Outcome Over Time
This chart provides two powerful metrics as measures of health and efficiency of your microservice deployments: the total number of successful deployments over time and total number of deployments with errors over time.
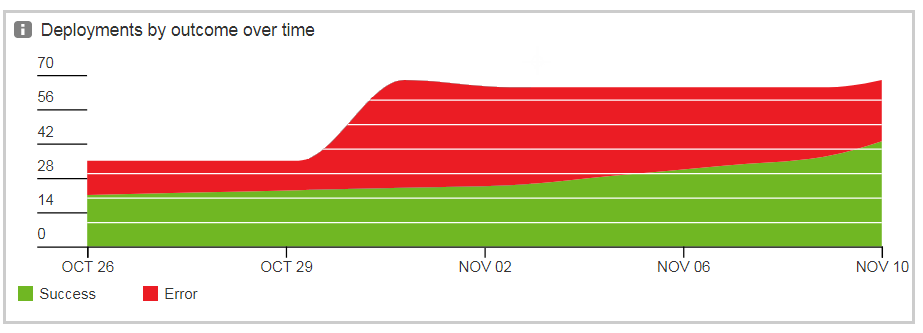
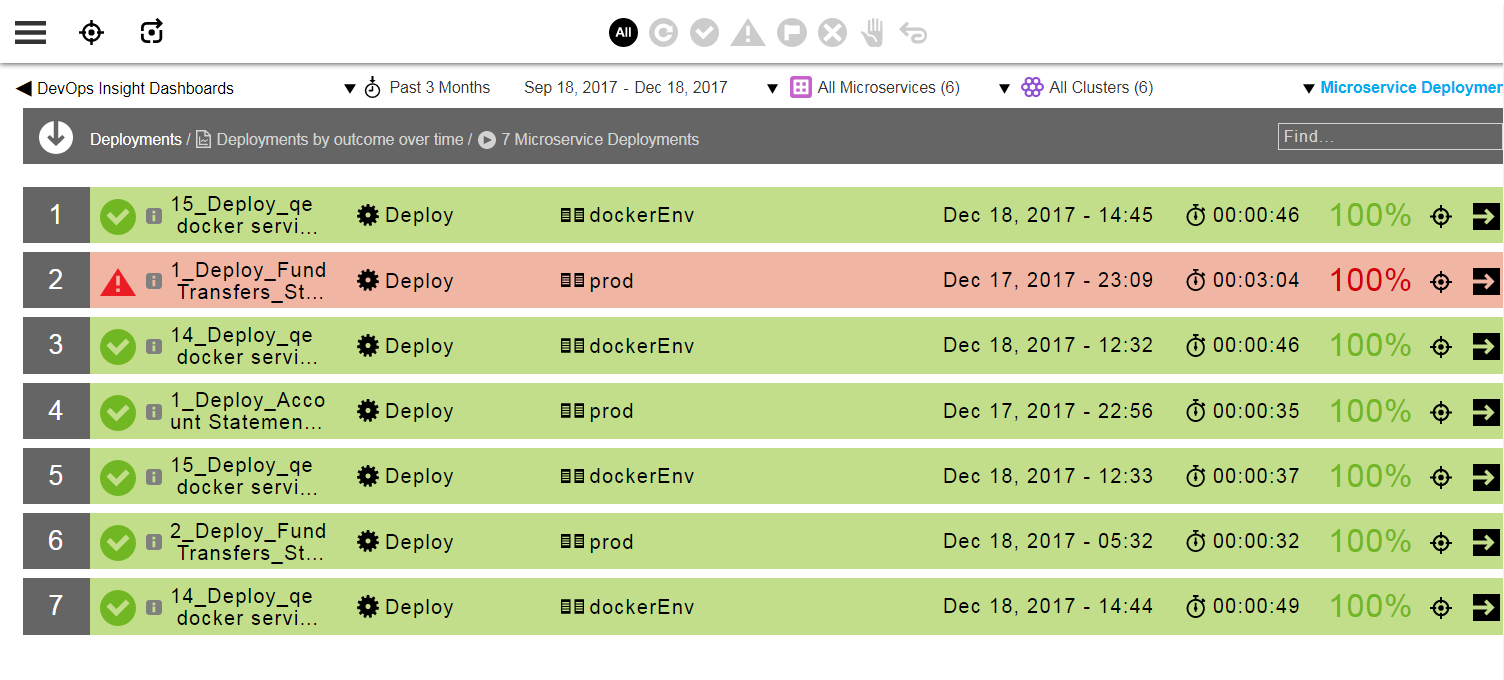
You can drill down into the Deployments by Outcome Over Time cell by clicking and dragging to select a date range. For example:
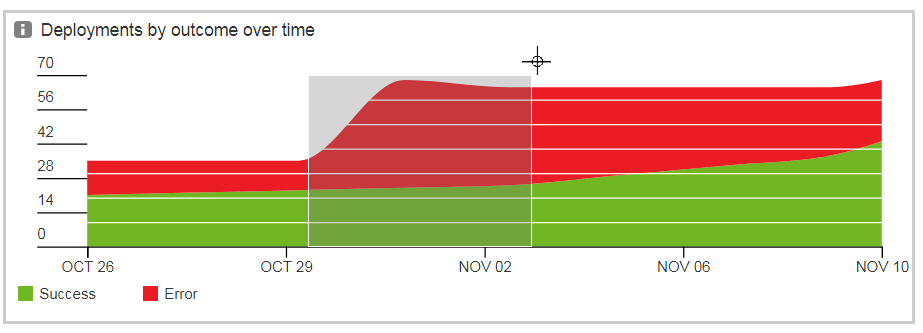
The microservice deployments for the selected date range appear on the Microservice Deployments page. For example:
Microservices With Most Failed Deployments
This report lists the microservices with the largest number of failed deployments. The list is limited to five microservices, which lets you focus on microservice teams that might need the most help.
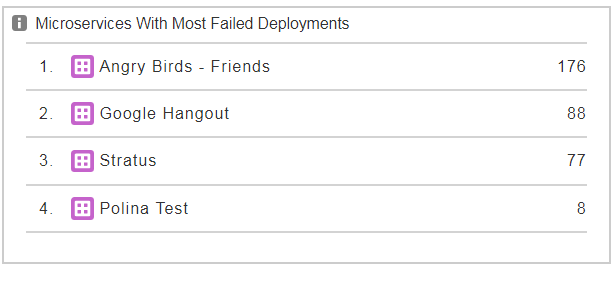
You can drill down into the Microservices With Most Failed Deployments cell by clicking a microservice. The Microservice Deployments page shows the failed deployments for the selected microservice.
Microservices With Most Deployments
The information in this report along with the earlier report “Microservices With Most Failed Deployments” lets you gain insight into the productivity of different microservice teams along with the reliability of delivery. The list is limited to five microservices.
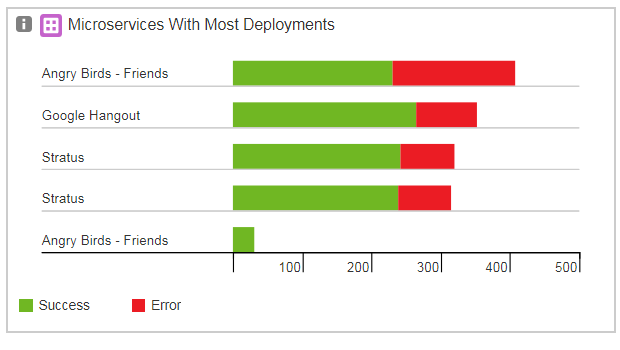
You can drill down into the Microservices With Most Deployments cell by clicking a microservice. The Microservice Deployments page shows the deployment breakdown based on the selected service and deployment outcome.
Clusters With Most Deployments
This chart shows the clusters with the most microservice deployments with a breakdown by deployment outcome. This presents information similar to the “Microservices With Most Deployments” report except it uses the microservice deployment clusters dimension.
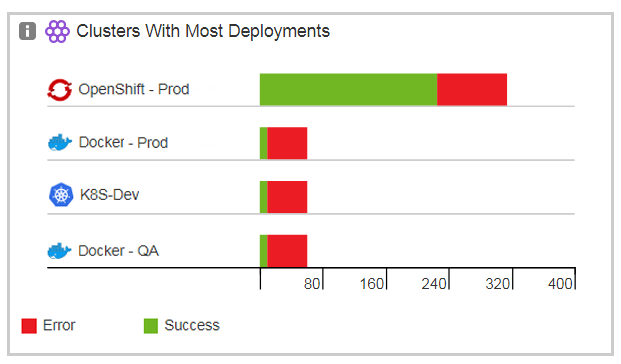
You can drill down into the Clusters With Most Deployments cell by clicking a cluster. The Microservice Deployments page shows the deployments based on the selected cluster and deployment outcome.