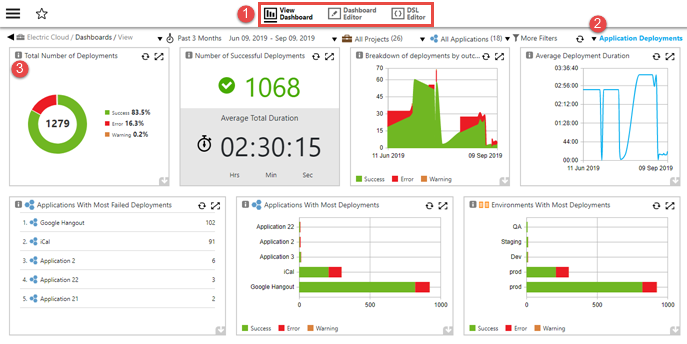
Click the DevOps Insight Dashboards button on the CloudBees Flow top banner to open DevOps Insight. Following is an example of a dashboard that appears after you open DevOps Insight:
| Where: | |
|---|---|
1 |
Viewing modes: View Dashboard –This mode provides the data and visualizations for which the dashboard was created. Dashboard Editor –This mode lets you make changes to any dashboard that you create. It also lets you make layout changes to the Application Deployments dashboard, the Microservice Deployments dashboard, and the Releases dashboard. Dashboards that you create are fully editable. The Deployments and Releases dashboards are editable in one way: you can move the widgets to change the layout of their corresponding cells. The out-of-the-box Release Command Center dashboard is not editable in any way (although you can create an editable copy of it). DSL Editor –For bundled dashboards, this mode lets you view their Domain Specific Language (DSL). For dashboards that you create, this mode lets you edit their DSL. |
2 |
Click to select a dashboard for viewing. |
3 |
Every cell in a dashboard contains an info button, which displays a tooltip that describes the data that appears in that cell. For dashboards that you create, you add the text for the tooltip that is displayed. |