CloudBees Flow provides multiple reports and custom report capabilities to help you manage your build environment.
-
Real-time reports—filtered view of your workload in real-time
-
Build reports—summary reports produced at the end of a build and attached to the job
-
Batch reports—summaries of your build environment with trends over time, two types:
-
Default Batch reports—automatically installed during CloudBees Flow installation and scheduled to run daily (Cross Project Summary, Variant Trend, Daily Summary, Resource Summary, Resource Detail)
-
Optional Batch reports—you can configure, rename, and schedule these reports to fit your requirements (Category Report, Procedure Usage Report, Count Over Time Report, Multiple Series Reports)
-
Custom reports—your choice to create and add at any time
You can use also StatsD and Graphite to generate custom reports. For more information, see System Health Monitoring .
Batch and Custom reports must be run on the CloudBees Flow server’s agent (local agent) only. These reports need the BIRT report engine, which is installed on the CloudBees Flow server.
Run reports on a non-local resource
If you want to configure reports to run on a non-local resource, do the following:
-
In the web interface, go to Projects > Electric Cloud > runReports > runEcrptdata.
-
Change the Parameter Resource from the default value “local” to the name of a different resource. the resource must have access to the plugins directory.
Real-time reports
Home page
The Home page is a user-customizable dashboard that can be configured to show you just the CloudBees Flow jobs you care about.
The Jobs Quick View section (on the right side of the Home page) shows jobs you define using filters on job properties. You can create multiple categories filtered on specific project names, procedure names, users, or any other job property. Summary details for the job "pop-up" if you hover your mouse over one of the jobs.
Jobs
Unlike the Home page, which allows you to see specific subsets of work, the Jobs page shows all jobs that are running and all jobs that have completed. This is a good report to view when you need to see a list of all jobs run by any user or schedule. System administrators and managers can use this page to monitor overall system throughput.
Job details / Step details
After a job starts, you can get execution details from the Job Details page. To view job details, click on the job from the Home page or the Jobs tab. From within the Job Details page you can drill down to see details for an individual step. This is the finest grain of reporting, showing the detailed results of a specific job.
Build reports using ecreport
CloudBees Flow includes a utility, ecreport , that summarizes build results and sends that summary through email. This customizable utility allows you to create a simple matrix based on results stored in properties and log files. Details such as SCM change logs and errors can be included.
In addition, you can attach your own reports to any job and have them show up as attachments to the Job Details Report. To attach custom reports, put them in the top-level workspace directory in a file that ends with " .html " and contains the string "report" or "Report." Names of all matching files are displayed in the Summary section in the upper right corner of the page. Click on a report name to view the report.
The following is an example of ecreport output:
ecreport extracts information about a particular job from the CloudBees Flow server and writes an HTML report to standard output The report is organized as a 2-dimensional table summarizing the results of steps in the job. The table layout can be customized by defining its format using the ectool (or ec-perl) --load option. Invoke the program in the top-level directory of the job’s workspace so it can access log file extracts in that workspace (or, use the --dir option).
The following options are available for use with the ecreport utility:
| Option | Description |
|---|---|
|
If specified and the job failed, the report will be emailed to each user mentioned in the updates file. The value of this option provides the subject line for the message (%s will be replaced with the job name). |
|
Name of file containing job data for the report. If specified, this data is used in place of querying the CloudBees Flow server. Used primarily for testing. |
|
Change to this working directory before doing anything else. |
|
Print this message and exit without doing anything. |
|
Identifier for the CloudBees Flow job to report on (required unless |
|
Name of a file containing Perl code to evaluate after option processing. Used primarily for debugging. There can be multiple |
|
The name of the Email Configuration to use when emailing the report. Defaults to "default". |
|
Email the report to this addresses. |
|
Value for the "Reply-To" field in emailed reports. |
|
Location of the CloudBees Flow server (hostname or hostname:port), to retrieve job data. Defaults to the COMMANDER_SERVER environment variable. |
|
Value for the "Subject" field in emailed reports. If the value contains a |
|
Name of a file containing information about recent updates reflected in the job. If specified, the contents of this file are included in the report. |
|
Print ecreport version number. |
|
Base URL for the CloudBees Flow Web server where the job was run, such as |
Example 1
ecreport --jobId $[/myjob/jobId] --load ./rptformat.pl --updates update.log --webRoot
https://myServer/commander > ecreport.html
This example writes a report to the file ecreport.html. Because this file has an .html extension, it will be displayed in the Reports section at the top of the Job Details page. The format of the table for this report is specified in rptformat.pl. An example of the contents from this file would be:
@::gTableRows = ( ["", "Windows", "Linux", "Solaris"], ["Extract", "span", "span", "update.log"], ["Compile", "windows-compile.log", "linux-compile.log", "solaris-compile.log"], ["Unit test", "windows-unittest.log", "linux-unittest.log", "solaris-unittest.log"], ["System test", "windows-systemtest.log", "linux-systemtest.log", "solaris-systemtest.log"]);
The “Recent Updates” report section is specified in update.log. The --webRoot argument defines the root for any URL that appears in the report. Example 2
ecreport --jobId $[/myJob/jobName] --load ./ecreportConfig.pl --mailto user1@example.com --replyto user2@example.com --subject 'Build Report' --updates updates.log --webRoot https://myServer/commander
This report will be sent as the body of an email message to user1@example.com with subject “Build Report”.
These reports are installed during the CloudBees Flow installation and automatically scheduled to run daily.
To access these reports: Select the Projects tab, then select the CloudBees project, then click the Reports subtab. This report collection graphs trends over time, including success/failure, build times, and resource consumption. These reports allow you to customize two levels of grouping into "variants." These variants may represent products, branches, locations, architectures, or any other descriptors you would like to use to group your workload.
After a Default Batch Report runs, a link for each report appears on the Job Details page in the Links section. When you select a report from the Links section, it will be displayed in full-screen view.
Report types
Cross Project Summary —Shows the status of multiple variants over the past 30 days. This high-level summary of each of the 30 days shows green, yellow, or red depending on the result of the best build of the day. The summary also shows average times, total invocations, and other data.
Variant Trend —Shows more details about a particular variant such as build outcome over time, build quantity over time, elapsed build times over time, and a list of actual jobs that ran during the period.
Daily Summary —Shows the most recent results of each variant, including the last successful build.
Resource Summary —Shows resource utilization over the last 24 hours. You can see which resources are idle and which resources are busy. CloudBees Flow has advanced features that allow you to select resources for your job at runtime, using late binding of property names. This feature provides unparalleled flexibility and control over your environment, but could make it difficult to find out which resources were used. This report provides the visibility you need into resource loading.
Resource Detail —Shows the utilization of a particular resource over the course of one day.
Wait Time —Shows cumulative wait time due to license, resource, and workspace waits. It also shows the number of steps that were delayed for any of those reasons.
Default Batch Reports
-
Cross Project Summary
-
Variant Trend
-
Daily Summary
-
Resource Summary
-
Resource Detail
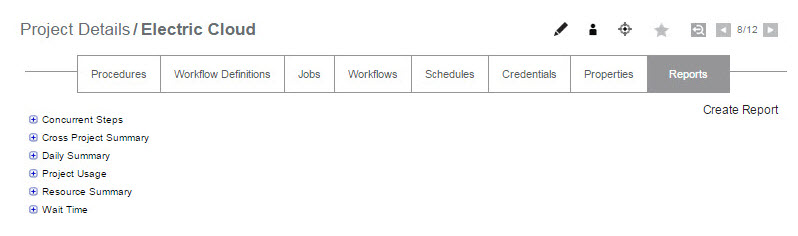
The navigation tree on the left-side of the screen allows you choose the report and date of interest. These reports, which show long term trends over all projects and resources, are run from the runReports procedure in the Electric Cloud project.
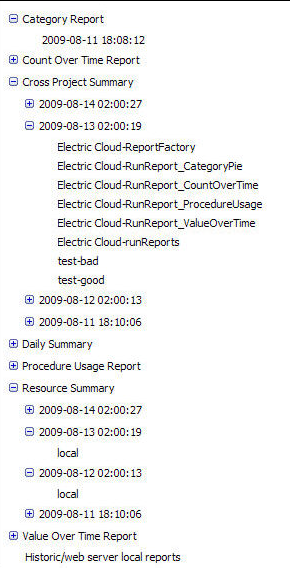
The following example shows the Default Batch Reports, the historical reports link, and Optional Batch Reports (described below). Notice that you can expand a selected report to three levels. The third level represents drill-down links available within that report. In addition, if you click on a report name, the most current report is displayed.
You may change the number of reports displayed under each report type. Locate the propertySheet named ec_reportConfiguration on the project or server (project overrides server) and find the "groupings" section. Next, you can create nested property sheets under ec_reportConfiguration with the properties groupingName, sortDirection, and limit. If you set this information using ectool, you will also see it on CloudBees Flow’s web interface .
If the ec_reportConfiguration propertySheet does not exist, you will need to create it, then copy the example below into the propertySheet.
Example:
ectool setProperty ec_reportConfiguration/reportDaysLimit --value 90 --projectName foo
ectool setProperty ec_reportConfiguration/groupings/1/groupingName --value reportType --projectName fooectool setProperty ec_reportConfiguration/groupings/1/sortDirection --value ascending --projectName fooectool setProperty ec_reportConfiguration/groupings/1/limit --value 100 --projectName foo
ectool setProperty ec_reportConfiguration/groupings/2/groupingName --value reportDate --projectName fooectool setProperty ec_reportConfiguration/groupings/2/sortDirection --value descending --projectName fooectool setProperty ec_reportConfiguration/groupings/2/limit --value 5 --projectName foo
ectool setProperty ec_reportConfiguration/groupings/3/groupingName --value reportResource --projectName fooectool setProperty ec_reportConfiguration/groupings/3/sortDirection --value ascending --projectName fooectool setProperty ec_reportConfiguration/groupings/3/limit --value 100 --projectName foo
This example explicitly defines the default behavior for project foo’s reports.
The 1, 2 and 3 propertySheets define the order of the groupings. The actual names 1, 2, 3, could be anything as long as they are listed alphanumerically in the order you need.
Additionally, any groupings that do not exist will be skipped during output. For example, if you added a reportRunByUser grouping #4 and added it to some reports that define reportType="User Builds", reportDate, and reportRunByUser properties (but not reportResource ), you would get something similar to a resource usage report structure with users rather than resources at the deepest level.
| Displaying 500 or more reports at a time might degrade performance. |
Advanced reporting information—ecrptdata
How are default batch reports generated?
Reports are scheduled as part of a special procedure, runReports, in the CloudBees project. This procedure has one step, runEcrptdata, that runs the ecrptdata program. This program reads data from CloudBees Flow, summarizes it for reports, and generates HTML reports using the BIRT reporting engine. The program takes input parameters. During installation, reporting is configured as follows:
` ecrptdata --end yesterday --grain 300 --debug 2 --reports all `
By default, all reports are run every day at 2am. The Cross Project Summary and Variant Trend shows data from the previous 30 days. The Daily Summary, Resource Summary, and Resource Detail reports show data from the last full day (yesterday). You can adjust the schedule to run more often or at different times by altering the "Report Schedule" schedule in the CloudBees project.
Changing the report time period
If you would like to alter the report time period, you must change the input parameters to the ecrptdata program within the procedure step "Electric Cloud:runReports:runEcrptdata". Select the Ecrptdata step name to go to the Edit Step page. Make the changes you need in the Parameters section.
If the --end option is omitted, the end of the reporting period is the time when the report runs (now). If the keyword "yesterday" is provided, reports will include full data for yesterday. Otherwise, a specific date and time can be given in the format "YYYY-MM-DDTHH:MM:SS".
Changing the report grouping
You can tell CloudBees Flow how to group the Cross Project Summary and Variant Trend reports. By default, the outer grouping is "Project Name" and the inner grouping is "Procedure Name." To change these groupings, use the following ecrptdata options:
|
Set the column header for the first column of the Cross Project Summary report to "xxxx". |
|
Use property "yyyy" as the name to group on in the first column of the Cross Project Summary report. |
All lookups are done with respect to an individual job and will be converted to absolute property paths. The values projectName, procedureName, and jobId are set in context for the job being examined.
Examples:
` /myProject/foo` will be converted into the API call "ectool getProperty /projects/ projectName /foo"
` /myProcedure/foo` will be converted into the API call "ectool getProperty
` /projects/projectName/procedures/procedureName/foo"`
` /myJob/foo` will be converted into the API call >"ectool getProperty /jobs/jobId/foo"
` /myParameter/foo` will be converted into the API call "ectool getActualParameter foo –jobId jobId"
To show the value of the procedure name as the outer grouping and the value of the parameter "branch" as the inner grouping, use the following ecrptdata options:
` --group1Name Procedure --group1Property "/myProcedure/procedureName" --group2Name Branch --group2Property /myParameter/branch`
The /myParameter "shortcut" to the property path was created specifically for ecrptdata only—it cannot be used as other "/my" property shortcuts are used. For more information on property shortcuts, see the Properties Help topic. In addition, when working with ecrptdata, any /my value is case-insensitive. For example, you can use /myParameter or /myparameter.
|
Filtering
ecrptdata supports "findObjects" type filters when searching for jobs and job steps.
This feature is implemented with two new command line switches: "--jobFilter <property, operator, operand>" and "--stepFilter <property, operator, operand>". The jobFilter option filters the CrossProjectSummay, DailySummary, and VariantTrend reports. The stepFilter option filters the ResourceSummary and ResourceDetail reports.
Examples:
--jobFilter "branch,isNotNull,1"
--jobFilter "jobName,like,my-procedure%"
--stepFilter "outcome,notEquals,aborted"
Adding additional data columns to the report
You can add custom data columns to each report. These columns are specified by providing a comma separated list of property references in the following ecrptdata options:
|
sets extra columns for the Cross Project Summary Report |
|
sets extra columns for the Variant Trend Report |
|
sets extra columns for the Daily Summary Report |
|
sets extra columns for the Resource Summary Report |
|
sets extra columns for the Resource Detail Report |
You must choose properties appropriate for the type of report and grouping you have chosen. For example, if you choose Project Name and Procedure Name for your groupings in the Cross Project Summary report, each line of the report will be in the context of a project or procedure.
You can add extra columns to show properties on the project or procedure, but it would not make sense to show properties on a resource, job, or job step. For resource reports, the properties must be in the context of a resource.
The column header is the name of the property. Examples:
` --crossProjectProperties "/myproject/QA_State,/myprocedure/PartNumber" `
` --resourceSummaryProperties "/myresource/OS,/myresource/Architecture"`
Secure login
ecrptdata provides options for secure login to the CloudBees Flow server. There are three ways to login:
-
Use both the
"--user <user>"and"--pass <password>"options.This method is not secure… the password will be in plain text and visible to others.
-
If you omit the
"--pass <password>" ` option, the password will be read from `stdin.You can then read the password from a secure file or from a stored credential. For example:
cat mySafePasswordFile.txt | ecrptdata --user <user> …ectool getFullCredential myCred --value password | ecrptdata --user <user> … -
Another option,
"--credential <credentialName>", allows you to specify a credential name.If you use this option,
"--user <user>"and"--pass <password>"are ignored. The credential must be attached to the runReports job step. Both the user and password are retrieved from the credential.
Logic:
-
If
--credentialis used, attempt to lookup credential and extract user and password -
If user is not set, return
error -
If password is not set, read from
stdin -
Attempt to login to server specified in
--server <server>option using user and password
Additional reports are available, but these reports are not scheduled to run by default. You can schedule these reports to suit your purpose.
| When you run an Optional Batch Report, a link for each report appears on the Job Details page in the Links section. When you select a report from the Links section, it is displayed in full-screen view. The following optional reports are available: |
-
Category Report
-
Procedure Usage Report
-
Count Over Time Report
-
Multiple Series Report (formerly known as the "Value Over Time" report)
These reports are available from the Reports tab on the Project Details page for your Project. For the Category, Count Over Time, and Multiple Series reports, a View Search Results link is available at the bottom of the report if a Saved Filter was used to generate the report.
Creating a Report Job
CloudBees Flow runs reports as a job, so reports can be managed like any other job. To create a report for your project:
-
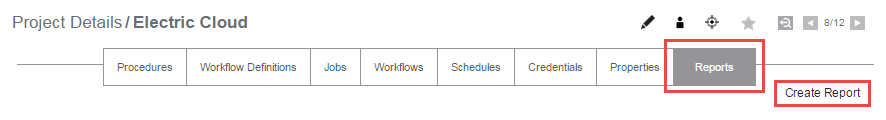
Go to the Project Details page for your selected project.
-
Select the Reports subtab.
-
Click the Create Report link.
After clicking Create Report, the next screen is displayed with the default values for the selected tab ( Multiple Series) in this example.
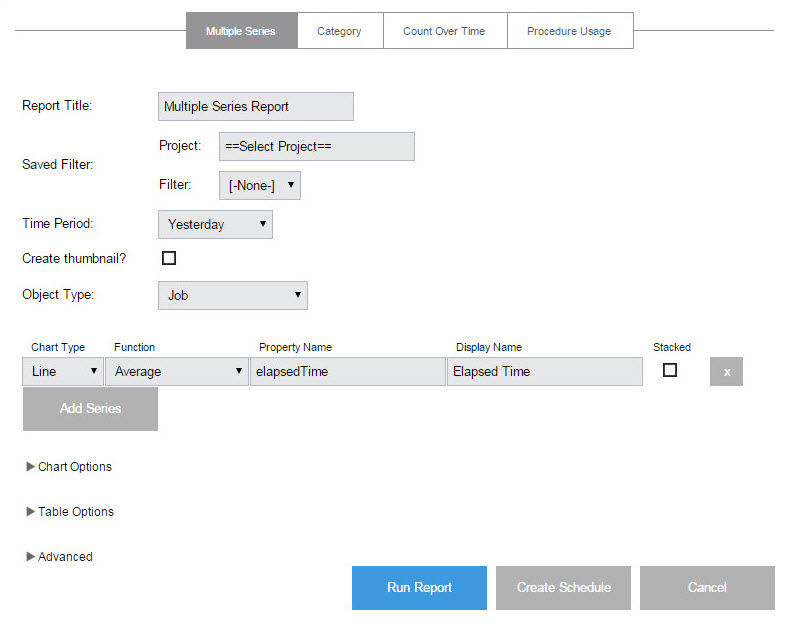
Enter information in the fields or select the appropriate values as follows:
-
Report Title—Your report title. Type over the default report name, choosing any unique name for your report. We supplied Basic Build Report for our report name.
-
Saved Filter:
-
Project—Click your mouse inside this field to see a list of projects from which to make a selection. We select our FirstNewProject project name.
-
Filter—Use the BasicBuildFilter we created earlier.
-
Time Period—Use the drop-down menu to select the time period.
-
Create thumbnail?—Check this box so you can view this report on your Home page. (We will create a “thumbnail” report view on your Home page at the end of this scenario.)
-
Object Type—Use the drop-down menu to select Job for this example.
-
Table column choices:
-
Chart Type—Use the drop-down menu to choose the chart type.
-
Function—Use the drop-down menu to choose the function you need.
-
Property Name—Use the default property value or delete the text and click your mouse in the blank field to see a list of possible properties. We chose "outcome" for this example.
-
Display Name—You can choose a different unique Display Name if you prefer to do so.
-
Stacked—Select this check box to see your report results "stacked" versus overlaid.
-
The "X" icon—Click this icon to delete any row you no longer need.
-
Select the Add Series button if you would like to create additional table entries for additional report information.
-
Chart Options—Use the down-arrow to adjust the Time Grouping and see the defaults for the X and Y axis.
Buttons at the bottom of the page:
-
Run Report button—this button takes you to the Job Details page to run the report immediately—one time only.
-
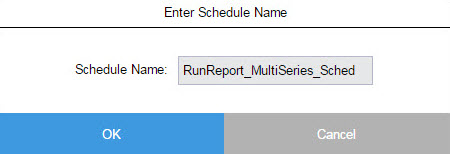
Click the Create Schedule button—this button displays a box with a default schedule name you can change.
-
Enter a name for the schedule, Basic Build Report Schedule —again, we tied the schedule name to the procedure name for which we want the report.
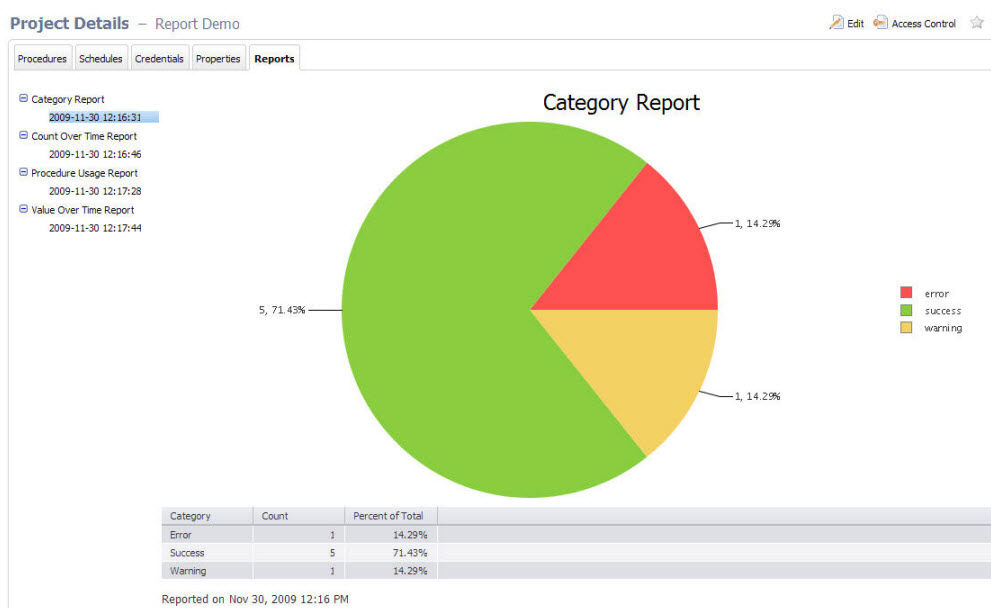
Viewing the report
After the report job runs, view the report by selecting the Reports subtab within the project. Note: All reports are viewed from within a project context. If you have reports that span multiple projects, run them from the CloudBees project or create a project to store summary reports.
After selecting the Reports subtab, see the navigation tree on the left-side of the page. This tree allows you to select the report you want to view. The report tree contains three levels.
-
Report Title—Click the "+" icon next to the report type to see available report versions.
-
Report Date—Click this link to see report details.
| Click the report type to display the most recent report version. |
Optional Batch report examples
Category sample report
Creating this report on the Run Procedure page:
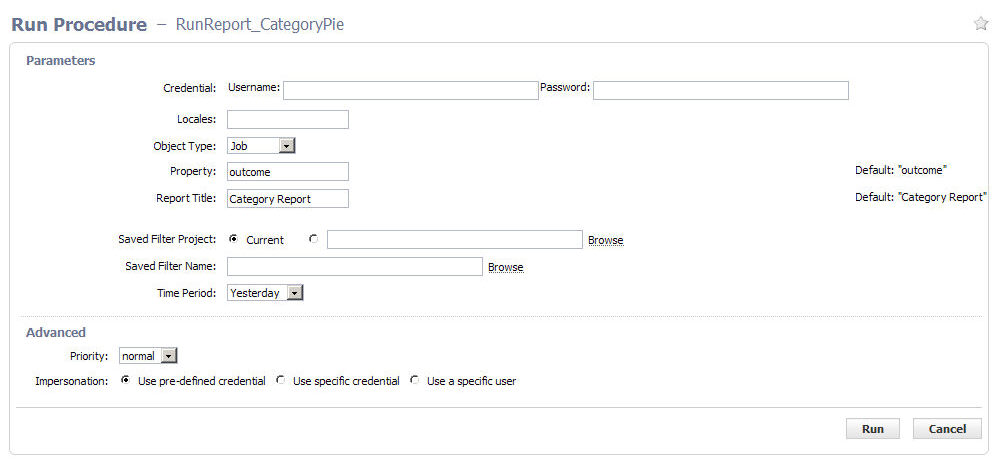
Field descriptions:
-
Credential—these are credentials to be used when collecting data. If no credentials are specified (Username/Password remain blank), the report runs with the privileges of the project from where it is run. If credentials are supplied, the data is collected using the CloudBees Flow user security access in the credential. Use credentials when you want to access data outside of your project.
-
Locales -a comma separated list of locales where you would like to render the report. Locale is specified as one or more of the following:
en,zh,ja, orko, which translate respectively to English, Chinese, Japanese, or Korean. If no locale is specified, the default is to use the locale of the CloudBees Flow server. For example, a server already set for Chinese will see reports in Chinese with no other changes required. Note: Currently, CloudBees Flow supports four locales only. -
Object Type—the type of object to search (default job)
-
Property—the property of interest (default outcome) and must be a valid property for the object type selected
-
Report Title—your report title (default Category Report)
-
Saved Filter Project—select "Current" or Browse to find the project where you want to save this filter.
-
Saved Filter Name—the name of a saved filter to use when filtering collected data.
Use the Search tab to create the filter. After entering your search criteria, click OK. If the preview displays the data you want, click Save Filter and provide a Project Name and Filter Name to specify where the filter is saved. On the Run Report parameters page, select the filter. If you leave the Filter Name blank, no filtering is performed.
"Saved filters" can filter on start and end times. Because start and end times are specified in the Time Period parameter, there is a possibility you could select a combination of filter date and time periods that exclude all data. For example, you could select a time period of "Yesterday" and a filter of Start=less than Jan 1, 1900. To avoid this problem, we recommend you do NOT include dates or times in your filter.
-
Time Period—these are keywords to define the report start and end times. The range is used to filter collected data. All values are in the local time zone.
-
Today—midnight until now
-
Yesterday—previous full day
-
This week—from the start of the previous Sunday until now
-
Last week—from Sunday to Sunday of the last complete week
-
This month—from the start of the first of this month until now
-
Last month—from the last complete calendar month, which means on January 3rd the last full month is all of December
-
This year—from January 1st until now
-
Last year—all of last year (Jan 1 to December 31)
-
All—all dates until now
-
Procedure Usage Sample Report
For a specific procedure, this report shows procedures called by the procedure and which procedures it called.
Creating this report on the Run Procedure page:
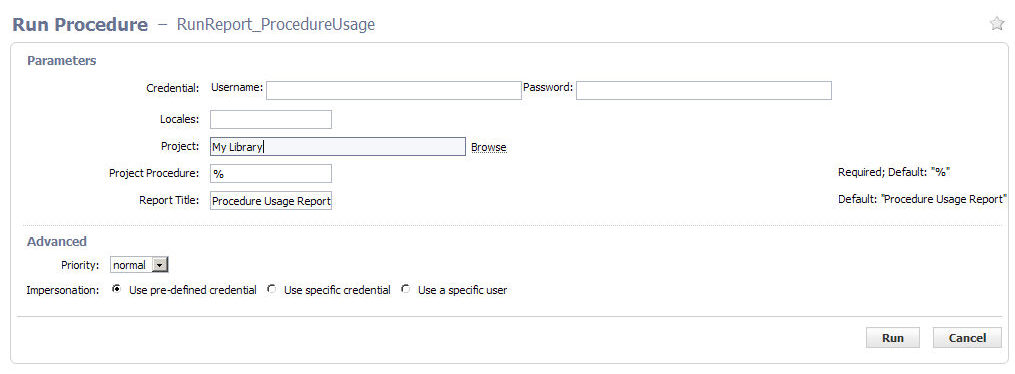
Field descriptions:
-
Credential—these are the credentials to use for collecting data. If no credentials are specified (Username/Password remain blank), the report runs with the privileges of the project from where it is run. If credentials are supplied, data is collected using the CloudBees Flow user security access in the credential. Use credentials when you want to access data outside of your project.
-
Locales—a comma separated list of locales where you would like to render the report. Locale is specified as one or more of the following:
en,zh,ja, orko, which translate respectively to English, Chinese, Japanese, or Korean. If no locale is specified, the default is to use the locale of the CloudBees Flow server. For example, a server already set for Chinese will see reports in Chinese with no other changes required. CloudBees Flow supports four locales. -
Project—this is the name of the project where you want to install the report.
-
Project Procedure—enter a project procedure. "called" and "called by" data is shown for that project/procedure combination. You can use "wildcards." For example, to see data for ALL projects and procedures, enter the
%character in each field. -
Report Title—this is the title of the report
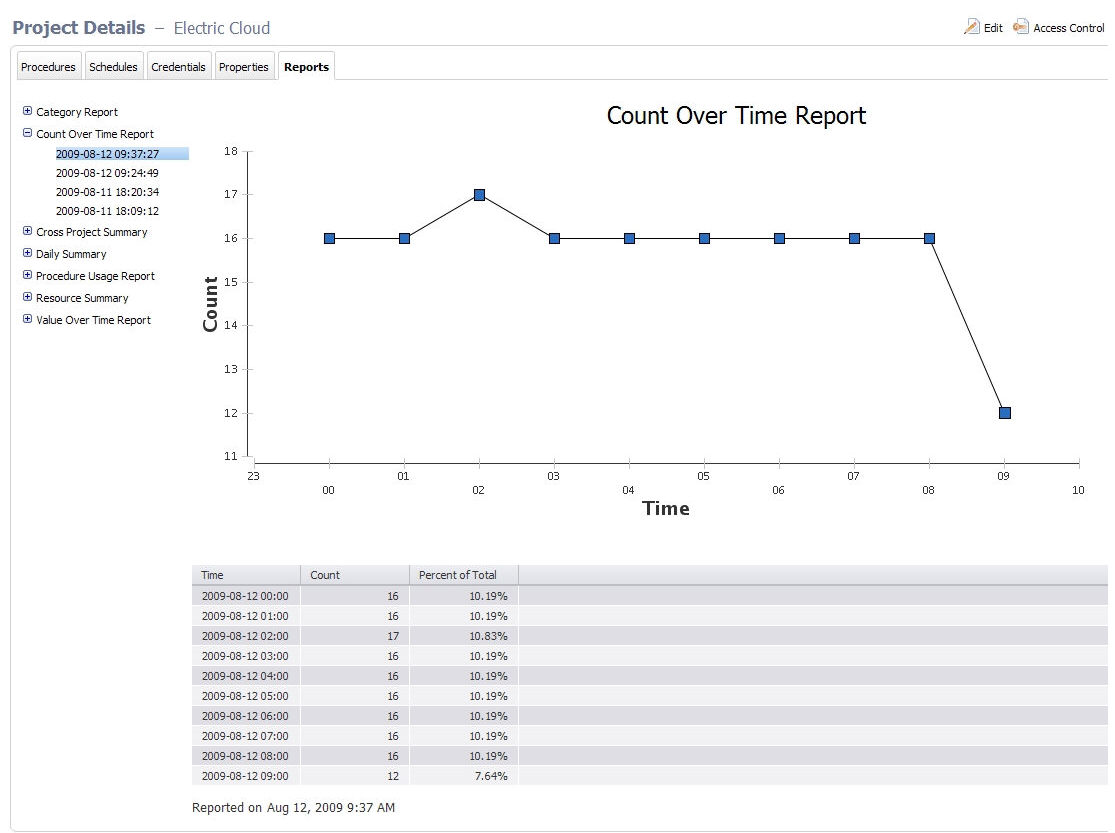
Count Over Time Sample Report
This report shows search results from counting multiple job, job step, or resource objects within the selected time range. For example, this report counts the number of occurrences for the specified object-type over the selected time range—if a filter exists, it will be applied. This report does not aggregate the value (use ValueOverTime if you want aggregation), each occurrence counts as one.
| Generating large numbers of datapoints can exceed BIRT’s charting capability. |
Creating this report on the Run Procedure page.
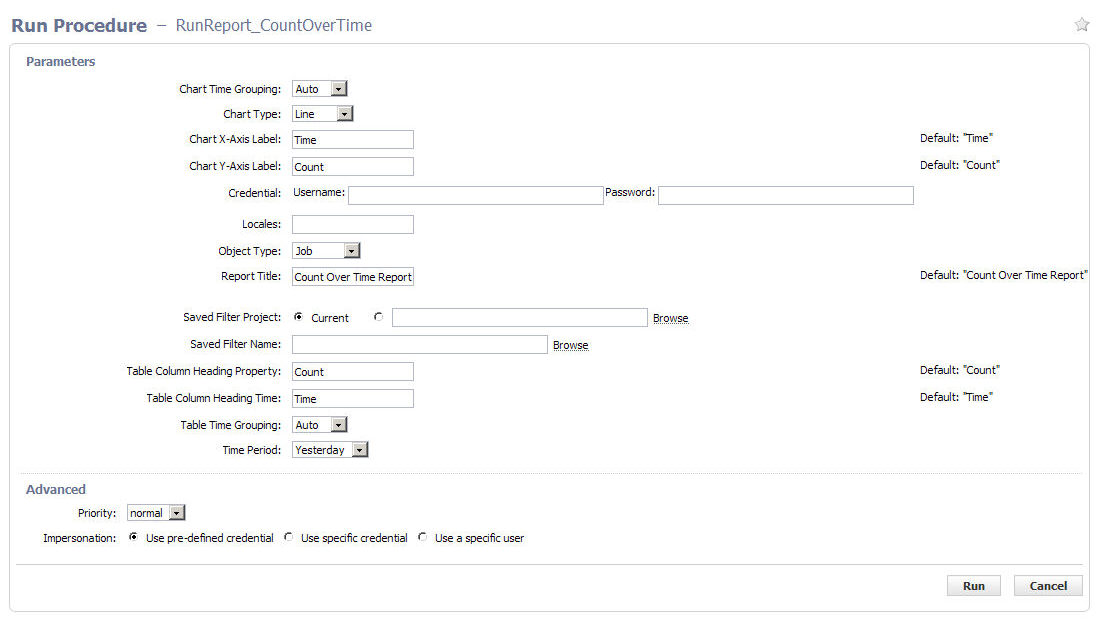
Field descriptions:
-
Chart Time Grouping—these are: Auto (default), Minute, Hour, Day, Week, Month, or Year
-
Chart Type—these are: Line (default), Bar, Cone, Tube, Triangle, or Area
-
Chart X-Axis Label—the text to display on chart x-axis (default Date)
-
Chart Y-Axis Label—the text to display on chart y-axis (default Count)
-
Credential—credentials to be used when collecting data. If no credentials are specified (Username/Password remain blank), the report runs with the privileges of the project from where it is run. If credentials are supplied, the data is collected using the CloudBees Flow user security access in the credential. Use credentials when you want to access data outside of your project.
-
Locales—a comma separated list of locales where you would like to render the report. Locale is specified as one or more of the following:
en,zh,ja, orko, which translate respectively to English, Chinese, Japanese, or Korean. If no locale is specified, the default is to use the locale of the CloudBees Flow server. For example, a server already set for Chinese will see reports in Chinese with no other changes required. Currently, CloudBees Flow supports four locales only. -
Object Type—the type of object to search (default job)
-
Report Title—your report title (default Count Over Time Report)
-
Saved Filter Project—select "Current" or Browse to find the project where you want to save this filter.
-
Saved Filter Name—the name of a saved filter to use when filtering collected data. Use the Search tab to create the filter. After entering your search criteria, click OK. If the preview displays the data you want, click Save Filter and provide a Project Name and Filter Name to specify where the filter is saved. On the Run Report parameters page, select the filter. If you leave the Filter Name blank, no filtering is performed.
-
"Saved filters" can filter on start and end times. Because start and end times are specified in the Time Period parameter, there is a possibility you could select a combination of filter date and time periods that exclude all data. For example, you could select Time Period of "Yesterday" and a filter of Start=less than Jan 1, 1900. To avoid this problem, CloudBees recommends you do NOT include dates or times in your filter.
-
Table Column Heading Property—the table heading for the right column (default Count)
-
Table Column Heading Time—the table heading for the left column (default Date)
-
Table Time Grouping—these are: Auto (default), Minute, Hour, Day, Week, Month, Year
-
Time Period—these are keywords to define the report start and end times. The range is used to filter collected data. All values are in the local time zone.
-
Today—midnight until now
-
Yesterday—previous full day
-
This week—from the start of the previous Sunday until now
-
Last week—from Sunday to Sunday of the last complete week
-
This month—from the start of the first of this month until now
-
Last month—from the last complete calendar month, which means on January 3rd the last full month is all of December
-
This year—from January 1st until now
-
Last year—all of last year (Jan 1 to December 31)
-
All—all dates until now
-
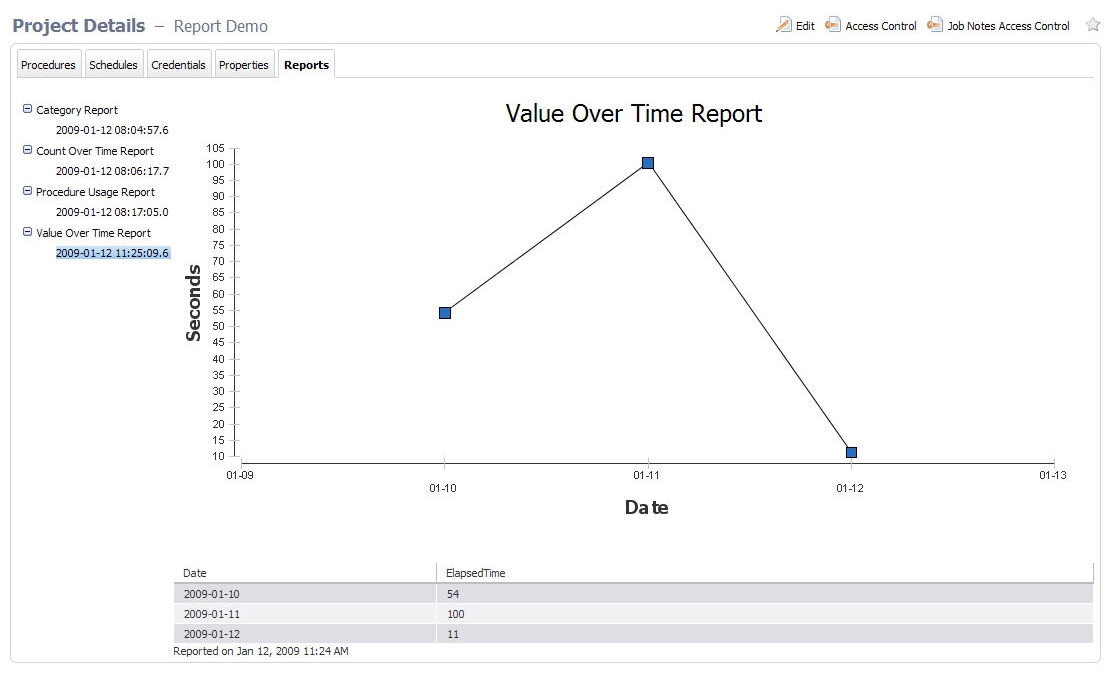
Multiple Series Report
This reports shows the cumulative value of a property over time. This report should be run against properties that contain numbers. (Use the Count Over Time report if your property contains string values.) You can specify the function to use for aggregating values (sum, count, average). For example: Assume a property that contains the number of failed unit tests is stored on each job. Using the Multiple Series report, you can see the failure trend over time.
Creating this report on the Run Procedure page:
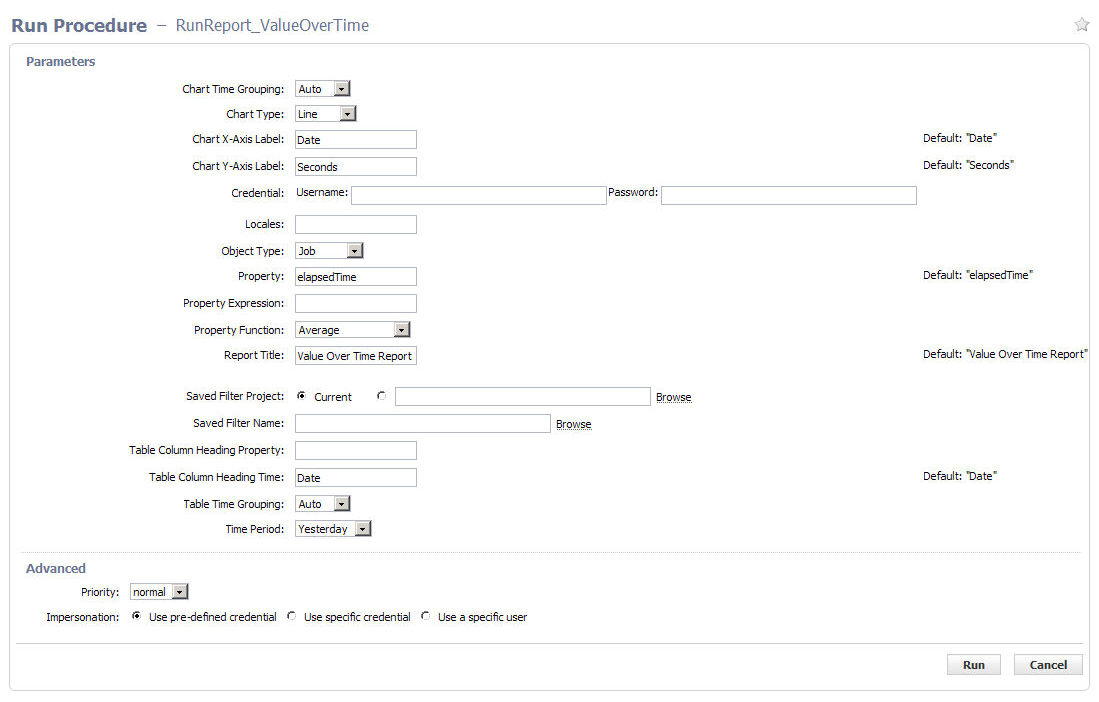
Field descriptions:
-
Chart Time Grouping—these are: Auto (default), Minute, Hour, Day, Week, Month, or Year
-
Chart Type—these are: Line (default), Bar, Cone, Tube, Triangle, or Area
-
Chart X-Axis Label—the text to display on chart x-axis (default Date)
-
Chart Y-Axis Label—the text to display on chart y-axis (default Count)
-
Credential—these are credentials to be used when collecting data. If no credentials are specified (Username/Password remain blank), the report runs with the privileges of the project from where it is run. If credentials are supplied, the data is collected using the CloudBees Flow user security access in the credential. Use credentials when you want to access data outside of your project.
-
Locales—a comma separated list of locales where you would like to render the report. Locale is specified as one or more of the following:
en,zh,ja, orko, which translate respectively to English, Chinese, Japanese, or Korean. If no locale is specified, the default is to use the locale of the CloudBees Flow server. For example, a server already set for Chinese will see reports in Chinese with no other changes required. CloudBees Flow supports four locales. -
Object Type—the type of object to search (default job)
-
Property—the property of interest (default outcome) and must be a valid property for the object type selected
-
Property Expression—an optional mathematical function to apply to your data. For example, elapsed time is recorded in milliseconds. To make a useful report with elapsed times, you may want to show seconds, so this field would be entered as "/1000".
-
Property Function—the following list contains the aggregation functions to use for data in the chart and table.
Count
Median
Count Distinct
Mode
First
Std Deviation
Last
Sum
Min
-
Report Title—your report title (default Value Over Time Report)
-
Saved Filter Project—select "Current" or Browse to find the project where you want to save this filter.
-
Saved Filter Name—the name of a saved filter to use when filtering collected data.
Use the Search tab to create the filter. After entering your search criteria, click OK. If the preview displays the data you want, click Save Filter and provide a Project Name and Filter Name to specify where the filter is saved. On the Run Report parameters page, select the filter. If you leave the Filter Name no filtering is performed.
"Saved filters" can filter on start and end times. Because start and end times are specified in the Time Period parameter, there is a possibility you could select a combination of filter date and time periods that exclude all data. For example, you could select Time Period of "Yesterday" and a filter of Start=less than Jan 1, 1900. To avoid this problem, CloudBees recommends you do NOT include dates or times in your filter.
-
Table Column Heading Property—the table heading for the right column (default Count)
-
Table Column Heading Time—the table heading for the left column (default Date)
-
Table Time Grouping—these are: Auto (default), Minute, Hour, Day, Week, Month, Year
-
Time Period—these are keywords to define the report start and end times. The range is used to filter collected data. All values are in the local time zone.
-
Today—midnight until now
-
Yesterday—previous full day
-
This week—from the start of the previous Sunday until now
-
Last week—from Sunday to Sunday of the last complete week
-
This month—from the start of the first of this month until now
-
Last month—from the last complete calendar month, which means on January 3rd the last full month is all of December
-
This year—from January 1st until now
-
Last year—all of last year (Jan 1 to December 31)
-
All—all dates until now
-
The CloudBees Flow batch mode reports which, by default, run once each night and are accessed through the Reports tab [in the CloudBees project] in the web UI. These reports are built using a combination of the CloudBees Flow API and the BIRT Report Designer tool. BIRT is an open source Eclipse-based reporting system you can use to create your own custom reports, or modify existing CloudBees Flow reports. This section describes how to write your own custom report and integrate it into CloudBees Flow.
There are several steps to using BIRT to create reports:
-
Create an XML file with data using the CloudBees Flow Perl API
-
Design a report using BIRT RCP Report Designer
-
Run the report with the BIRT Report Engine
-
View the report from within CloudBees Flow
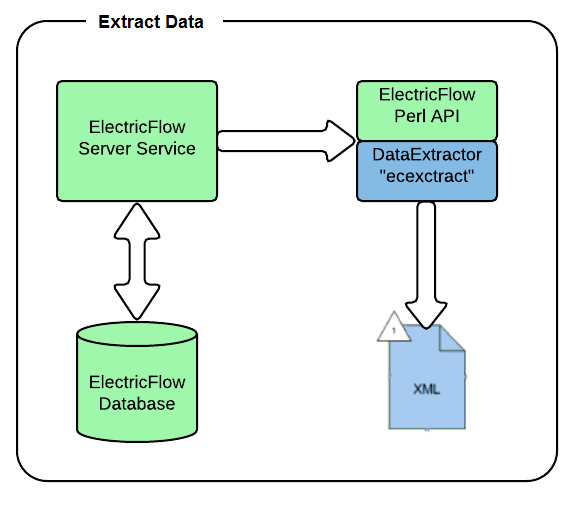
Data extraction
To begin creating a custom report, you must first extract report data from CloudBees Flow and move it into a standalone XML file. The recommended way to create the XML file is to use the CloudBees Flow ecextract utility program, which is derived from the Perl API. The benefits of using ecextract to create XML files are:
-
Security—
ecextractenforces all CloudBees Flow security and ACLs. (Direct DB access does not honor ACLs.) -
Maintainability—
ecextractis supported by CloudBees, including backward compatibility and insulates you from database schema changes. -
Simplicity—
ecextractprovides easy-to-use search and filtering options. Because of the complex nature of our schema, particularly for properties, it may be difficult to create custom SQL statements. -
Reuse—You may find that XML files created by built-in reports already contain all the data you need. If you simply want to present data differently or "slice" the data in a different way, you can reuse the XML from the existing built-in reports.
If you already use ectool or Perl for data extraction, and have already created the scripts you need for custom reports, you may continue to use those scripts. However, we recommend using ecextract if you are new to creating custom reports.
|
Using ecextract.pl for data extraction
A Perl program, ecextract.pl, is provided so you do not have to write Perl code—or you can use it as a starter for your own Perl API calls. This script allows you to specify the most common query types on a command line and generates an XML file. The following table lists currently available ecextract arguments:
Usage: ecextract [options]
Data Extract Options: |
|
` --type job|jobStep|resource` |
The object type to query. |
` --property [label=]property` |
Add a property to the output. If label is specified, it is used as the XML tag name instead of the property name. |
` --filter property, operator, operand1 [,operand2]` |
Add a property filter to the query. |
` --savedfilter filterName` |
Use a saved filter (ignores |
` --period period` |
The time period. One of: today, yesterday, thisweek, lastweek, thismonth, lastmonth, thisyear, lastyear, all, window, <number of days>, or range,<start-time>,<end-time> Range start, end time is date in ISO 8601 format: YYYY-MM-DDTHH:MM:SS[Z]If the date ends with 'Z', it is considered to be GMT time, otherwise the local timezone is used. |
` --sort property, order` |
Add a sort to the query. Order is either 'ascending' or 'descending'. |
` --outputPath` |
Path and name of output file. Default is |
` --max` |
Maximum number of objects to return. |
Server Communication Options: |
|
` --server server` |
Address for the CloudBees Flow server. Defaults to the value of the COMMANDER_SERVER environment variable. If it does not exist, defaults to localhost. |
` --port port` |
HTTP listener port on the server. Defaults to 8000. |
` --securePort port` |
HTTPS listener port on the server. Defaults to 8443. |
` --secure 0|1` |
If set to true, HTTPS is used to communicate with the server. Defaults to true. |
` --timeout seconds` |
Set the number of seconds for the timeout. Defaults to 280. |
Login Options: |
|
` --user user` |
CloudBees Flow login user. |
` --pass password` |
Password for login user. |
` --credentialName` |
Credential name (valid only when running inside a job step). |
Global Options: |
|
` --help` |
Print this message and exit without doing anything. |
` --version` |
Debug level. 0—errors only 1—0 + System progress 2—1 + Property Warnings 3 and higher give detailed diagnostics |
Plugin File Options: |
|
` --load loadFile` |
Plugin perl program to execute |
` --` |
Stop processing ecextract options. Allows plugins to process their own options following this option. |
ecextract.pl is part of the EC-Reports plugin—this script is located in the "agent/bin" directory of the EC-Reports plugin.
--property
Properties can be specified as high-level values ( --property propertyName ), properties in a sheet ( --property sheet1/sheet2/propertyName ), or as relative paths ( --property /myProject/propertyName ).
--filter
Each entry consists of a property name to test and an operator to use for comparison. The property can be an intrinsic property defined by CloudBees Flow or a custom property added by the user. Each operator takes zero or one operand to compare against the desired property.
The operators are:
contains, equals, greaterOrEqual, greaterThan, in, lessOrEqual, lessThan, like, notEqual, notLike, isNotNull, isNull
Example: --filter jobName,equals,Hello
Examples
The following 3 examples contain the script input and the output.
Example 1: Find properties on job steps for one day in April
ec-perl ecextract.pl ^ ` --user report ^` ` --pass report ^` ` --server localhost ^` ` --outputPath jobStepOut.xml ^` ` --type jobStep ^` ` --max 1000 ^` ` --property jobId ^` ` --property finish ^` ` --property jobStepId ^` ` --property stepName ^` ` --property status ^` ` --property outcome ^` ` --property runTime ^` ` --property waitTime ^` ` --filter jobName,like,commander-2.2%% ^` ` --filter createTime,greaterOrEqual,2008-04-01T00:00:00.000Z ^` ` --filter createTime,lessOrEqual,2008-04-02T00:00:00.000Z ^` ` --sort jobId,descending`
Output from example 1
<?xml version="1.0" encoding="utf-8"?>
<response>
` <object objectType="jobStep" objectId="jobStep-3511785">`
` <jobId name="jobId">4fa765dd-73f1-11e3-b67e-b0a420524153</jobId>`
` <finish name="finish">2009-04-01T23:54:45.424Z</finish>`
` <jobStepId name="jobStepId">4fa765dd-73f1-11e3-b67e-b0a420524153</jobStepId>`
` <stepName name="stepName">Setup</stepName>`
` <status name="status">completed</status>`
` <outcome name="outcome">success</outcome>`
` <runTime name="runTime">0</runTime>`
` <waitTime name="waitTime">922</waitTime>`
` </object>`
` <object objectType="jobStep" objectId="jobStep-3511915">`
` <jobId name="jobId">4fa765dd-73f1-11e3-b67e-b0a420524153</jobId>`
` <finish name="finish">2009-04-01T23:59:26.844Z</finish>`
` <jobStepId name="jobStepId">5da765dd-73f1-11e3-b67e-b0a420524153</jobStepId>`
` <stepName name="stepName">Drop</stepName>`
` <status name="status">completed</status>`
` <outcome name="outcome">success</outcome>`
` <runTime name="runTime">0</runTime>`
` <waitTime name="waitTime">266</waitTime>`
` </object>`
………
</response>
Example 2: Find all jobs that were created in April 2008
ec-perl ecextract.pl ^
` --user report ^`
` --pass report ^`
` --server localhost ^`
` --outputPath jobOut.xml ^`
` --type job ^`
` --max 100 ^`
` --property jobName ^`
` --property jobId ^`
` --property projectName ^`
` --property procedureName ^`
` --property branch ^`
` --filter createTime,greaterOrEqual,2009-04-01T00:00:00.000Z ^`
` --filter createTime,lessOrEqual,2009-04-30T00:00:00.000Z ^`
` --sort projectName,ascending ^`
` --sort procedureName,ascending ^`
` --sort createTime,descending`
Output from example 2
<?xml version="1.0" encoding="utf-8"?>
<response>
` <object objectType="job" objectId="job-158461">`
` <jobName name="jobName">commander-3.2.23916-200904011650</jobName>`
` <jobId name="jobId">4fa765dd-73f1-11e3-b67e-b0a420524153</jobId>`
` <projectName name="projectName">Commander</projectName>`
` <procedureName name="procedureName">Master</procedureName>`
` <branch name="branch">3.2</branch>`
` </object>`
` <object objectType="job" objectId="job-158455">`
` <jobName name="jobName">commander-anders-main-ad.23915-200904011627</jobName>`
` <jobId name="jobId">4fa765dd-73f1-11e3-b67e-b0a420524153</jobId>`
` <projectName name="projectName">Commander</projectName>`
` <procedureName name="procedureName">Master</procedureName>`
` <branch name="branch">main</branch>`
` </object>`
………
</response>
Example 3: Find all resources
ec-perl ecextract.pl ^
` --user report ^`
` --pass report ^`
` --server localhost^`
` --outputPath resourceOut.xml ^`
` --type resource ^`
` --max 100 ^`
` --property resourceName ^`
` --property stepCount ^`
` --property stepLimit ^`
` --property hostName ^`
` --filter stepCount,greaterThan,0 ^`
` --sort resourceName,ascending`
Output from example 3
<?xml version="1.0" encoding="utf-8"?>
<response>
` <object objectType="resource" objectId="resource-106">`
` <resourceName name="resourceName">ecbuild-lin1</resourceName>`
` <stepCount name="stepCount">2</stepCount>`
` <stepLimit name="stepLimit">0</stepLimit>`
` <hostName name="hostName">ecbuild-lin1</hostName>`
` </object>`
` <object objectType="resource" objectId="resource-108">`
` <resourceName name="resourceName">ecbuild-win1</resourceName>`
` <stepCount name="stepCount">1</stepCount>`
` <stepLimit name="stepLimit">0</stepLimit>`
` <hostName name="hostName">ecbuild-win1</hostName>`
` </object>`
………
</response>
BIRT Report Designer
Now that you have a dataset, you can create a BIRT report. You need an XML file to use while designing the report. If you did not create an XML data file yet, now is the time to do so. After you have sample data, you are ready to start designing a report.
Report definitions are created with the BIRT Report Designer, currently version 2.5.2. These definitions are then stored in .rptdesign files. You have several options for installing the designer tool:
-
Use a BIRT Report Designer bundled and already installed with Eclipse, or
-
download BIRT Report Designer to use with your existing Eclipse installation, or
-
because Eclipse is not required, you can download only the BIRT Report Designer (this is the easiest and preferred method).
We recommend downloading the BIRT RCP Report Designer only, which is the standalone design tool. The url for downloading the Report Designer is
The general download page for BIRT 2.5.2 with the other options discussed is \https://download.eclipse.org/birt/downloads/build.php?build=R-R1-2_5_2-201002221500
Using the BIRT Report Designer is beyond the scope of this Help topic. Documentation and tutorials can be found on the BIRT website: \https://www.eclipse.org/birt . You may find it helpful to view the report designs for built-in CloudBees Flow. These designs can be found in the agent/reports/< report name > directory in the EC-Reports plugin.
Understanding additional report components
In addition to the XML dataset and report design, there are optional report components you may wish to include in your report.
-
External style sheet BIRT supports external style sheets for reports. If you use these style sheets, they need to be located with your report design. For example, built-in CloudBees Flow reports use an external style sheet file
"styles_birt.css". -
Externalized string properties String literals (used in your report design) can be externalized into property files to support localization. These property files need to be located with your report design also. The properties file for the default locale will have the same name as your report and a ` ".properties" ` file extension, for example, ` CategoryPie.properties. ` Text for additional locales are stored in files named ` <report name>_<locale>.properties, ` for example, ` CategoryPie_ja.properties ` contains text localized for the Japanese language.
You may review examples of these additional components for built-in CloudBees Flow reports. These files are located in the EC-Reports plugin, in the ` agent/reports/<report name> ` directory.
Packaging reports for CloudBees Flow
After you have an XML dataset (using ` ecextract.pl` ), a BIRT report design (using BIRT Report Designer), and any additional optional report components completed, you are ready to integrate your report into CloudBees Flow. To do this:
-
Store all the report components in a location accessible to your CloudBees Flow agent—you can use the CloudBees Flow plugins directory. For example, for your report files, you could create a directory called "MyReport" in the CloudBees Flow plugins directory.
-
Create a CloudBees Flow procedure to perform the necessary steps to generate a report, including: extracting data, running the report design, and registering report output to appear on the Report tab on the Project Details page. You may want to copy one of the procedures from the built-in CloudBees Flow reports to use as a template. The following command creates a copy of the RunReport_CategoryPie procedure called RunReport_MyReport in the project of your choice. Substitute your project name for ` <my-project-name> ` in the following command.
ectool clone --cloneName/projects/<my-project-name>/procedures/RunReport_MyReport --projectName/plugins/EC-Reports/project --procedureName RunReport_CategoryPie
Example: customizing the command body
The following is an example of customizing the procedure contents for the RunReport_MyReport procedure, cloned from the RunReport_CategoryPie procedure above.
One customization is required and two are optional. The remainder of the command body does not need to be changed.
-
Customizing the location of the BIRT report design file Required: update the location of the BIRT report design file.
-
Original value: ` our $reportDesignFile = "$pluginDir/agent/reports/CategoryPie/CategoryPie.rptdesign";`
-
New value: ` our $reportDesignFile = "$ENV{'COMMANDER_PLUGINS'}/MyReport/MyReport.rptdesign";`
-
Customizing data extraction To customize data extraction using ` ecextract.pl`, modify the following section of the command body:
` #-------------------------------------------------------------------------`
` # extractReportData`
` #`
` # Extract report data from Commander using ecextract utility`
` #-------------------------------------------------------------------------`
` sub extractReportData()`
` {`
` # Time property varies based on object type`
` my $timeprop = "modifyTime";`
` if (`
` $timeprop = "finish";`
` }`
` my $command = "ec-perl \"$pluginDir/agent/bin/ecextract.pl\" "`
. " --debug 3"
. " --outputPath \"$ ecextractXmlFile\""
. " --credential \"$[Credential]\""
. " --type \"$[Object Type]\""
. " --property time=$timeprop"
. " --property series1=\"$[Property]\"";
` if ("$[Saved Filter]" ne "") {`
` command = $command . " --savedFilter \"$[Saved Filter]\""`
` }`
` $command = $command . " --period \"$[Time Period]\"";`
` print "data extract [$command]\n";`
` my $result = $command;`
` print "extract result:\n$result";`
` if ($?) {`
` exit (1);`
` }`
` }`
-
Customizing report parameters To customize the parameters passed to your report design, modify the following section of the command body:
` #-------------------------------------------------------------------------`
` # getReportArgs`
` #`
` # Get report arguments`
` #-------------------------------------------------------------------------`
` sub getReportArgs() {`
` # args for creating report`
` my $categoryHeading = ucfirst($[Property]);`
` my @args = (`
` "-f", "$reportFormat",`
` "-o", "$reportName",`
` "-i", "images/",`
` "-p", " xmlfile=../$ecextractXmlFile",`
` "-p", "ReportTitle=$reportTitle",`
` "-p", "TableColHeadingTime=$categoryHeading",`
` "-p", "TableColHeadingSeries1=Count" ,`
` "-p", " SearchURL=" . getSearchUrl(),`
` "$reportDesignFile",`
` );`
` # add locale args`
` foreach my $locale (@locales) {`
` if ($locale ne "") {`
` unshift @args, "-l $locale";`
` }`
` }`
` return @args;`
` }`
Helper functions provided in CloudBees Flow Automation Platform::ReportUtils.pm
ecgenReport —runs the BIRT report, using the BIRT Report Designer
-
installationDirectory—this is the directory where CloudBees Flow is installed and where you will find JAVA and BIRT -
artifactDirectory—this is the directory where reports, images, and other artifacts should be stored. To display using the Reports subtab, these items must be in a directory named "artifacts" at the top of the job’s workspace -
args—an array of arguments to the BIRT run-time engine, which specifies parameters, design templates, and so on.
registerReport —marks the report so it will be displayed when you select the Reports subtab
-
commander—a ` CloudBees Flow Automation Platform()object ` used to make CloudBees Flow calls. If you need to use a specific user context, call the login method before calling ` registerReport` -
jobId—this is the report job ID, which is used to set properties on the job -
url—this is the URL to register and it takes the form workspace name/html file name -
title—this is the text string for the report navigation tree -
treeGroupings—a hash grouped ` name/values ` set as properties to define the report tree groupings—report tree groupings are defined on a propertySheet named ` ec_reportConfiguration` on the project or on the server -
hash key—this is a property name that will be created on job’s ` ec_reportData/$title/ ` property sheet and used for report tree grouping -
hash value—property value
registerArtifactsDirectory —creates the property required to set the artifacts directory
-
commander—a ` CloudBees Flow Automation Platform() object ` used to make CloudBees Flow calls -
jobId—this is the report job ID, which is used to set properties on the job -
artifactsDir—this is a directory path relative to the workspace where job artifacts will be stored
extractFile —this function pulls content from the report definition (stored in properties) and creates files from them
-
commander—a ` CloudBees Flow Automation Platform()object ` used to make CloudBees Flow calls. If you need to use a specific user context, make sure to call the ` login ` method before calling ` registerReport` -
jobId—this is the report job ID, which is used to set properties on the job -
reportType—this is used to lookup report attributes -
files—an array of hashes that specify which properties should be loaded into which files -
prop—the property name from the installed report type -
dest—the destination file name (relative to the current working directory) -
expand—this is "1" if you want CloudBees Flow to expand property references in the property, "0" if not
getReportTimestamp —return hires timestamp formatted in a specified time zone
-
TimeZone—(optional) a time zone specifier, default is "local" -
FormatString—(optional) a format specifier for the timestamp string
This Help topic contains two examples illustrating how you might use the BIRT Report Designer to modify a built-in CloudBees Flow report to create a custom report more meaningful for your purposes.
Example 1: modifying an existing report—adding a "banner" heading
The easiest way to customize a report is to take an existing report and modify it. CloudBees Flow provides a set of built-in reports you can modify.
Following is a process overview for modifying a CloudBees Flow built-in report:
-
Make a copy of an existing report
-
Make changes to the report
-
Test your new custom report
To copy an existing CloudBees Flow report
For this example, we will make a copy of the built-in Value Over Time report. The process to copy a report is:
-
Make a copy of the file system report components of the Value Over Time report located in the CloudBees Flow plugins directory.
Rename the copied directory to MyReport.
The default location of the CloudBees Flow plugins directory is:
On Linux: /opt/electriccloud/electriccommander//plugins
On Windows: C:\Documents and Settings\All Users\Application Data\Electric Cloud\ElectricCommander\plugins
Linux example—The following commands will make a copy of the Value Over Time report file components and then rename the files:
$ cd /opt/electriccloud/electriccommander//plugins
$ cp -r EC-Reports-1.0.0.*/agent/reports/ValueOverTime/ MyReport
$ cd MyReport
$ rename ValueOverTime MyReport ValueOverTime*
The contents of the MyReport directory should be:
$ ls -1
` MyReport_en.properties`
` MyReport_ja.properties`
` MyReport_ko.properties`
` MyReport.properties`
` MyReport.rptdesign`
` MyReport_zh.properties`
` styles_birt.css`
-
Make a copy of the RunReport_ValueOverTime procedure from the EC-Reports plugin that performs the steps to generate a report, including extracting data, running the report design, and registering the report output to appear on the Report tab of the Project Details page. In this example, we will create a Project called “MyReportProject” and the procedure we copy will be called “RunReport_MyReport”.
$ ectool createProject MyReportProject
$ ectool clone --cloneName /projects/MyReportProject /procedures/RunReport_MyReport
` --projectName /plugins/EC-Reports/project --procedureName RunReport_ValueOverTime`
response requestId="1"
` <cloneName>RunReport_MyReport</cloneName>`
</response>
-
Edit the “RunReport_MyReport” procedure in “MyReportProject” to reference the report design file copied earlier.
-
Navigate to project MyReportProject, procedure RunReport_MyReport and select the RunCustomReport step to edit the Command block:
Find the following line:
our $reportDesignFile = "$pluginDir/agent/reports/ValueOverTime/ValueOverTime.rptdesign";
and change this line to:
our $reportDesignFile = “$ENV{'COMMANDER_PLUGINS'}/ MyReport/MyReport.rptdesign";
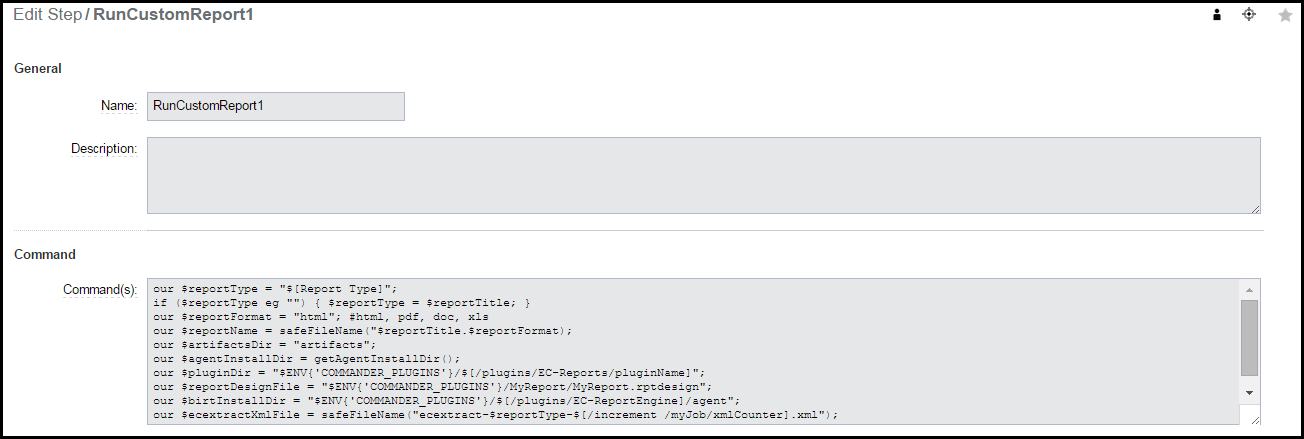
Click OK to save the change.
To modify the copied report design
Start the BIRT Report Designer and open the report design file ( MyReport.rptdesign ) located in the MyReport directory previously created in the CloudBees Flow plugins directory. You are now ready to begin editing an existing report to create a custom report.
For our example, we are adding a new heading, "Company Confidential," (in large red letters) to the top of the existing report.
-
On the BIRT screen, select the Layout tab.
-
Drag a "Label" from the Palette window into the top of the report and type "Company Confidential" (or whatever text you would like to use for your test report) into the Label box.
-
See the next BIRT screen example.
-
Now you can change the font size and color to create a banner appearance. Select the Property Editor window to customize your text—see the next screen example.
-
After customizing your text, save your report.
Test your new report
Run the report by running the RunReport_MyReport procedure in the MyReportProject project. When the job completes, your new report will be available in the Links section on the Job Details page and from the Reports tab if the MyReportProject project. You will see the new header in the report output.
Example 2: complete end-to-end example
Using BIRT and some scripting expertise, you can create almost any kind of report you can imagine. This example creates a new report that shows the run-time trend of all job steps. Tasks for creating this report can be grouped into the following steps:
-
Plan your report
-
Create a new BIRT rptdesign file
-
Deploy your custom report
-
Test your new report
Planning this report example
We decided our report will be a single-series type report that will show job steps runtime. The report will include a line chart at the top of the page whose X and Y axis represent the number of seconds and the job step ID respectively. We also want a table with two columns—column names will be "Job Step Name" and "Run Time".
Next, we need to gather all materials:
Generate sample data to test in the report.
You can use data from a previous run of a Value Over Time report—this file is located in the workspace of a previous reporting job and has the name ecextract.xml.
Also from the copy of a CloudBees Flow Value Over Time report, we will "copy and paste" a few values from it to save some typing.
Creating a new BIRT rptdesign file
In BIRT Report Designer, create a new rptdesign file. Open the report file you created in "Example 1: modifying an existing report—adding a banner heading" so you can use the previous example report to copy some items into your new report.
Items to copy into the new report:
-
From Data Sources, copy ecextract_data
-
From Data Sets, copy ecextract
-
From Report Parameters, copy xmlfile
See the next screen example to help find these items.
After copying these items, your new report design will look like the following example:
Double-click the Data Sources > ecextract_data file to ensure the XML file is referenced as a parameter. If it is not, type in the value as shown below.
Double-click Data Sources > ecextract_data to ensure the XML Data Source Connection refers to the data file you downloaded earlier. In this example the file is C:\ecextract.xml.
From the Palette window, drag a Chart object into your report. Your view will be similar to the following:
In the New Chart dialog, select Line under Select Chart Type and browse to select PNG for the Output Format.
Click Next.
On the next screen:
-
Under Select Data, browse to select ecextract.
-
Make sure the Use Data From radio button is selected.
-
Drag the "series1" header to the Value (Y) Series field.
-
Drag the "objectId" header to the Category (X) Series field.
Click Next to apply any other formatting changes you choose, then click Finish.
On the next screen, after clicking Finish, you have to option to resize the chart as you wish.
You are now ready to drag a Table item from the Palette to the report layout below the chart.
Select "2" columns and the ecextract dataset.
Click OK.
Select the Data Explorer tab and expand Data Sets > ecextract. See the next screen.
Now you are ready to:
-
Drag "objectId" to the left Detail Row.
-
Drag "series1" to the right Detail Row.
-
Replace the Header Row for "objectId" and "series1" with Job Step Name and Run Time, respectively.
See the next screen example.
Select Preview to see your report.
In the “Enter Parameters” dialog, type the location of your ecextract.xml data file.
Click OK.
- At this point, you can continue to make formatting changes to make your custom report look exactly how you want it to look. Our example report, when finished, looked like the following example
-
Deploy your custom report
If you have not already done so, save your new report design now. We have named our report design “ JobStepRunTime.rptdesign ”.
The new report design needs to be stored in a location accessible to the CloudBees Flow Agent that will run the report. As in the previous example, we will use the CloudBees Flow plugins directory for this purpose.
-
Save the JobStepRunTime.rptdesign file to a new JobStepRunTimeReport directory in the CloudBees Flow plugins directory.
The default location of the CloudBees Flow plugins directory is:
On Linux: /opt/electriccloud/electriccommander//plugins
On Windows: C:\Documents and Settings\All Users\Application Data\Electric Cloud\ElectricCommander\plugins
Linux example—The following commands will make a copy of the Value Over Time report file components and then rename the files:
$ cd /opt/electriccloud/electriccommander//plugins
$ mkdir JobStepRunTimeReport
-
Now copy the previously saved JobStepRunTime.rptdesign file to the JobStepRunTimeReport directory.
-
Make a copy of the RunReport_ValueOverTime procedure from the EC-Reports plugin that performs the steps to generate a report, including extracting data, running the report design, and registering the report output to appear on the Report tab of the Project Details page. In this example, we will create a Project called “JobStepRunTime” and the procedure we copy will be called “RunReport_JobStepRunTime”.
` $ ectool createProject JobStepRunTime`
` $ ectool clone --cloneName /projects/JobStepRunTime/procedures/RunReport_JobStepRunTime`
` --projectName /plugins/EC-Reports/project --procedureName RunReport_ValueOverTime`
` <response requestId="1"`
` <cloneName>RunReport_JobStepRunTime</cloneName>`
` </response>`
-
Edit the “RunReport_JobStepRunTime” procedure in project “JobStepRunTime” to reference the report design file copied earlier.
-
Navigate to project JobStepRunTime, procedure RunReport_JobStepRunTime and select the RunCustomReport step to edit the Command block:
Find the following line:
our $reportDesignFile = "$pluginDir/agent/reports/ValueOverTime/ValueOverTime.rptdesign";
and change it to:
our $reportDesignFile = “$ENV{'COMMANDER_PLUGINS'}/ JobStepRunTime/JobStepRunTime.rptdesign";
Click OK to save the change.
Test your new report
Run the report by running the RunReport_JobStepRunTime procedure in the JobStepRunTime project. On the Run Procedure page, change the values of the following parameters:
-
Object Type ⇒ Job Step
-
Property Expression ⇒ /1000
-
Report Title ⇒ Job Step Run Time
Click Run.
When the job completes, your new report will be available in the Links section of the Job Details page and from the Reports tab in the JobStepRunTime project.
You can also use StatsD and Graphite to generate custom reports for system health monitoring in CloudBees Flow. After StatsD and Graphite are enabled, reports about a predefined list of items are generated.
This Help topic does not include instructions to set up StatsD and Graphite. Go to the following sites for documentation and tutorials:
-
https://github.com/etsy/statsd/
-
https://graphite.readthedocs.org/en/latest/index.html/
-
https://www.digitalocean.com/community/tutorials/an-introduction-to-tracking-statistics-with-graphite-statsd-and-collectd/
-
https://www.digitalocean.com/community/tutorials/installing-and-configuring-graphite-and-statsd-on-an-ubuntu-12-04-vps/