From the Release Dashboard
The Release Dashboard orchestrates all the information about the planned, active, or completed releases and displays the releases that you have permission to view in one place. At any time, you can quickly see the current status of the release, where it is in the process flow, any errors during the runtime, when human intervention is required to take some action or perform a task, approvals, and the start and end dates for the release. See Release Dashboard for more information, and See Example: Visibility in a Release Pipeline from the Release Dashboard for an example how to drill down from the top Pipeline Run view to the specific job details of the release tasks.
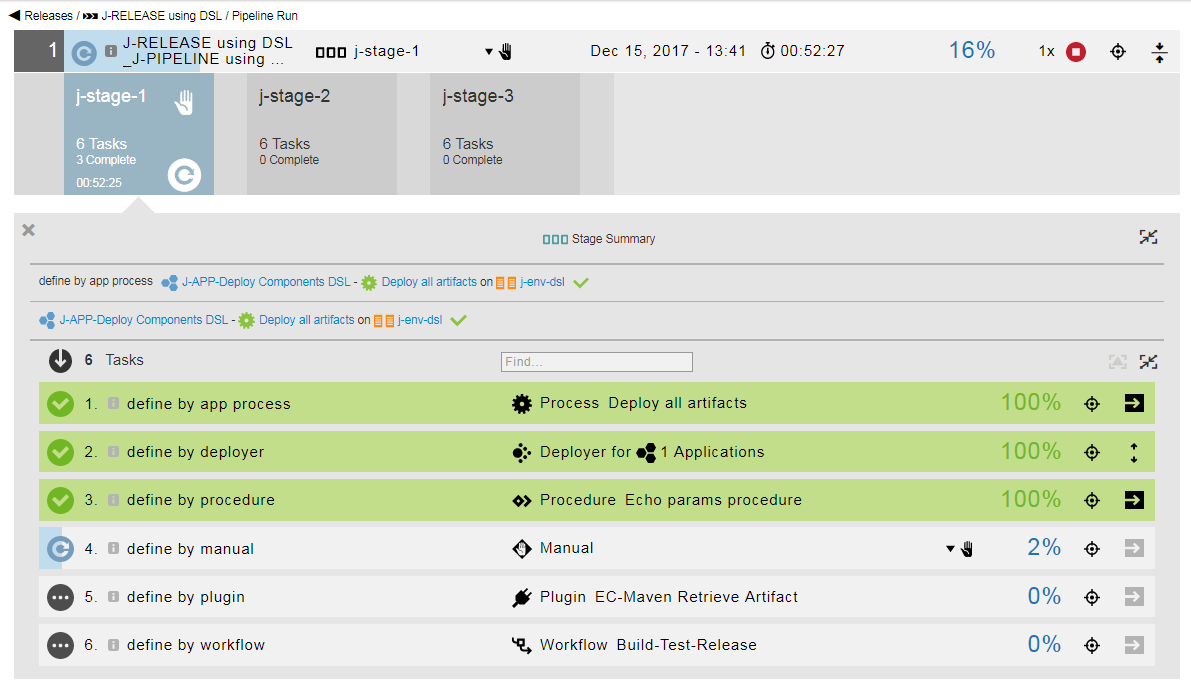
For a release that is in progress or has been completed, clicking the Release status opens the Pipeline Run view. You can view the Stage Summary for the latest release or view previous pipeline runs. The Stage Summary shows the pipeline’s progress through each stage and evidence that the tasks were executed. Clicking in a stage task or a gate displays its Stage Summary. See Pipeline Stage Summary for more information.
-
When the Release is in progress, you can view the progress of the pipeline as it runs. See Viewing the Stage Summary During a Pipeline Run for an example of this.
-
You can also view a completed pipeline run. See Viewing the Stage Summary for a Completed Pipeline Run for an example of how to do this.
-
Clicking View previous Pipeline Runs displays the last five pipeline runs. After selecting one of these runs, you can view the Stage Summary to view more details about the pipeline run.
-
If the pipeline has errors, you can also view what the error is and where it occurred in the pipeline in the Task Error view.
For example, you can view the progress and evidence of the deployer task run. Clicking  displays the payload of the release. This is the actual list of applications or microservices (and the number of applications or microservices) to deploy that is specified in the bill of materials in the release definition.
From the Release dashboard, you can go to the Path-to-Production view for a running or completed release. This view shows the bill of materials for the release. You can easily see the artifacts and snapshots that are in compliance with the release manifest. See Path-to-Production View for more information.
From the Environment Inventory
The environment inventory shows what is deployed in an environment at any time. See Environment Inventory for more information.
From the Change History
The Change Tracking feature tracks the changes between every state of non-runtime objects, such as environments and resources. CloudBees Flow records a Change History of the historical states of environment objects, including environment tiers and resources, and records changes between them. See Change Tracking for more information.
Postp
Postp, a postprocessor included with CloudBees Flow, is used for data collection and for report generation. For visibility in a release run, you can get live streaming data from the log files using the standard output settings. Using postp commands in pipeline tasks (defined by application or microservice processes, procedures, or workflows), you can make this data appear in the Job Details page in CloudBees Flow.
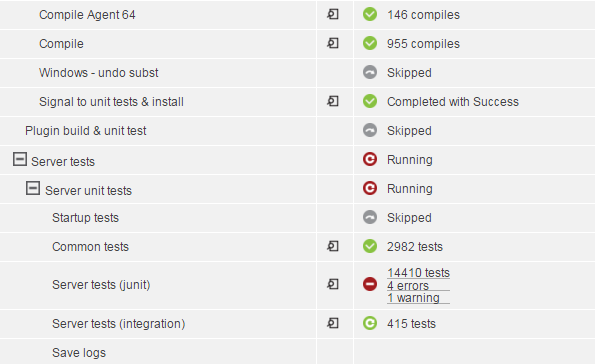
This example shows:
-
During the Compile step, there were 955 compiles.
-
In the "Command tests" step, 2982 tests were run.
-
For the "Server tests (junit)" step, 14410 tests were run with 4 errors and 1 warning. Clicking on the links in this step provides details and evidence about how the job ran and what actions to take next.
Clicking on the log button for any of these steps displays the log file details.
For more information about using postp:
-
See Editing a Pipeline Definition to define, view, and edit pipeline tasks in the pipeline definition.
-
See Postprocessors: Collecting Data for Reports and Postp extension to set up data collection, generate reports, and display data from the log files.
For an in-progress release
You can view the progress of the pipeline during the Release run starting in the Release Dashboard:
-
In the Release dashboard, clicking on the status of an in-progress or completed Release opens the Pipeline Run view for the Release pipeline.
-
When manual intervention is needed at a gate (indicated by the
 hand menu), clicking the menu displays the required approvals. Clicking the specific approval opens the gate approval dialog.
After the approval rules or conditions are approved, the pipeline continues.
-
When a pipeline stage is running, it is enabled. Clicking in it displays the Stage Summary, which shows the tasks in the stage and their progress.
-
In the Stage Summary, the top section shows information about the tasks deployed in the pipeline stage, which you can show or hide. You can also display user-generated information such as:
-
Links to web sites for reports and other information about the deployed artifacts
-
Property information about the pipeline stage and the objects in it
-
-
The next section shows the tasks in the pipeline stage. If the pipeline is in progress, click
in the row to view details for the manual task:
-
After completing the manual task, click Complete as the outcome, add a comment, and click OK in the Manual dialog box.
To view details about a completed manual task, click
 to view the details. The Manual dialog box opens. When the manual task has required input, click in the Parameters row to view the manual task details. The Manual dialog box now shows the action and evidence fields. The action field describes what was done to approve the manual task, and the evidence field describes what was done to approve it.
. When human intervention is needed at the exit gate (indicated by the hand icon), an exit gate is enabled. Clicking in the exit gate displays the approvals required to complete the pipeline stage.
. If the entry gate to the next stage has approval conditions before the tasks in it can start, this entry gate is enabled. Clicking in the entry gate displays the approvals required to start the tasks in a pipeline stage.
. The sequence continues as the pipeline progresses.
. Click View previous Pipeline Runs to view the previous five runs.
to view the details. The Manual dialog box opens. When the manual task has required input, click in the Parameters row to view the manual task details. The Manual dialog box now shows the action and evidence fields. The action field describes what was done to approve the manual task, and the evidence field describes what was done to approve it.
. When human intervention is needed at the exit gate (indicated by the hand icon), an exit gate is enabled. Clicking in the exit gate displays the approvals required to complete the pipeline stage.
. If the entry gate to the next stage has approval conditions before the tasks in it can start, this entry gate is enabled. Clicking in the entry gate displays the approvals required to start the tasks in a pipeline stage.
. The sequence continues as the pipeline progresses.
. Click View previous Pipeline Runs to view the previous five runs.+ Clicking
 displays the pipeline, where you can click in a gate or stage to view more details. Clicking
  hides this pipeline.
+ To view details about a manual task, click
to view the details of the manual task. The Manual dialog box opens. When the manual task has required input, click in the Parameters row to view the manual task details. The Manual dialog box now shows the action and evidence fields. The action field describes the what was done to approve the manual task, and the evidence field describes what was done to approve it.+ To view details about the other pipeline tasks, click
to view the Job Details.
-
For a Completed Release
See Running and Completing Releases for an example of running and completing a Release.