The Release Command Center dashboard provides a “birds-eye” view of a single product or release across all of its phases. These phases include initial planning with tools (such as JIRA or Rally) to groom the backlog, target stories, and tasks. The dashboard displays the high-level metrics for release activities such as release planning, continuous integrations, and deployments to various environments. It combines the release data in CloudBees Flow with data that it can pull from various third-party tools.
This dashboard includes metrics for application deployments and independent (project-level) microservice deployments. (It does not include metrics for microservices within applications.)
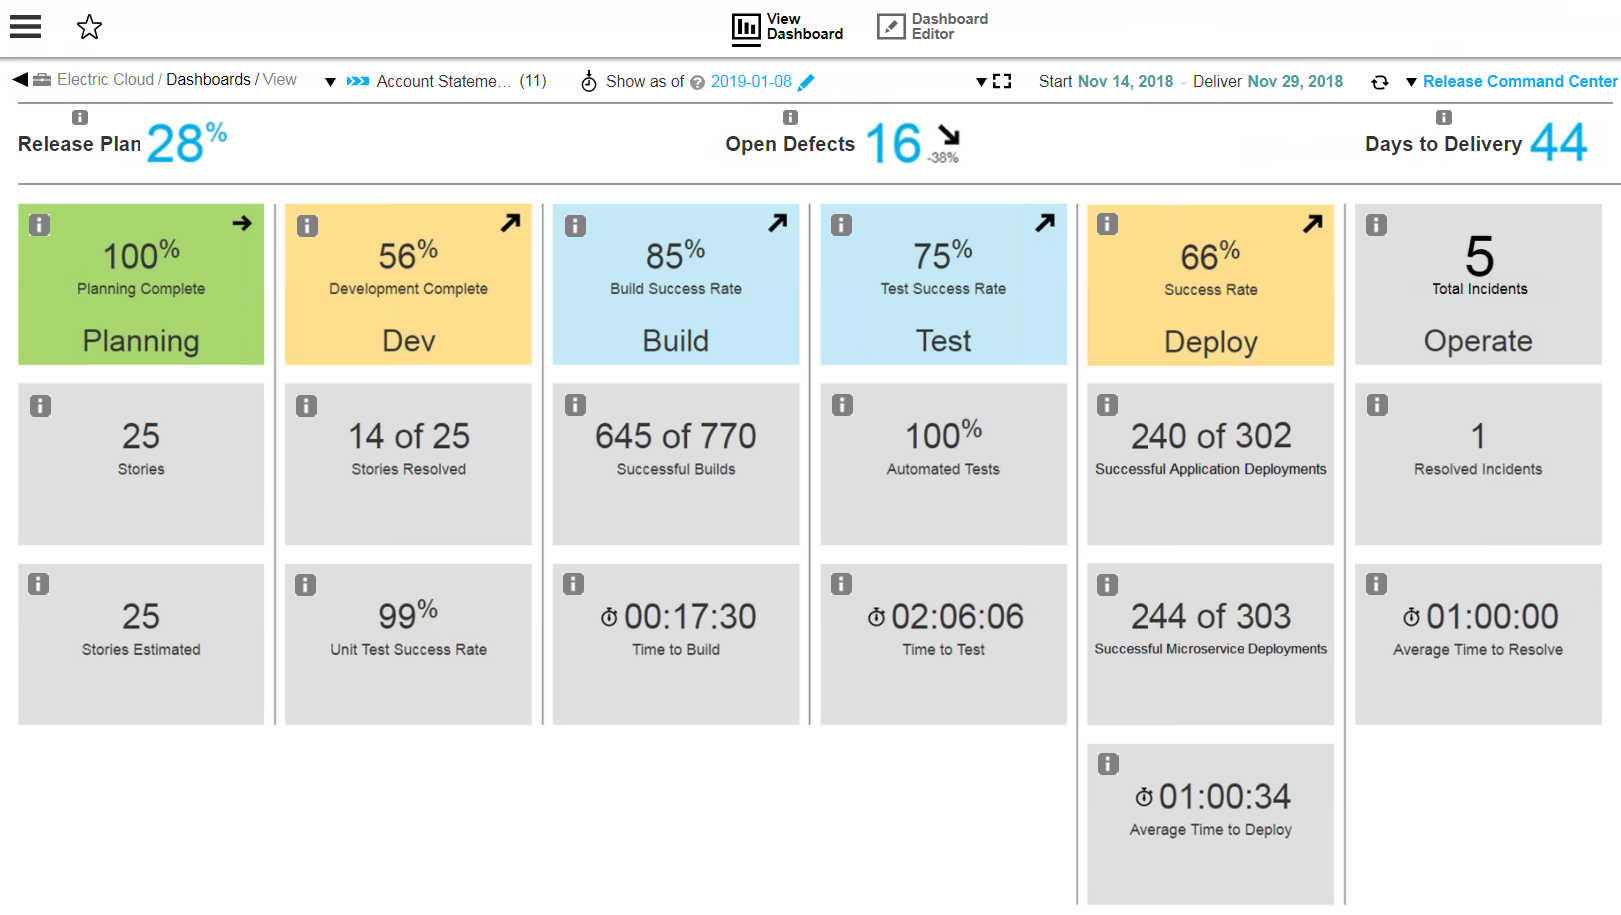
Following is a typical example of the dashboard. This example is for a release that is in progress with no major issues:
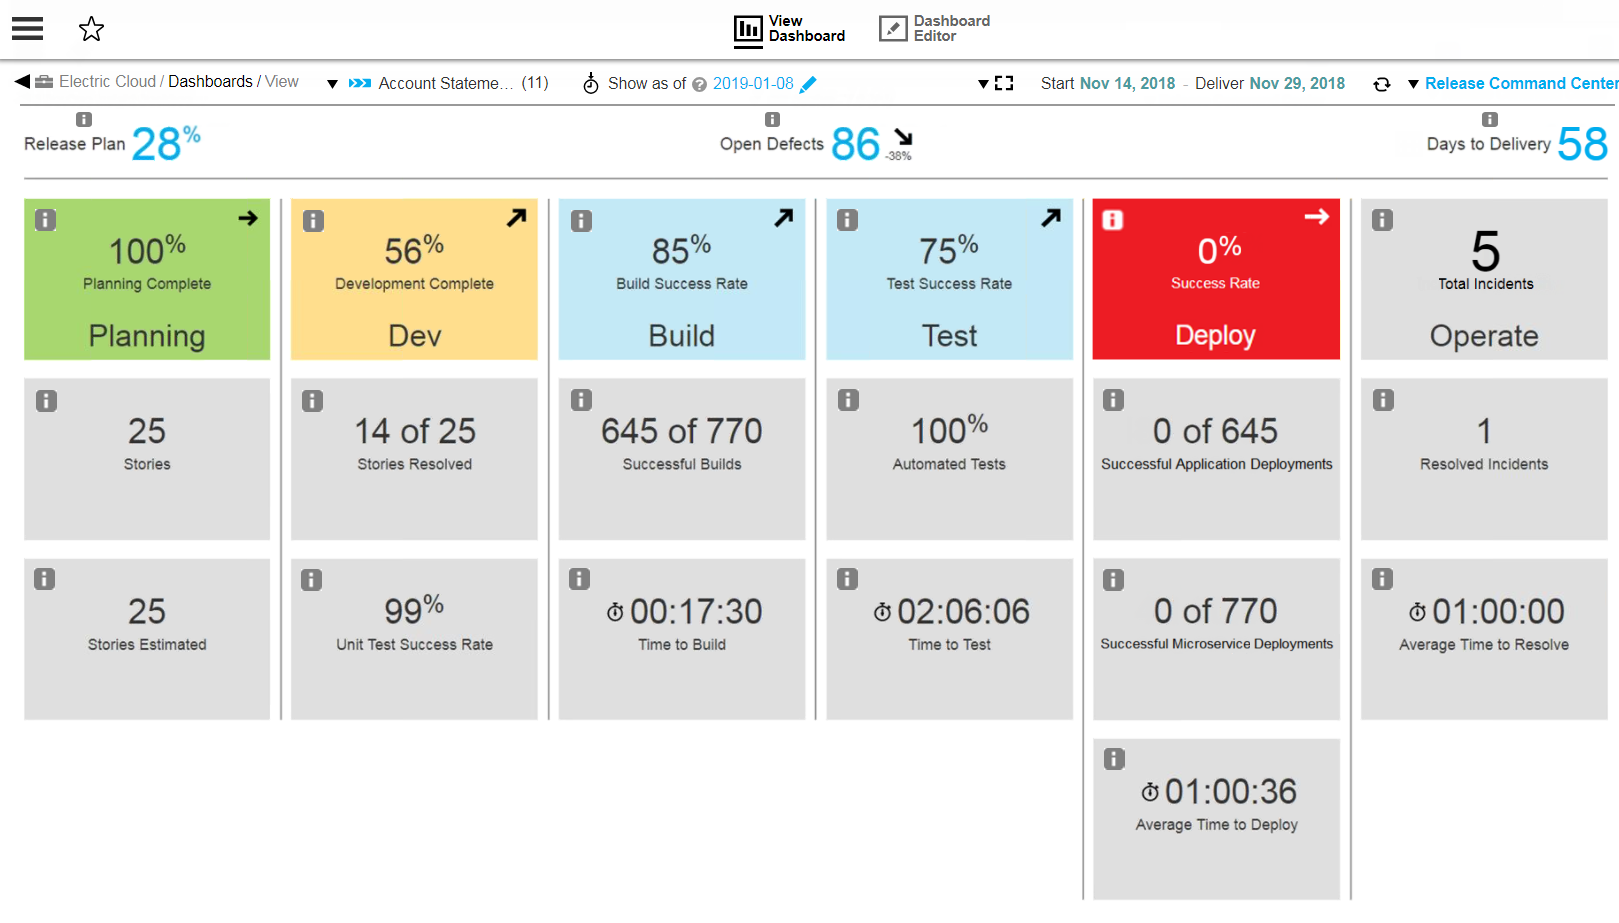
Following is a typical example for a release that is in progress but has issues with deployments. In this example, the Deploy cell is colored red, which indicates that too many deployments are failing in the last 10 days for the release to proceed satisfactorily:
Release Command Center Filters
The Release Command Center dashboard provides a drop-down menu that lets you filter by release:
-
Release Plan Metric
This metric displays the percentage of release stories that are complete. The percentage is calculated using the latest feature data associated with the release for type “story.” Records with status “closed” are considered as completed. This metric includes a trend indicator arrow, which shows the general direction of an already-formed trend. This metric uses the underlying Release Plan Completed widget.
-
Open Defects Metric
This metric displays the number of open defects for the release. The open defects are calculated using the latest defect data associated with the release. Records with a resolution that is either not set or empty are considered as open. This metric also includes a trend indicator arrow, which shows the general direction of an already-formed trend. This metric uses the underlying Open Defects In Release widget.
-
Days to Delivery Metric
This metric displays the number of days remaining in the release. This metric uses the underlying Days Remaining in the Release widget.
-
Columns and Cells
Each column displays a particular category of metrics. This lets you estimate the work in terms of story points or time all the way through deploying and running in production. Data is presented at the following levels:
-
Column (such as Dev, Build, or Test)
-
Column level summary (measures in upward or downward trends)
-
Column level details
The color thresholds are defined for the column summary widgets for the Planning, Dev, Build, Test , and Deploy columns. By default, the thresholds are the same based on the percentage value displayed for their corresponding widgets:
-
Less than 50%: Red
-
Between 50 and 75%: Yellow
-
Between 75 and 90%: Blue
-
90% or greater: Green
-
-
Below is a list of each column with a description of each cell in that column.
Drilling Down into Columns
Drill-down lets you take a closer look at the data in the Release Command Center dashboard. You can drill down by clicking on widgets in each of the columns.
Depending on the widget, drill-down will take you to the source of the metrics being displayed, which can either be an external system such as JIRA or ServiceNow or CloudBees Flow itself. Drill-down details are provided below.
Planning Phase
| Widget | Description |
|---|---|
Percentage Of Stories With Story Points |
Percentage of release stories that have story points assigned. This metric includes a trend indicator arrow, which shows the general direction of an already-formed trend. |
Total Stories |
Total count of release stories. |
Estimated Stories |
Total count of release stories with story points. |
The planning phase metrics are collected from systems such as JIRA or Rally. Out-of-the-box support for collecting data for DevOps Insight to visualize through the Release Command Center is provided for JIRA software using the EC-JIRA plugin. Clicking any cell (widget) in this column where the data for the metrics to display came from JIRA opens JIRA.
Dev Column
| Widget | Description |
|---|---|
Percentage Of Dev Complete Stories |
Percentage of release stories that have exited development. |
Dev Completed or Resolved Stories |
Percentage of release stories that are development complete. |
Unit Test Success Rate |
Percentage of successful unit tests out of the total unit tests run through CI builds for the release in the selected date range (the last 10 days by default). |
The Dev column metrics are collected from systems such as JIRA or Rally. Out-of-the-box support for collecting data for DevOps Insight to visualize through the Release Command Center is provided for JIRA software using the EC-JIRA plugin.
Build Column
| Widget | Description |
|---|---|
Build Success Rate |
Percentage of successful builds out of the total builds for the release in the selected date range (the last 10 days by default). This metric includes a trend indicator arrow, which shows the general direction of an already-formed trend. |
Total Successful Builds |
Number of successful builds out of the total builds for the release in the selected date range (the last 10 days by default). |
Average Build Duration |
Average time taken by builds associated with the current release to complete in the selected date range (the last 10 days by default). |
The Build column metrics are collected from systems such as Jenkins. Out-of-the-box support for collecting data for DevOps Insight to visualize through the Release Command Center is provided for Jenkins using the EC-Jenkins plugin.
Test Column
| Widget | Description |
|---|---|
System Test Success Rate |
Percentage of successful tests out of the total tests that were run for the release in the selected date range (the last 10 days by default). This metric includes a trend indicator arrow, which shows the general direction of an already-formed trend. |
System Test Automation Percentage |
Percentage of automated tests out of total tests that ran for the release. |
Average System Test Duration |
Average test duration in the selected date range (the last 10 days by default). |
Drill-down in the Test column collects data from a plugin such as EC-ALM. Clicking any cell in this column opens HP ALM in a browser window, from which you can drill down for more information.
Deploy Column
| Widget | Description |
|---|---|
Deployment Success Rate |
Deployment success rate in the selected date range (the last 10 days by default). |
Total Application Successful Deployments |
Number of successful application deployments out of the total completed deployments in the selected date range (the last 10 days by default). |
Total Successful Service Deployments |
Number of successful microservice deployments out of the total completed deployments in the selected date range (the last 10 days by default). |
Average Deployment Durations |
Average deployment duration in the selected date range (the last 10 days by default). |
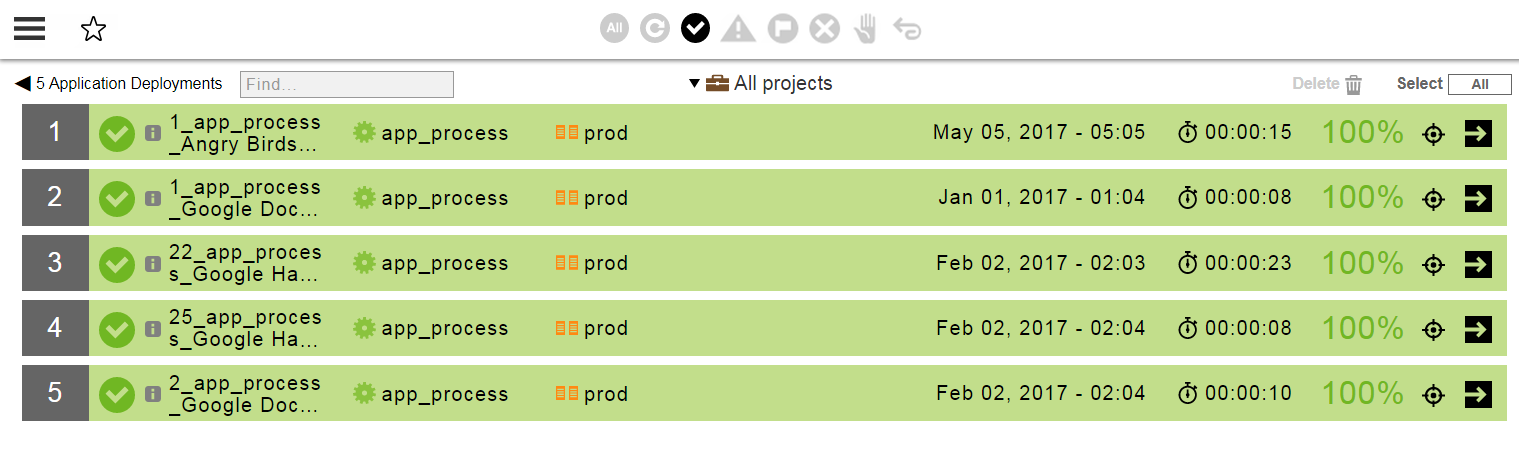
Clicking to drill down into Successful Application Deployments opens the Application Deployments page, which shows application deployments for the selected release. Note that you can also open the Application Deployments page by clicking Applications > Application Deployments from the Home menu.
Following is an example of the Application Deployments page when opened from the Release Command Center:
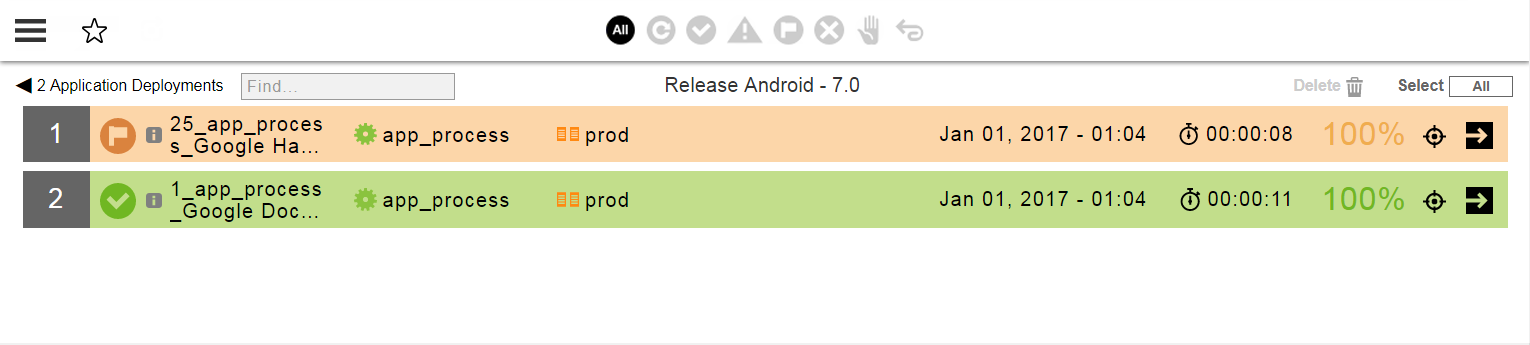
This is a page that is filtered by successful deployments for the selected application.
You can filter the list of deployments according to status by using the following buttons:
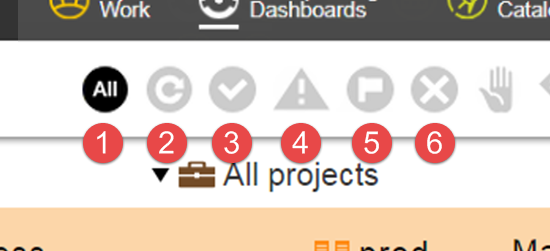
Following are descriptions of the filters:
1 |
All deployments |
2 |
Running deployments (gray highlighting) |
3 |
Successful deployments (green highlighting) |
4 |
Deployments that stopped because of one or more errors (red highlighting) |
5 |
Deployments that finished with one or more warnings (yellow highlighting) |
6 |
Aborted deployments (gray highlighting) |
For example, you can view only the successful deployments by clicking the Successful button:
To view the details of a deployment, click the deployment, which opens the Applications / View Run page. For more information, see Deploying and Troubleshooting Applications.
Clicking to drill down into Successful Microservice Deployments opens the Microservice Deployments page, which shows independent (project-level) microservice deployments for the selected release. Note that you can also open the Microservice Deployments page by clicking Microservices > Microservice Deployments from the Home menu.
The filter buttons for microservice deployments work in a manner similar to the filter buttons for application deployments as described above.
Operate Column
The Operate column shows incident metrics associated with the deployed release (post-production). This column collects data periodically from incident management system such as ServiceNow. See Setting Up the Release Command Center Dashboard for details on setting up data sources to collect data from systems such as ServiceNow for the Release Command Center.
| Widget | Description |
|---|---|
Total Incidents |
Total number of incidents opened against the release. |
Resolved Incidents |
Number of resolved incidents out of total incidents for the release. |
Average Resolution Time |
Average time to resolve an incident for the release. |
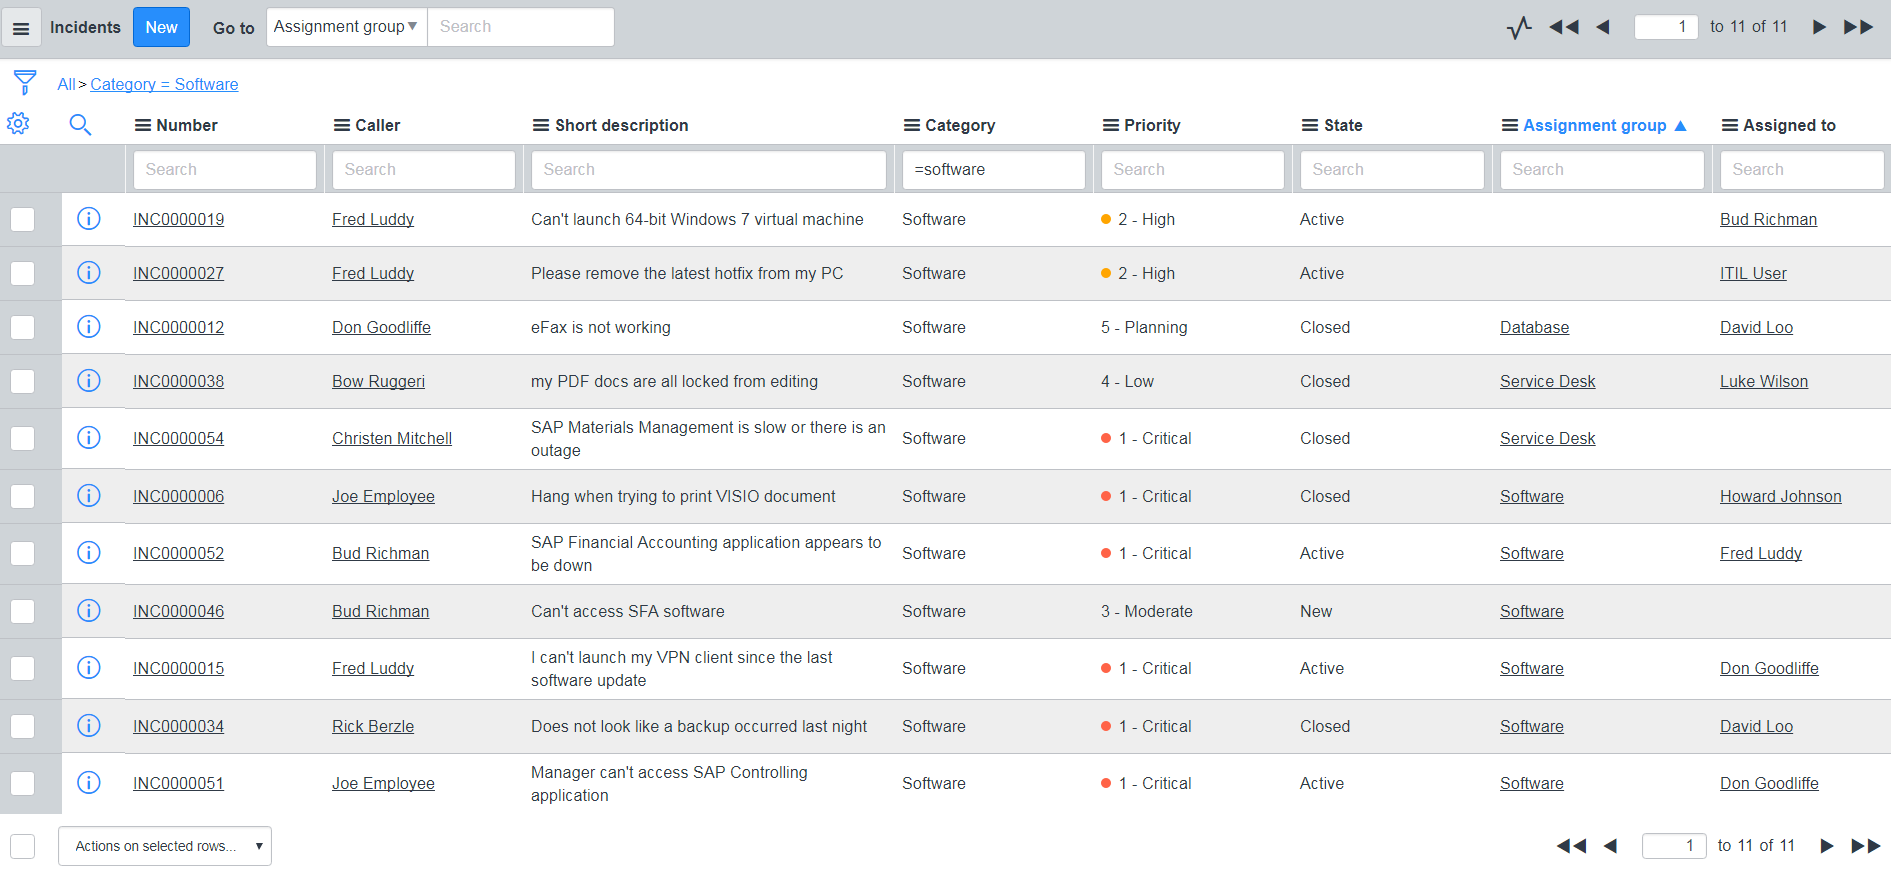
You can drill down into this column. Clicking the Total Incidents cell in this column opens a ServiceNow page that lists all incidents associated with the release. For example:
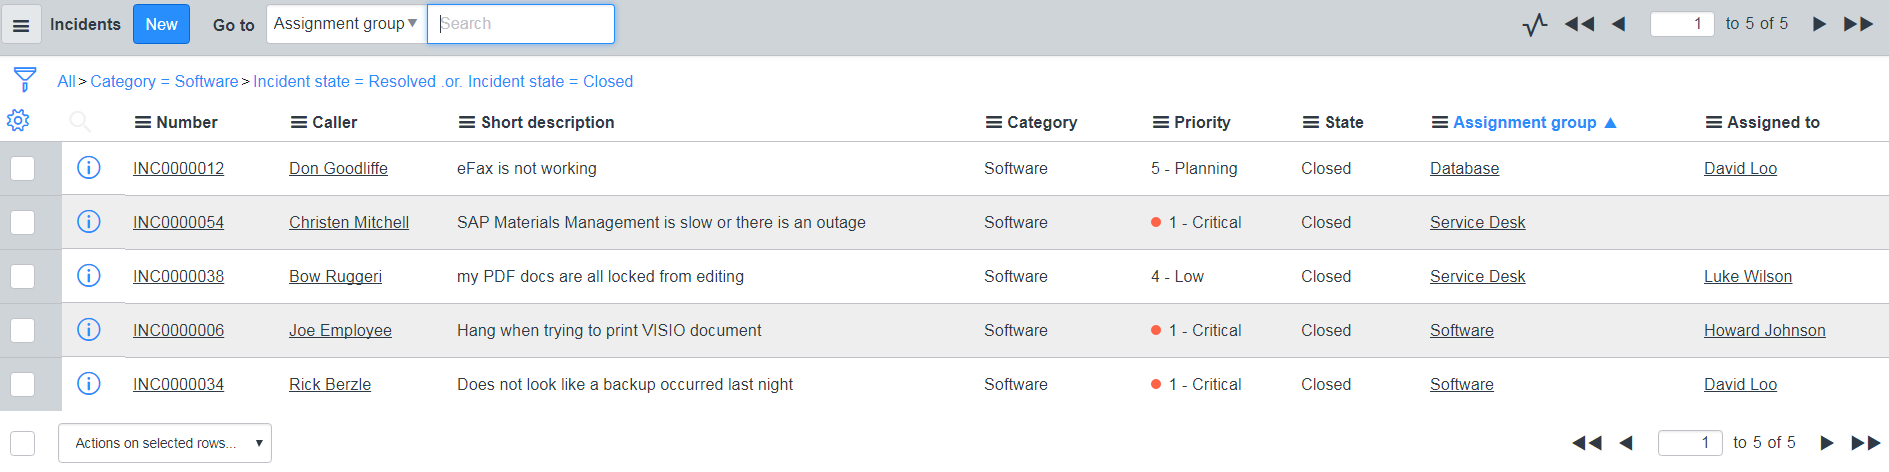
Clicking the Resolved Incidents cell or the Average Time to Resolve cell in this column opens a ServiceNow page that lists all resolved incidents associated with the release. For example:
Accessing the Release Command Center Dashboard
There are three ways to access the Release Command Center dashboard:
-
From the dashboard UI by clicking the DevOps Insight dashboards launch button and then selecting Release Command Center from the dashboards drop-down list.
-
From the Release Editor by clicking the Command Center button.
In the Release Editor, only one instance of the Release Command Center dashboard is displayed (either the out-of-the-box version or the customized version if it exists). Precedence is given to the customized version of the Release Command Center dashboard if you have created one. If a customized version does not exist, the out-of-the-box Release Command Center dashboard is loaded. -
By clicking DevOps Analytics>DevOps Insight Dashboards from the CloudBees Flow main menu and then selecting Release Command Center from the dashboards drop-down list.
Changing the Effective Date and Relative Date Range
By default, the Release Command Center dashboard displays the release metrics as of the current day and uses a date range (a time slice) of the last 10 days.
You can change the effective date and date range to view a relevant timeline of your choice to see more meaningful, historical data. For example, you can:
-
Change the Show as of date to compare a 10-days-ago snapshot of the dashboard with a 20-days-ago snapshot to analyze the progression of the release.
-
Set a 14-day time slice to see the information for an entire two-week sprint.
-
Compare a currently-running release to the last release that was completed a month ago.
Changing the effective dates
-
To change the Show as of parameter, click the Show as of button and choose a new date from the calendar that appears.
-
To change the time slice parameter, click the
 button and enter a positive integer for the number of days to use as the time slice in the dialog box that appears:
Setting Up the Release Command Center Dashboard
The Release Command Center dashboard shows release data that it collects and aggregates for tools such as JIRA and Jenkins. When you first view the dashboard for a release, each cell contains a message indicating that there is no data to display (except that you might see data in the Deploy column if you are already using CloudBees Flow itself as your deployment tool).
You can set up the Release Command Center by adding data sources for different third-party tools that you are using in your release. The supported tools are based on the installed plugins that support collecting data for the Release Command Center to send to the DevOps Insight server. Out of the box, the following third-party tools are supported for the Release Command Center:
| Source Type | Supported Third-Party Tool |
|---|---|
User Stories |
JIRA |
Continuous Integration |
Jenkins |
Test Automation |
HP ALM |
Defects |
JIRA |
Deployment Automation |
None. (Deployment automation is done by CloudBees Flow so no additional setup is required for it for the Release Command Center. CloudBees Flow automatically sends deployment data for the release to the DevOps Insight server) |
Incident Management |
ServiceNow |
Release Orchestration |
None (Release Orchestration is done by CloudBees Flow so no additional setup is required for it for the Release Command Center. CloudBees Flow automatically sends deployment data for the release to the DevOps Insight server) |
Support for a tool, such as Rally or Team City, that is not already supported by the Release Command Center can be added using a plugin that can collect data from the third party tool and send it to the DevOps Insight server.
Copying Data Sources to Populate the Dashboard
When you create a new release, often the configurations for the release command center will be very similar to the previous release, with minor updates to the filters and searches that you are using. To avoid time repeating the configuration steps when you create a new release, you can copy the configurations to data sources for the Release Command Center dashboard from an existing release, rather than creating a new setup from scratch. This feature lets release managers set up their Release Command Center dashboards more easily.
-
From the CloudBees Flow main menu, click Release Orchestration>Releases. The Releases listing page appears.
-
Click the New Release button. The New Release from Existing dialog box appears.
-
Click the Copy Data Source(s) checkbox and click OK.
When you check this checkbox, you are asked to copy data sources from the existing release to the newly copied release on the next screen.
Note that if this checkbox is grayed-out, data sources do not exist for the release that you are copying:
-
Click the Copy button for a data source in the Copy Data Sources dialog box.
-
Click Close and the click OK.
The data sources are now available for adding to the Release Command Center dashboard.
Adding Data Sources to Populate the Dashboard
CloudBees Flow supports several data sources that you can select to collect data periodically from third-party tools and send it to the DevOps Insight server for displaying in the Release Command Center dashboard.
To add a data source:
-
From within the Release Command Center dashboard, click the Dashboard Editor button. The Release Command Center dashboard editor appears.
-
Click the Setup button. The Command Center Setup dialog box appears.
This dialog box shows every available data source type (such as User Stories). Also, for each data source type, it shows the source, the list of widgets (such as Assigned Story Points or Total Stories) that correspond to that data source type and the group or column to which each widget belongs (such as Planning or Dev).
-
Click the Add button to add a data source for the data type of your choice for the current release. The Source Configuration dialog box appears:
-
Select a data source from the Select Data Source pull-down menu. The fields that are relevant to the specific data source that you selected will appear in the dialog box.
-
Complete the parameter values for the data source that you selected. For details about these values, see Entering Parameter Values for Data Sources .
-
Click OK. The new data source appears in the Command Center Setup dialog box.
After closing the dialog box, you will see the icon for the data source type displayed on the widgets for the newly-added data source.
Entering Parameter Values for Data Sources
The Release Command Center dashboard provides the following data source types. The following table lists these data source types and the data sources that you must configure to collect data for each cell.
| Data source type | Description | Tool(s) | Type(s) of data collected | For details, see… |
|---|---|---|---|---|
User stories |
Application lifecycle management products used to manage enhancements, user stories, features, epics, and so on |
JIRA |
Feature (JIRA stories) Defect (JIRA defects) |
|
Continuous integration |
Products used for continuous integration, unit test execution, and so on |
Jenkins |
Build (Jenkins builds) |
|
Test automation |
Test automation products |
HP ALM |
Quality (test runs from HP ALM) |
|
Deployment automation |
Products used for application, artifact, or container deployments |
CloudBees Flow |
||
Incident management |
Incident management products |
ServiceNow |
Incident (ServiceNow incidents) |
|
Defects |
Application lifecycle management products used to manage defects |
JIRA |
Defect (JIRA defects) |
Parameters for User Story Data Sources
| Parameter | Required | Description |
|---|---|---|
Type |
Yes |
Type of data source. This parameter is pre-selected and “grayed out” if you are adding a data source from the Widgets tab of the Command Center Setup dialog box. |
Source |
Yes |
Actual source of the data. |
Source Name |
Yes |
Name of the data source. This name must be unique within the release. |
Configuration Name |
Yes |
Name of the JIRA plugin configuration to use. This plugin configuration is created if it does not exist, and you must complete the following fields in the dialog box that appears.
|
Filter Type |
Yes |
Type of JIRA filter used to identify issues in the release. You can specify JIRA fields or a JIRA query (in JQL). |
JIRA Project |
No |
(When filtering by JIRA field) The JIRA project key that identifies the project in JIRA. |
JIRA Fix Version |
No |
(When filtering by JIRA field) The fix version in JIRA that identifies the JIRA issues of type “bug” that are part of the release. |
JIRA Query (JQL) |
No |
(When filtering by JIRA query) JQL to use to search issues. Either this parameter or “JIRA filter ID” must be specified. For example, For information about using JQL, see https://support.atlassian.com. |
Polling Frequency |
Yes |
Frequency (in minutes) for gathering data. The default is 30 minutes. |
As part of the data source creation, a schedule is created in the same project as the release that runs at the specified polling frequency to get the user stories from JIRA based on the parameters specified in the data source and send it to the DevOps Insight server. The schedule is named using the format releasename _ datasourcetype _ uniqueid .
Parameters for Continuous Integration Data Sources
| Parameter | Required | Description |
|---|---|---|
Type |
Yes |
Type of data source. This parameter is pre-selected and “grayed out” if you are adding a data source from the Widgets tab of the Command Center Setup dialog box. |
Source |
Yes |
Actual source of the data. |
Source Name |
Yes |
Name of the data source. This name must be unique within the release. |
Continuous Integration Schedule Project Name |
Yes |
(When using CloudBees Flow as the data source) Name of the project containing the continuous integration schedule that is associated with the release. |
Continuous Integration Schedule Name |
Yes |
(When using CloudBees Flow as the data source) Name of the continuous integration schedule that is associated with the release. |
Configuration Name |
Yes |
(When using Jenkins as the data source) Name of the Jenkins plugin configuration to use. This plugin configuration is created if it does not exist, and you must complete the following fields in the dialog box that appears.
|
Jenkins Project |
Yes |
(When using Jenkins as the data source) Name of the Jenkins project that does continuous integration builds for the release. |
Test Results URL |
No |
(When using Jenkins as the data source) Relative URL for retrieving test results from the Jenkins build. If this is not set, then test data is not retrieved. The default is |
Polling Frequency |
Yes |
(When using Jenkins as the data source) Frequency (in minutes) for gathering data. The default is 30 minutes. |
As part of the data source creation, a schedule is created in the same project as the release that runs at the specified polling frequency to get the builds from Jenkins based on the Jenkins project specified in the data source and send it to the DevOps Insight server. The schedule is named using the format releasename _ datasourcetype _ uniqueid.
Parameters for Test Automation Data Sources
| Parameter | Required | Description |
|---|---|---|
Type |
Yes |
Type of data source. This parameter is pre-selected and “grayed out” if you are adding a data source from the Widgets tab of the Command Center Setup dialog box. |
Source |
Yes |
Actual source of the data. |
Source Name |
Yes |
Name of the data source. This name must be unique within the release. |
Configuration Name |
Yes |
Name of the ALM plugin configuration to use. This plugin configuration is created if it does not exist, and you must complete the following fields in the dialog box that appears.
|
HP ALM Server Timezone |
No |
Timezone offset for the HP ALM server. 0000 is the default and stands for GMT. This is used for converting datetime fields retrieved from the HP ALM server to UTC before sending them to the DevOps Insight server. |
HP ALM Filter |
No |
Filter to retrieve test runs. For information about HP ALM filters, see https://admhelp.microfocus.com/alm/en/12.60/online_help/Content/Resources/_TopNav/_TopNav_Home.htm . |
Polling Frequency |
Yes |
Frequency (in minutes) for gathering data. The default is 30 minutes. |
As part of the data source creation, a schedule is created in the same project as the release that runs at the specified polling frequency to get the system test results from HP ALM based on the parameters specified in the data source and send it to the DevOps Insight server. The schedule is named using the format releasename _ datasourcetype _ uniqueid .
Parameters for Incident Management Data Sources
| Parameter | Required | Description |
|---|---|---|
Type |
Yes |
Type of data source. This parameter is pre-selected and “grayed out” if you are adding a data source from the Widgets tab of the Command Center Setup dialog box. |
Source |
Yes |
Actual source of the data. |
Source Name |
Yes |
Name of the data source. This name must be unique within the release. |
Configuration Name |
Yes |
Name of the ServiceNow plugin configuration to use. This plugin configuration is created if it does not exist, and you must complete the following fields in the dialog box that appears.
|
ServiceNow Source Table |
Yes |
ServiceNow source table. Set this to incident to retrieve updated incidents from ServiceNow. |
ServiceNow Filter |
No |
Filter in ServiceNow encoded query string format. For information about ServiceNow encoded query string format, see https://docs.servicenow.com/bundle/helsinki-platform-user-interface/page/use/using-lists/concept/c_EncodedQueryStrings.html. |
Polling Frequency |
Yes |
Frequency (in minutes) for gathering data. The default is 30 minutes. |
As part of the data source creation, a schedule is created in the same project as the release that runs at the specified polling frequency to get the incidents from ServiceNow based on the parameters specified in the data source and send it to the DevOps Insight server. The schedule is named using the format releasename _ datasourcetype _ uniqueid .
Parameters for Defect Data Sources
This type of data source creates a schedule that runs periodically to retrieve updated defects from JIRA and send the data to the DevOps Insight server. This occurs via the sendReportingData Perl API command.
| Parameter | Required | Description |
|---|---|---|
Type |
Yes |
Type of data source. This parameter is pre-selected and “grayed out” if you are adding a data source from the Widgets tab of the Command Center Setup dialog box. |
Source |
Yes |
Actual source of the data. |
Source Name |
Yes |
Name of the data source. This name must be unique within the release. |
Configuration Name |
Yes |
Name of the JIRA plugin configuration to use. This plugin configuration is created if it does not exist, and you must complete the following fields in the dialog box that appears.
|
Filter Type |
No |
Type of JIRA filter used to identify issues in the release. You can specify JIRA fields or a JIRA query (in JQL). |
JIRA Project |
No |
(When filtering by JIRA field) The JIRA project key that identifies the project in JIRA. |
JIRA Fix Version |
No |
(When filtering by JIRA field) The fix version in JIRA that identifies the JIRA issues of type “bug” that are part of the release. |
JIRA Query (JQL) |
No |
(When filtering by JIRA query) JQL to use to search issues. Either this parameter or “JIRA filter ID” must be specified. For example, For information about using JQL, see https://support.atlassian.com. |
Polling Frequency |
Yes |
Frequency (in minutes) for gathering data. The default is 30 minutes. |
As part of the data source creation, a schedule is created in the same project as the release that runs at the specified polling frequency to get the bugs/defects from JIRA based on the parameters specified in the data source and send it to the DevOps Insight server. The schedule is named using the format releasename _ datasourcetype _ uniqueid .
Creating or Modifying Data Sources Directly
You can also create, modify or delete data sources for each of the data source types such as User Stories and Test Automation via the Sources tab in the Command Center Setup dialog box.
To create or modify a data source directly:
-
From within the Release Command Center dashboard, click the Dashboard Editor button. The Release Command Center dashboard editor appears:
-
Click the Setup button. The Command Center Setup dialog box appears.
-
Click the Sources tab.
-
Click the add sources link, or click the New + link on the top of the dialog box. The Source Configuration dialog box appears.
You can also add data sources from within the Widgets tab in the Command Center Setup dialog box. For details, see Adding Data Sources to Populate the Dashboard . -
Select a data source type from the Select Source Type pull-down menu.
-
Select the source from the Select Data Source pull-down menu.
The list of available sources is based on the selected source type and the installed plugins that support collecting data for Release Command Center to send to the DevOps Insight server.
The fields that are relevant to the specific data source that you selected appear in the dialog box. For example:
If you want to return to the standard view, click the
 (switch to standard view) button.
 -
Complete the parameter values for the data source that you selected.
-
Click OK.
The new data source appears in the Sources tab in the Command Center Setup dialog box.