Monitor your integrated CloudBees CI and Jenkins® Multibranch Pipelines jobs and builds in CloudBees Unify value stream management (VSM) dashboards, to assist in assessing your software development process, performance, security, and testing.
Prerequisites
Set up CloudBees Unify and your CI controller to work together. For more information, including technical requirements and limitations, refer to Getting started.
| Dashboard prerequisites and example | Description | Comprehensive documentation link |
|---|---|---|
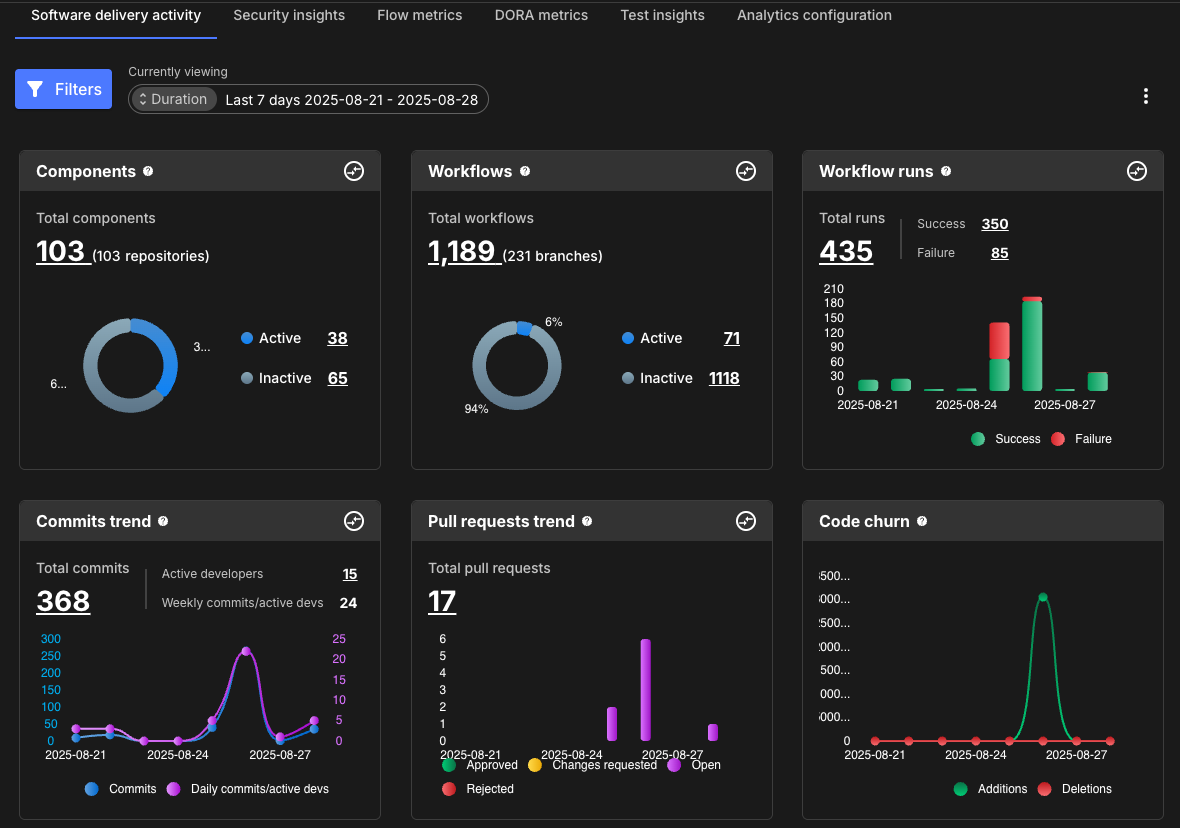
Track activities and performance in software delivery. |
Software delivery activity documentation |
|
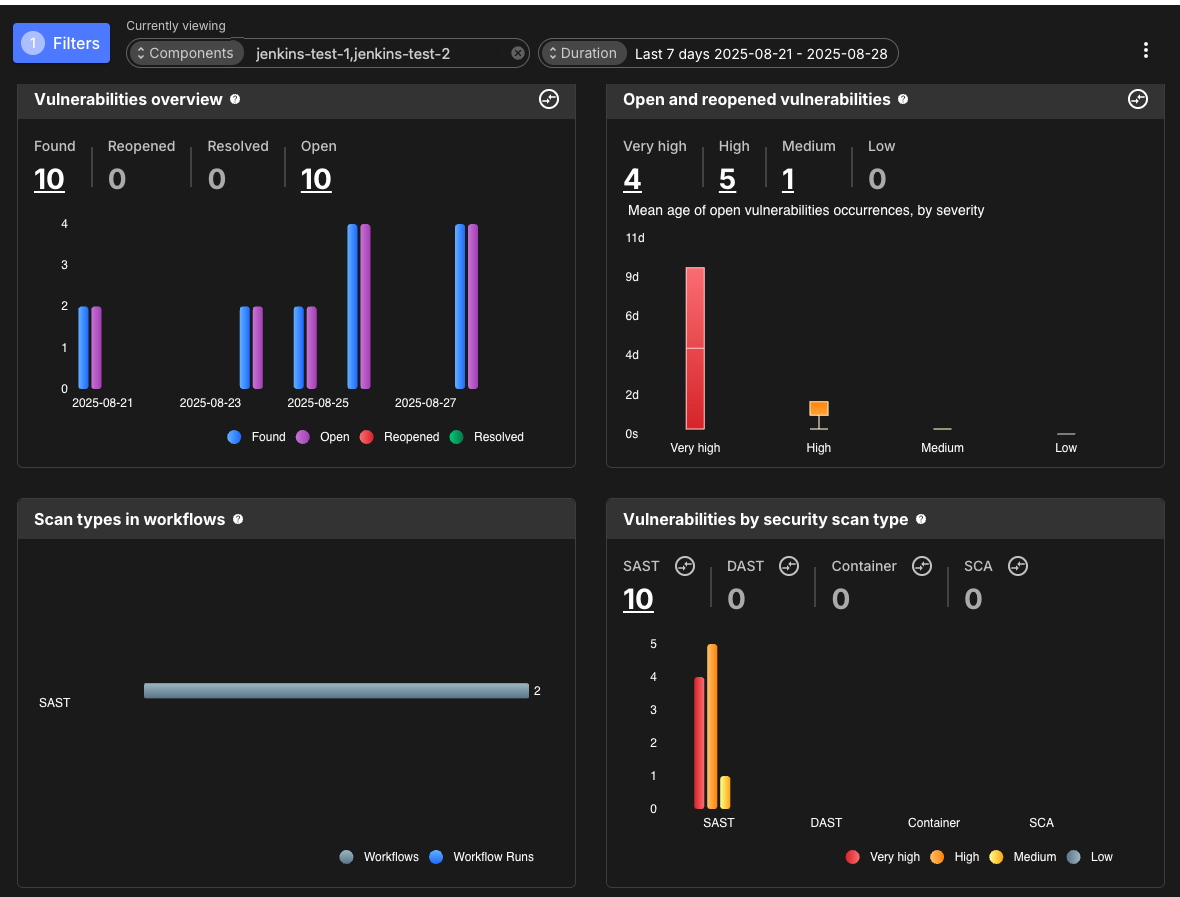
Evaluate security practices and vulnerabilities. |
Security insights documentation |
|
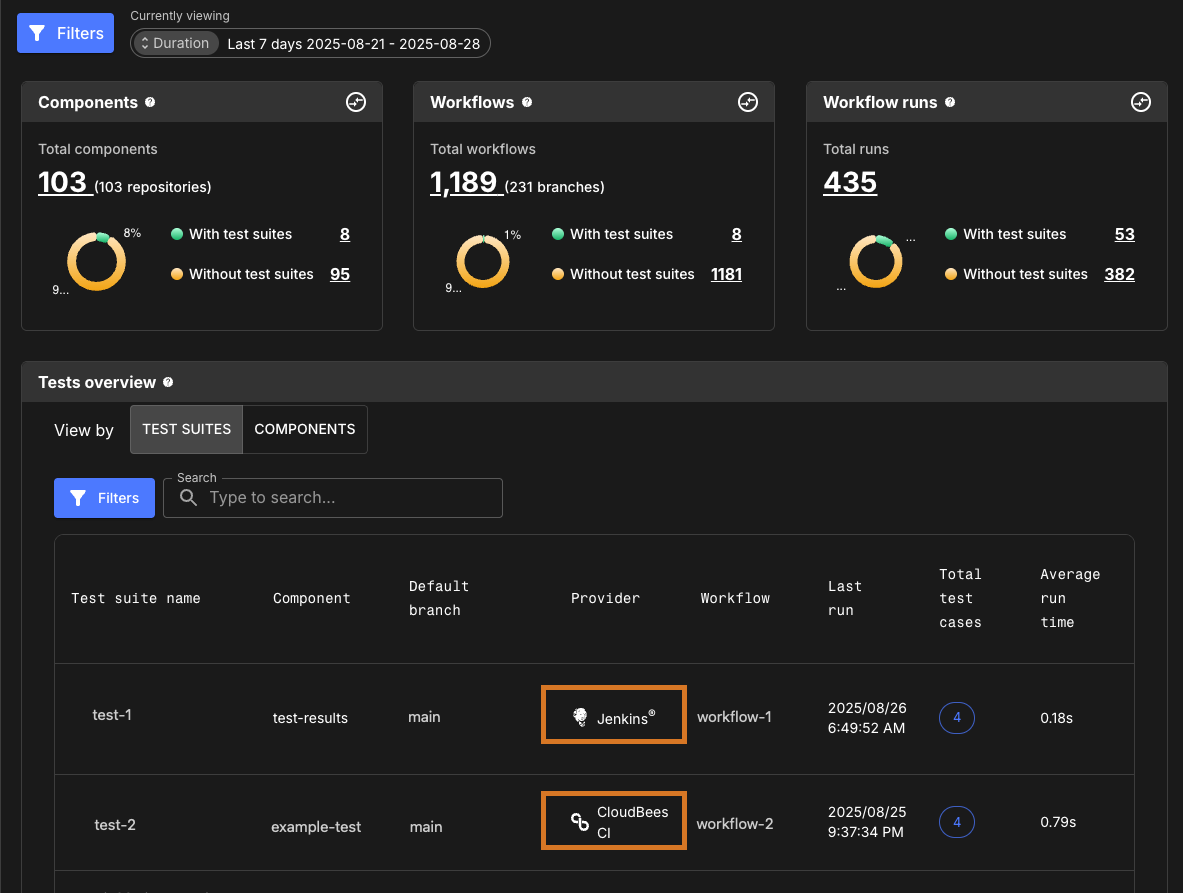
Measuring testing efficiency and effectiveness. |
Test insights documentation |
Each dashboard enables you to filter data by organization component and timeframe. In all analytics dashboards, the provider (CloudBees CI or Jenkins) is listed where applicable.
Software delivery activity
Prerequisites
To populate the Software delivery activity dashboard, register artifact metadata from an integrated CI build.
Usage example
The following is an example of with an integrated CI Pipeline connected to one component:

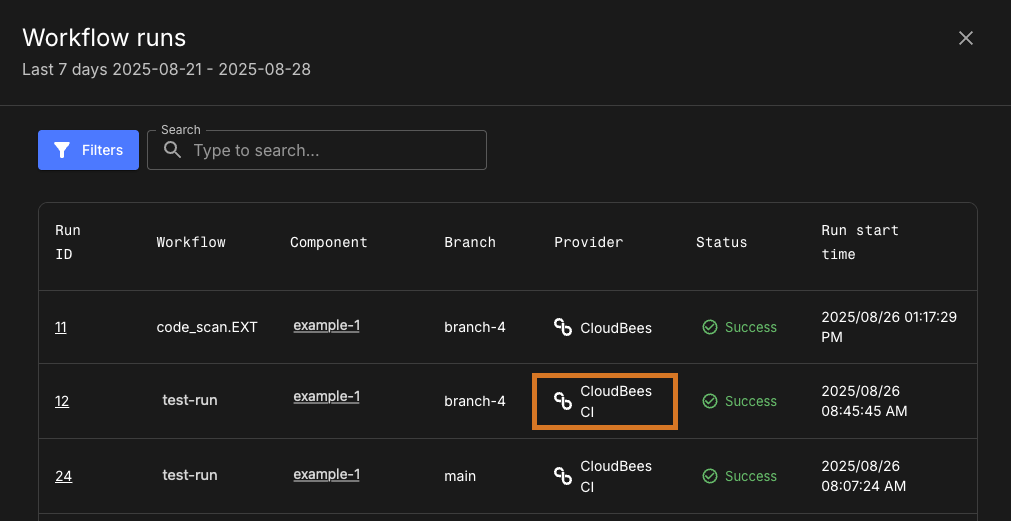
Select the linked number in the Workflow runs chart to display a list of the CI builds for the integrated Pipeline. In the below example, the Provider is indicated as CloudBees CI.

Security insights
Use the Security insights dashboard to analyze CI-integrated components, track vulnerabilities by severity and scan type, monitor SLA compliance, and assess mean time to resolve (MTTR) vulnerabilities.
Prerequisites
To populate the Security insights dashboard, report scan results to CloudBees Unify.
Test insights
Get a deep understanding of software code quality, performance, and security with the Test insights dashboard.
Prerequisites
To populate the Test insight dashboard, publish test results from an integrated CI build.

