Welcome to CloudBees Unify!
Sign up using Google social or GitHub OAuth credentials, or sign up by entering an email and password. Refer to Users for detailed information on setting up an account.
Once you have created an account, go to your email, open the invitation email with subject line CloudBees Email Verification, and select Verify. Alternatively, you can copy and paste the available link into your browser.
For more information on all types of CloudBees Unify accounts, refer to Users and Teams.
Choose a pathway
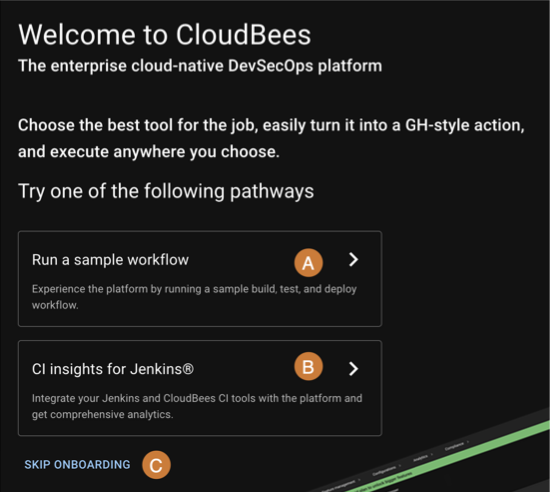
Once you are signed in to CloudBees Unify, choose one of the following:
Navigating CloudBees Unify
The breadcrumb navigation at the top displays your current organization. Select from the organization options to switch to a different organization or sub-organization. Select any of the breadcrumb links to navigate to a different entity of CloudBees Unify.
Select menu items on the left pane to display:
-
The Home page, where you can:
|
Select |
Run a sample workflow
Choose Run a sample workflow to connect a repository of your choice and set up a workflow that includes a security scan on the source code. For further examples, refer to:
To run a sample workflow:
-
Select a source code management provider from the options.
-
Select an integration type. Refer to create an SCM integration for more information.
-
Follow the instructions at the provider to connect your repository to CloudBees Unify.
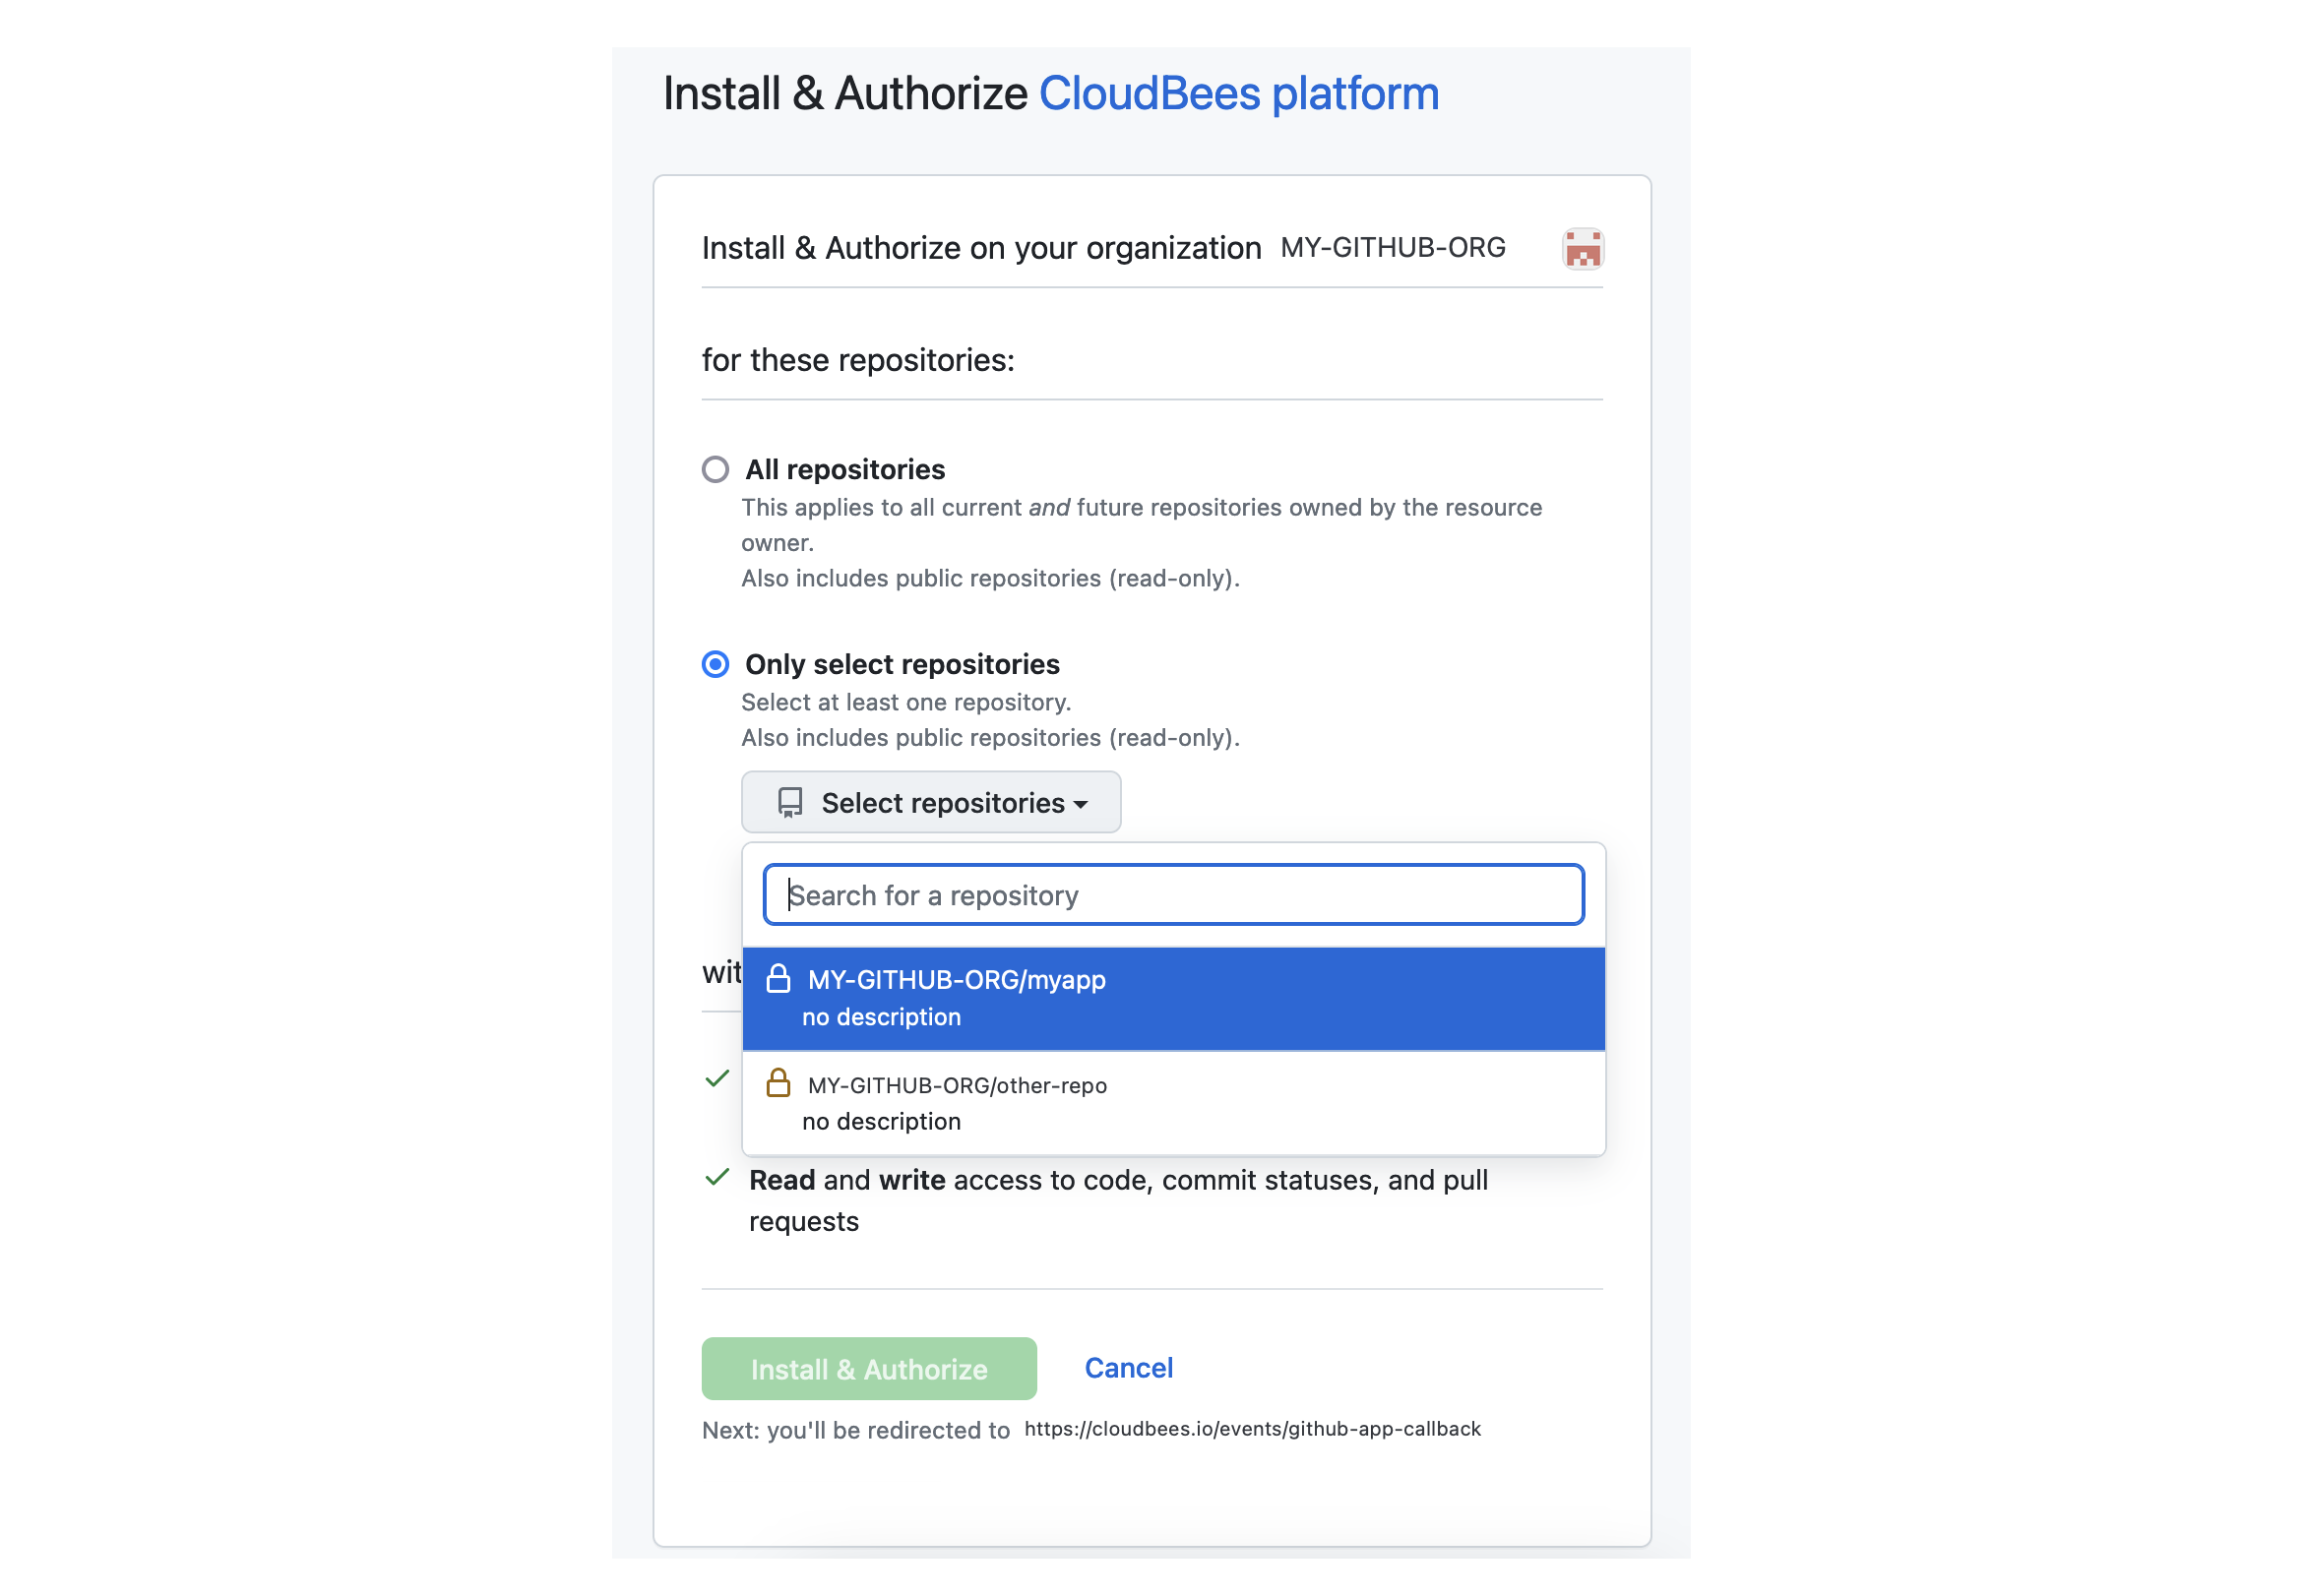 Figure 2. Completing the GitHub App installation.
 -
Create a component by:
-
Select a connected repository from the options.
-
(Optional) Update the component name from the default, which is the repository name with any symbols converted to underscores (
_). -
(Optional) Enter a description.
-
Select Create component.
-
-
Select Open workflow to display the proposed workflow, which includes:
-
A step to check out the repository.
-
A SonarQube SAST scan of the repository code, with automatic language detection.
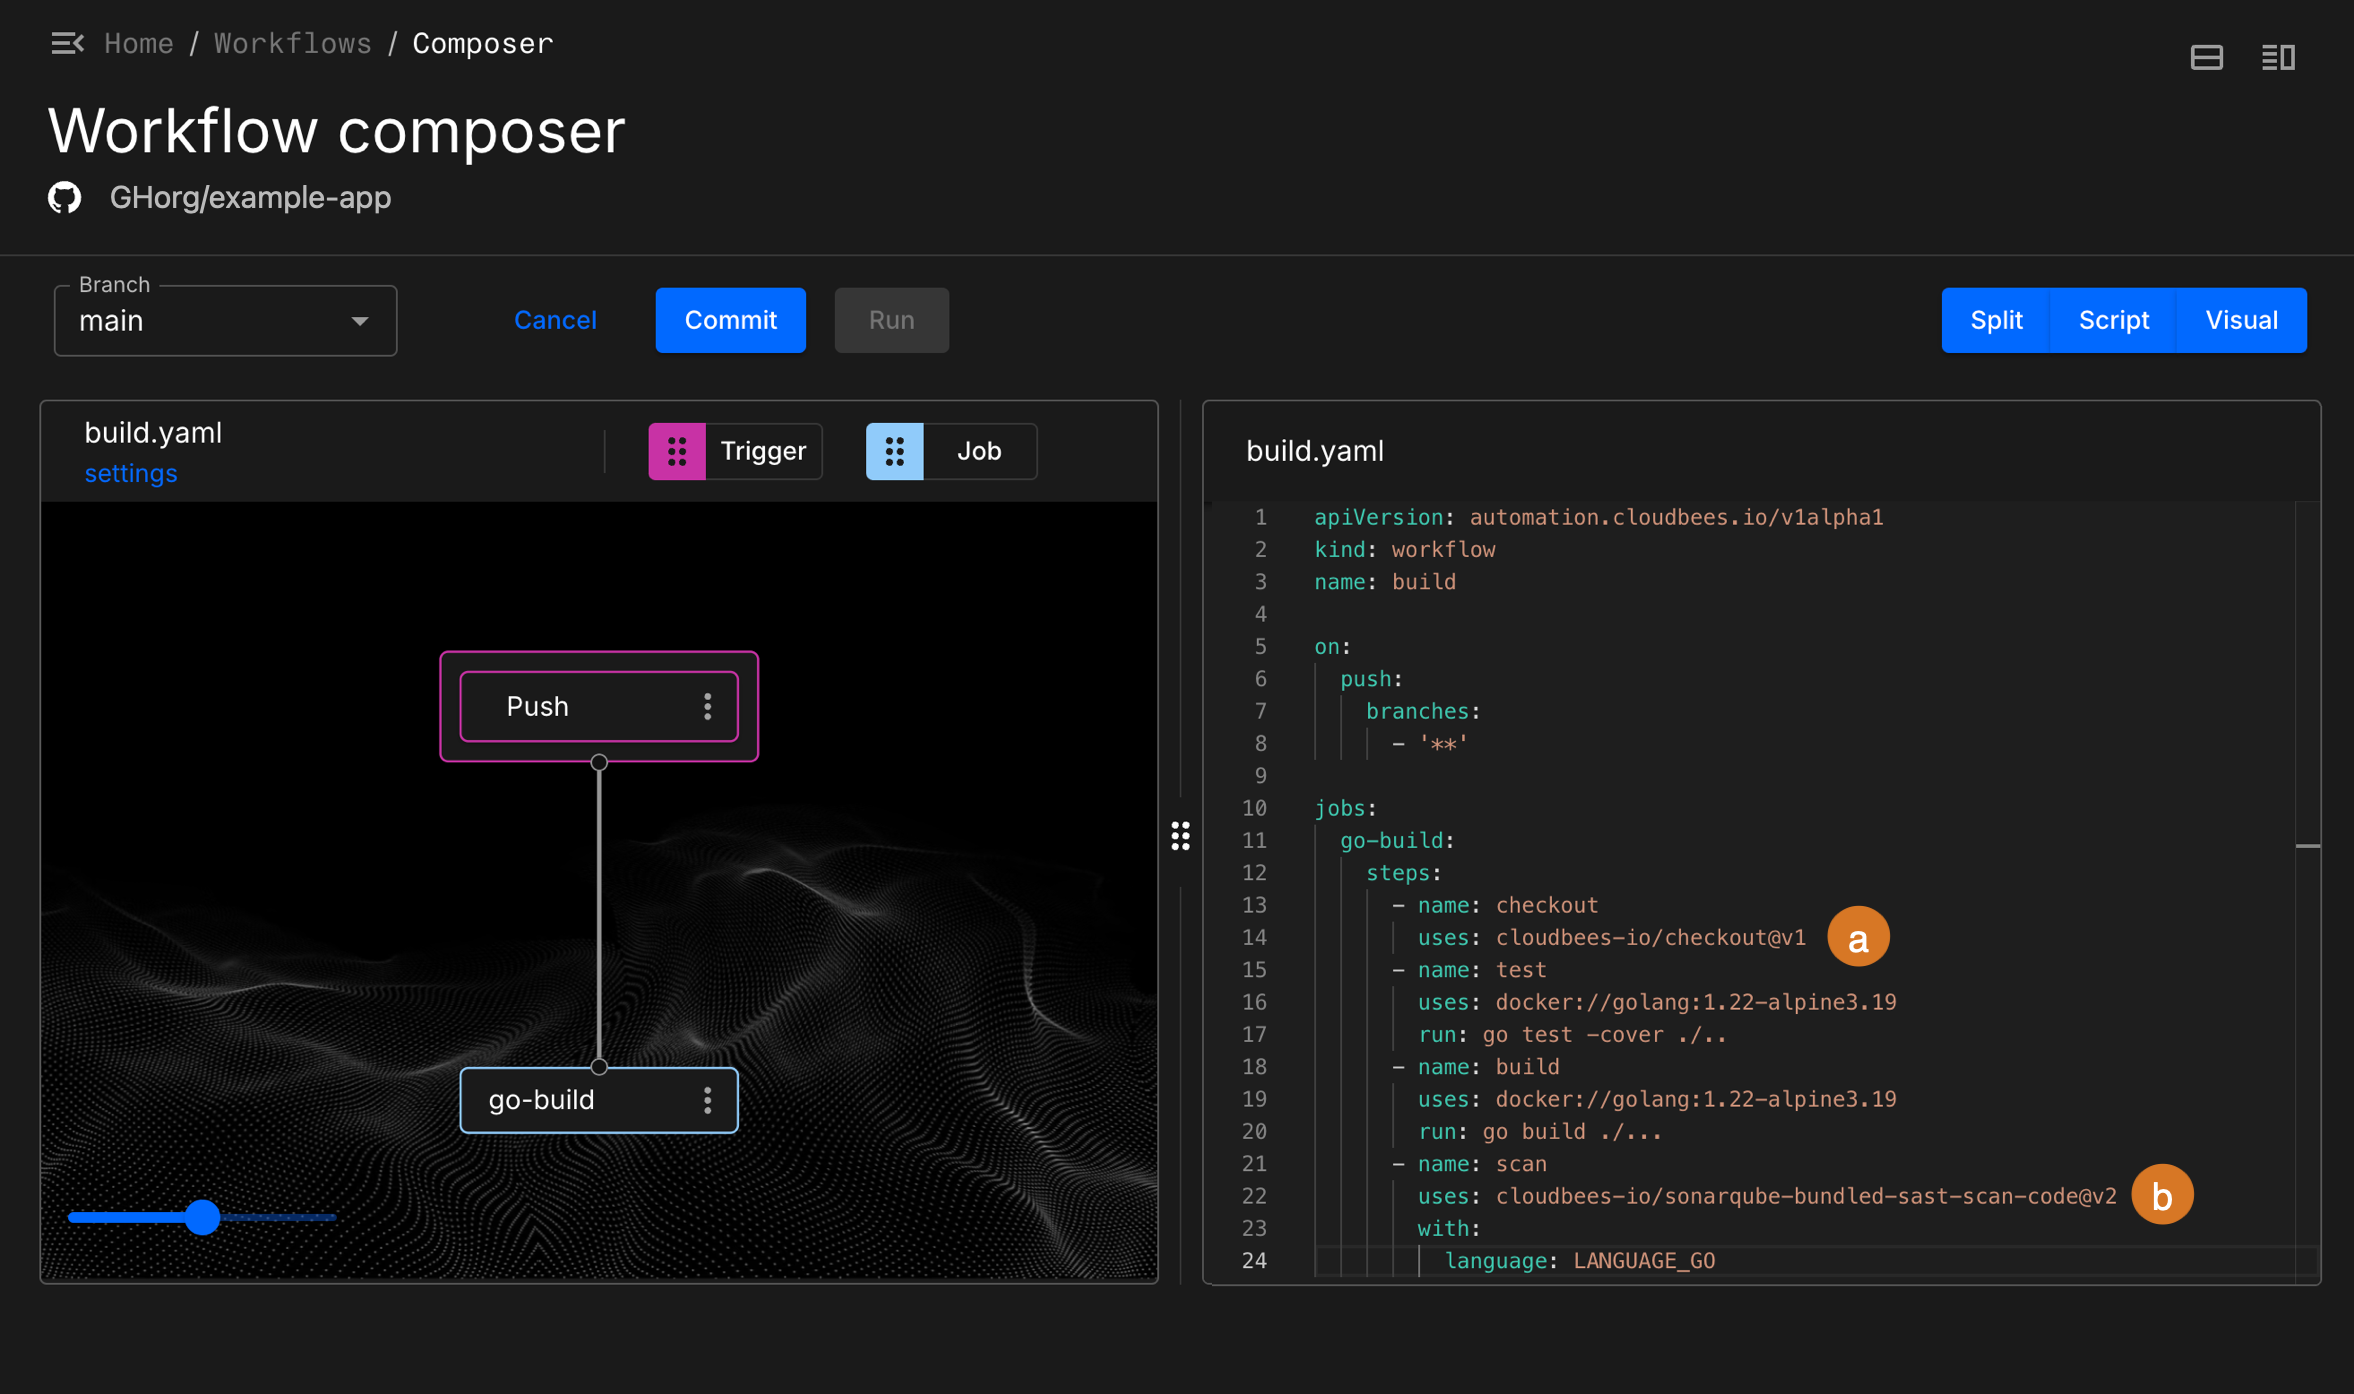 Figure 3. A sample Go app workflow with scan.
-
-
(Optional) Make any desired updates, either in the workflow composer code editor, or by using the visual tool. By default, the workflow trigger is set to
push.Refer to Managing workflows to learn more about:
-
Using the workflow composer, both the code editor and the visual tool.
-
Using different trigger options.
-
Adding and updating workflow steps and jobs.
-
-
Save and run the workflow:
-
Select Commit.
-
Enter a commit message.
-
Select to commit to either:
-
The current branch.
-
A new branch (and enter a new branch name).
-
-
Select Finish.
-
The Run a sample workflow path is completed accordingly. Select Runs, and then select your run to display the results.
Run details
Run details provides a comprehensive summary of each run executed in CloudBees Unify, including logs of each workflow step, any evidence generated for compliance requirements, and results of any tests run as part of the workflow.
To access the details of a run, select the commit name, or in the case of a manual trigger, the workflow name, of a run from the Runs summary.

The example above displays the following information in Run details:
-
Repository and branch names.
-
Run management options:
-
Select Rerun workflow to rerun a workflow without a commit (within 7 days of the original run).
-
Select New run to run a workflow without a commit (manual trigger only).
-
Select Stop run to cancel a run while it is executing.
-
-
The run number and the status:
-
Processing
-
Successful
-
Failed
-
-
Triggered by: If the run is manually triggered, the user who triggered it is named.
-
Run times:
-
Start date and time
-
End date and time
-
Duration
-
-
Two views:
-
The Jobs view displays the workflow steps, the logs, and any evidence generated.
-
The Test results view displays results of testing performed during the run.
-
The Jobs view in Run details displays an overview of the workflow steps and detailed logs for each step. If a job has been configured to generate evidence, the evidence is also displayed.
|
Select the |
To access the logs for a run:
-
Select the commit name, or in the case of a manual trigger, the workflow name, of a run from Runs.
-
Select the Jobs tab, and then select the Logs tab.
The run log is displayed accordingly.
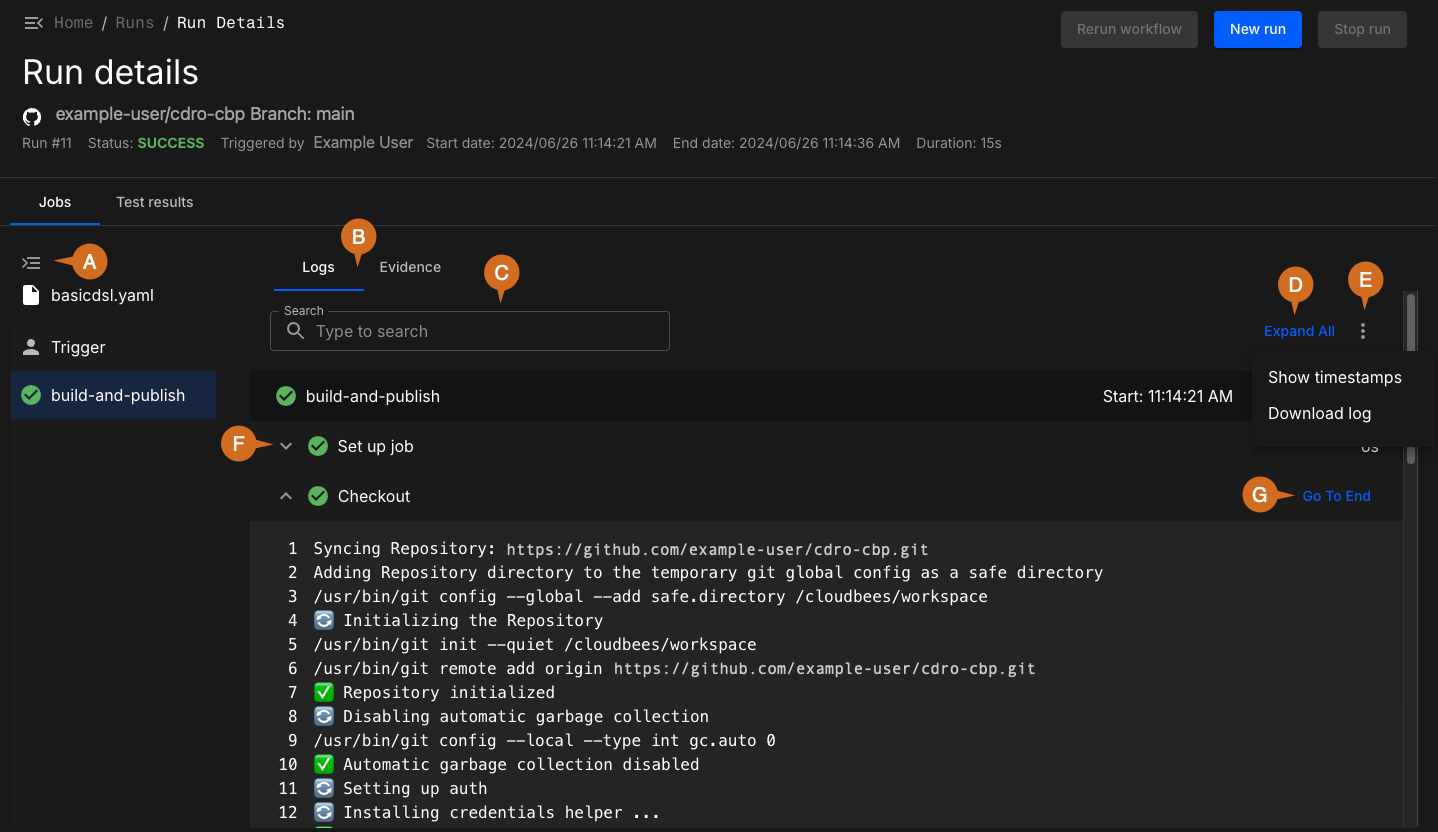
As in the example above, Logs includes the following options:
-
Select
 to display/hide the workflow composer visual tool.
 -
Select the Logs tab to display the logs.
To display published evidence data, select the evidence tab. In the Logs view:
-
Enter text to Search within the log. Select
 and
and  to step through the log and highlight found instances.
Select to clear the search.
 -
Select Expand all/Collapse to expand/collapse logs for all steps.
-
Select
 , and then:
-
Select Show timestamps or Hide timestamps to display or hide, respectively, the timestamp next to each log line number.
-
Select Download log to download a compressed archive file of the log.
-
-
Select
 next to any run step to display its log.
 -
Select Go to end to scroll down to the end of a step log or the list of steps.
|
Use CI Insights for Jenkins
Choose CI insights for Jenkins to manage all of your automation in a single dashboard.
To use CI insights for Jenkins:
-
Select a CI tool from the options.
 Figure 6. Integrate three different kinds of CI tools.
 -
Connect your CI tool to CloudBees Unify using the instructions. Refer to CI tools integration for more information.
-
Install the required plugin(s).
-
Copy and paste the authentication code into your CI tool.
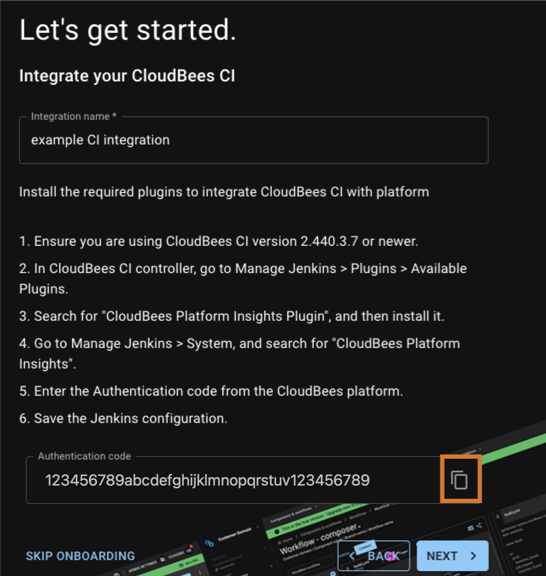 Figure 7. Select the highlighted icon to copy the authentication code.
-
Once you have copied and saved the authentication code into your CI tool, you are redirected to the CI insights for Jenkins dashboard.
| You may not immediately see ingested data displayed. |
To learn more about the dashboard details, refer to the Analytics documentation.