The CI insights for Jenkins dashboard provides valuable Jenkins and CloudBees CI operations data in a consolidated view. These metrics help administrators monitor pipeline health, proactively address high-volume peaks, and enable their teams to run more efficiently.
The following data is displayed:
-
System information and health
-
Overview of project types
-
Completed runs
-
Usage patterns
-
Project activity
| You must first set up the CI tools integration to view the CI insights for Jenkins dashboard. |
|
Use the following features to access the data on this dashboard:
|
Create a CI tools integration
Connect the platform to your CloudBees CI and Jenkins instances. Once you have created an integration, data is available in the CI insights for Jenkins dashboard.
Refer to Create a CI insights integration to learn how to connect the platform to CloudBees CI or Jenkins.
Access and filter CI insights for Jenkins
Select the CI tool integration and the time frame of data for analysis in the CI insights for Jenkins dashboard. By default, the last seven days of data are displayed.
-
Select .
-
Filter for the data you want to display by selecting the following:
-
Select Filter.
-
Select a CI tool integration from the options.
-
Select a Duration from the following options:
Table 1. Duration filter definitions Duration Definition Current week
Current week in the month, Monday to Sunday schedule. For example, if current day is Tuesday, only data from Monday and Tuesday are displayed.
Previous week
Previous week in the month, Monday to Sunday schedule.
Two weeks back
Two weeks prior in the month, Monday to Sunday schedule.
Current month
First day of current month up to current day.
Previous month
First day to last day of previous month.
Two months back
First day to last day of two months prior.
Last 7 days
The past seven days.
Last 30 days
The past 30 days.
Last 90 days
The past 90 days.
Custom range
-
Select Apply.
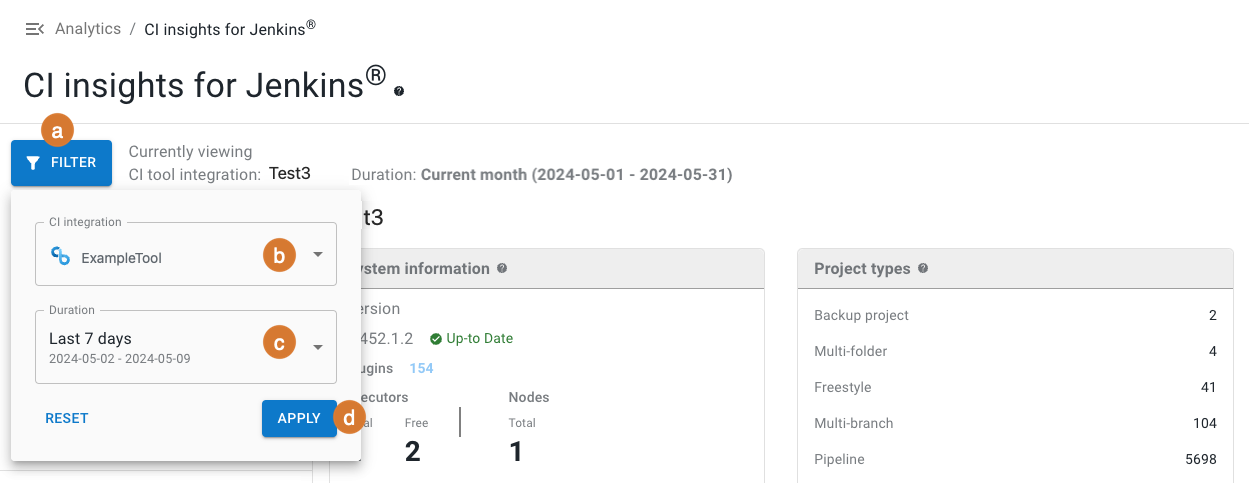 Figure 1. Filtering for the desired CI integration and duration.
-
The data are filtered accordingly and displayed in the CI insights for Jenkins dashboard.
Set a custom date range
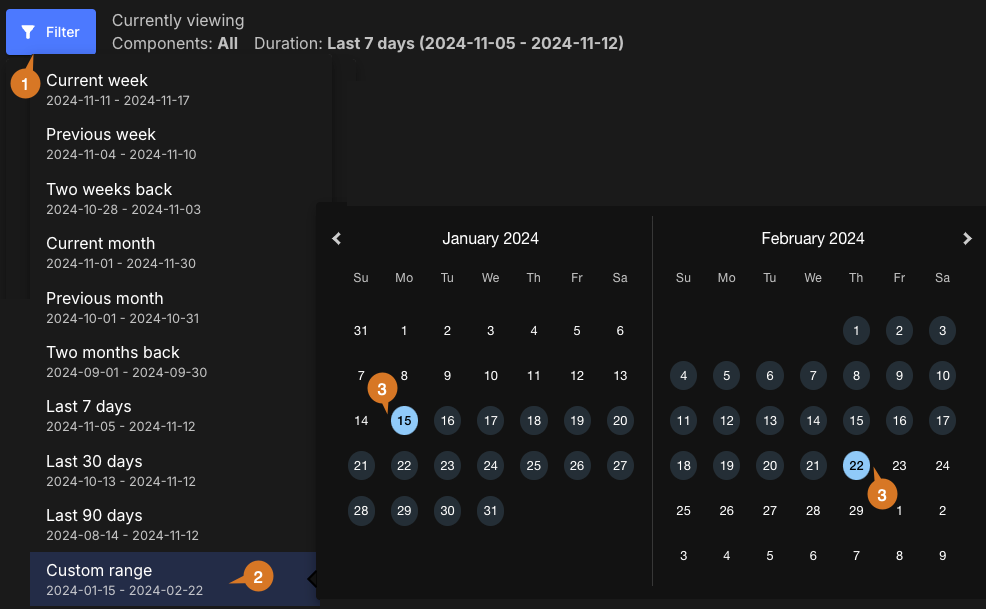
To set a custom date range:
-
Select FILTER.
-
Select Custom range.
-
Select dates for the time frame start and end.
The custom date range is set accordingly and displayed in blue on the date picker. You can view the analytics data for any desired time frame, as in the example below:
Customize the dashboard
Customize the dashboard to display only the charts and tables that matter the most to you.
|
Only charts and tables with |
To customize the dashboard:
-
Select Analytics on the left pane, and then select the dashboard.
-
Select
 on the top right of the dashboard.
 -
Select Edit dashboard.
-
(Optional) Remove a chart or table from the dashboard.
-
Select
 next to the chart or table you want to remove.
 -
Select Save.
-
-
(Optional) Add back a chart or table to the dashboard.
-
Select Add chart/table to display a list of the available charts or tables.
-
Select Add to dashboard next to the item to add.
-
Select Apply.
-
-
(Optional) Rearrange items on the dashboard by dragging them into place.
The dashboard is customized accordingly.
Controllers, system information, and project type views
Get an overview of controllers, plugins, system information and project types for the filtered CI tool data in a specified time frame.
Connected controllers
All connected controllers are listed on the leftmost table, as in the example displayed below:
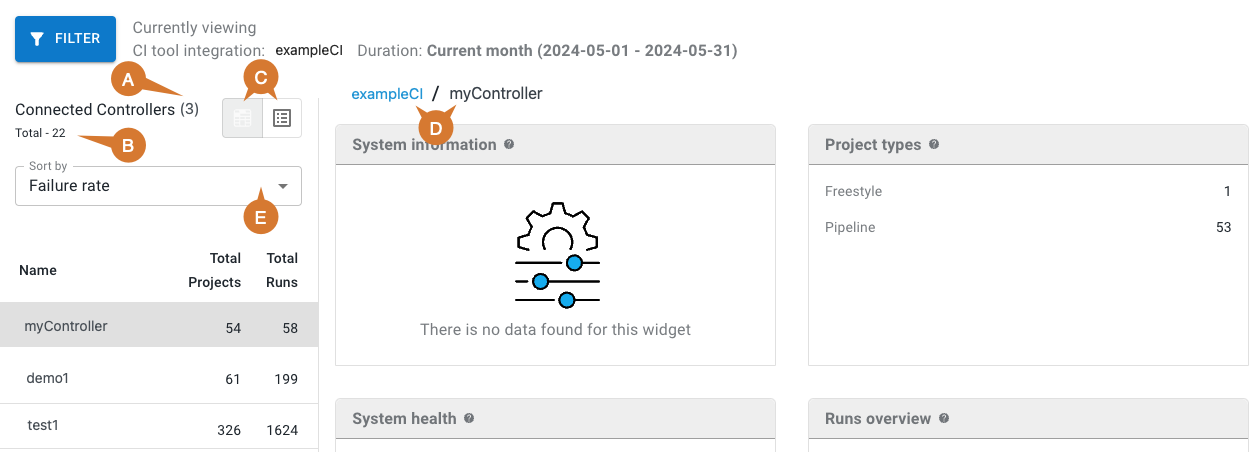
The list of connected controllers includes the following information:
-
Number of connected controllers.
-
Total number of controllers.
-
Select to display connected controllers as a list (left) or in a heat map (right). If the latter, select a section to display:
-
Controller name
-
Total jobs
-
Total number of runs
-
Failure rate
-
-
Select the CI tool link to display data for all connected controllers.
-
If a controller is selected from the list, only the data from that controller is displayed, and the controller name is listed to the right of the CI tool link.
Select from the following options to sort:
-
Name
-
Failure rate
-
Number of projects
-
Last active
System information and project types
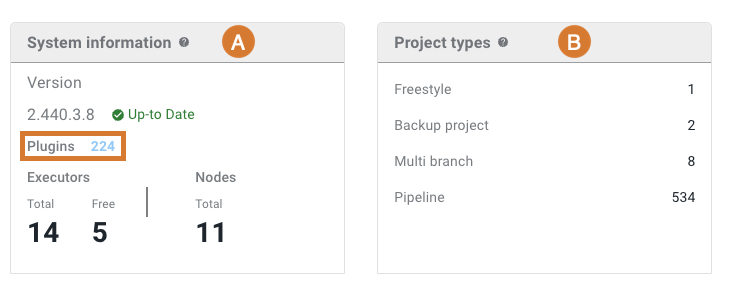
As displayed below, the system information table includes the version, number of plugins, executors, and nodes. The project types table lists the number of each project type.
-
System information displays the following details:
-
The Jenkins version number.
-
Whether the current version is up-to-date.
-
The number of plugins installed, including a link to more plugin information.
-
The number of executors and nodes.
-
-
Project types displays the number of each of the following project types:
-
Backup
-
Freestyle
-
Multi-branch
-
Pipeline
-
Plugin information
Select the number link to the right of Plugins to display a list of installed plugins information, such as displayed below.
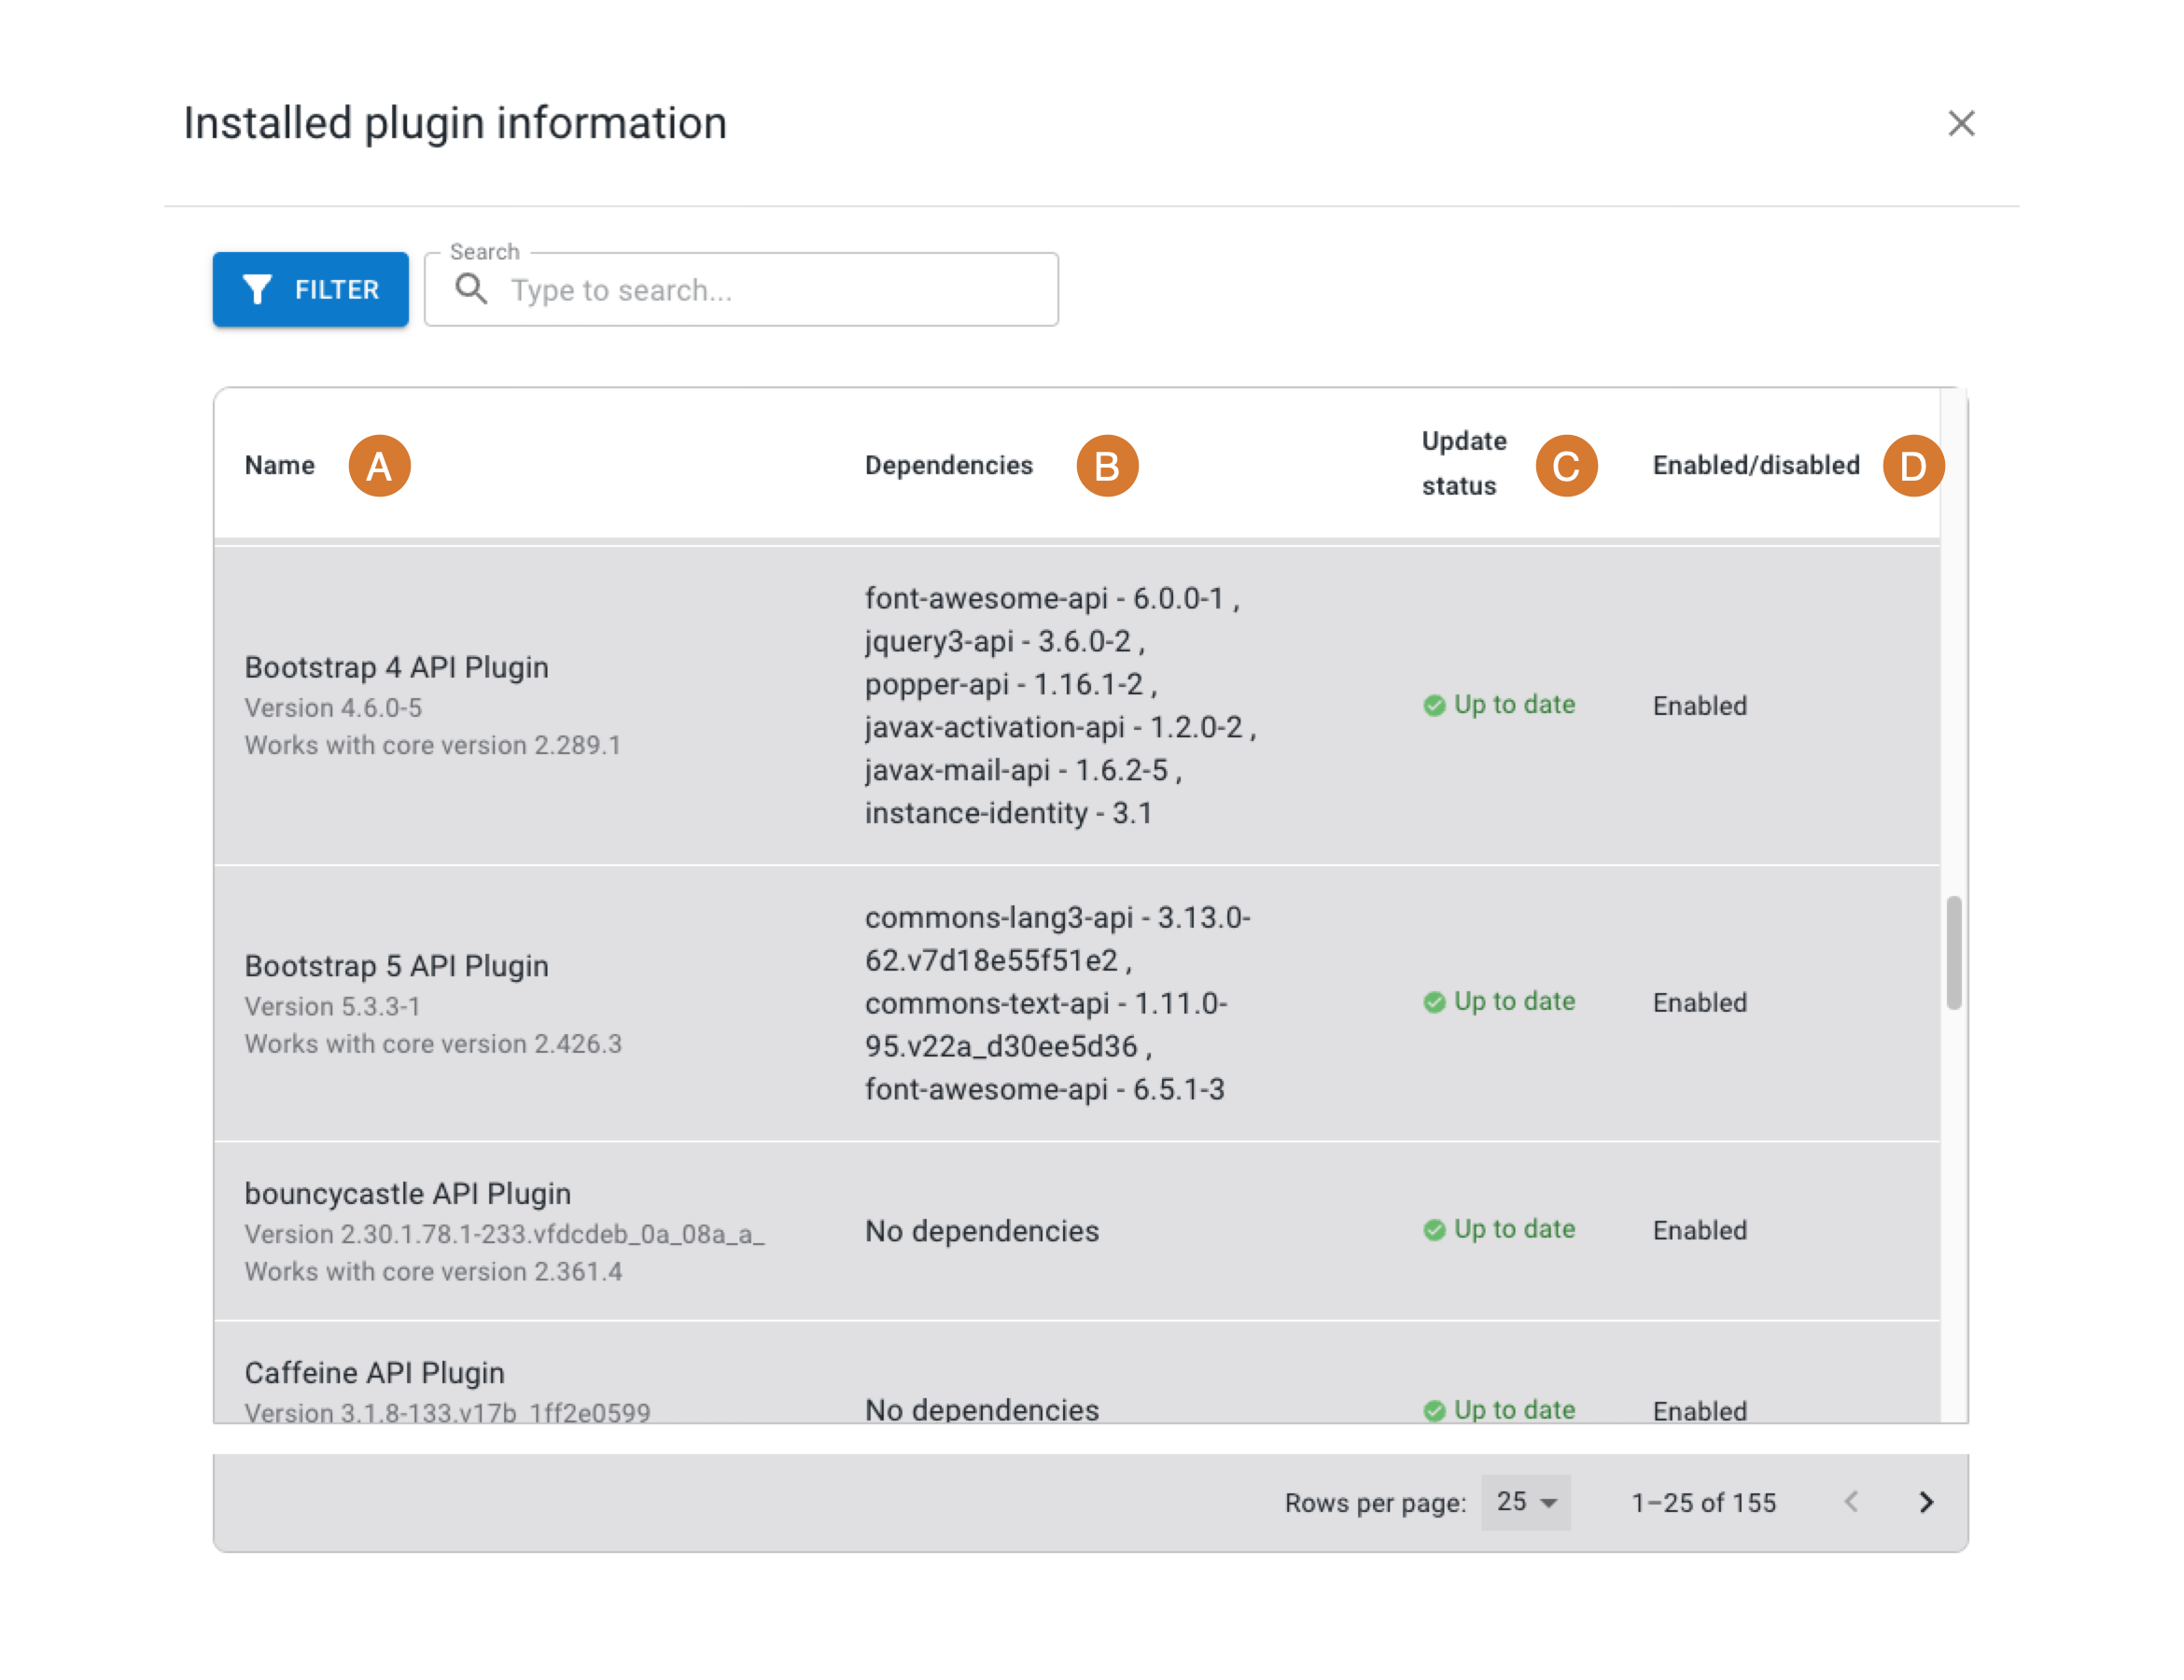
Plugins information displays the following installed plugin details:
-
Name and version
-
Dependencies
-
Update status (either Up to date or New version available)
-
Enabled/disabled status
System health and runs overview
Get an overview of system health and jobs/pipeline runs for the filtered CI tool data in a specified time frame. Representative tables are displayed below.

-
System health displays an overall Health score, based on the following four parameters.
Table 2. Definitions of System health data Parameter name Definition Analytical importance Plugins
All installed extensions for Jenkins
Returns Failed if any plugins fail to start. CloudBees recommends that you explicitly disable any failing plugins, or resolve any issues with plugin dependencies.
Thread deadlock
A condition where two or more threads may hang indefinitely, waiting for each other.
Returns Failed if there are any deadlocked threads in the Jenkins JVM. Thread deadlocks may degrade Jenkins’ performance or cause it to crash.
Disk space
Disk storage, configured to be below a specific threshold.
Returns Failed if any monitors report disk space as less than the configured threshold, and any message references the first node to fail this check.
Temporary space
Temporary storage, configured to be below a specific threshold. Jenkins must create temporary files during job and build execution.
Returns Failed if any monitors report temporary space as less than the configured threshold, and any message references the first node to fail this check.
-
Runs overview displays actual data for the following parameters:
Table 3. Definitions of Runs overview data Parameter name Definition Analytical importance Active runs
The total number of jobs/pipelines executing, queued, or awaiting user input, across all CI/CD servers.
This analysis provides real-time insights and expected activity trends to detect problems.
Idle executors
The number of online, yet unused, resources.
A high number of idle executors, coupled with queued jobs, suggests either a mismatch in cluster load or restrictions on running jobs.
Runs waiting to start
The number of queued job/pipeline runs.
This analysis of queue lengths based on current time and the day of week can help identify real-time anomalies. High numbers of runs waiting to start suggests insufficient executor resources, which can mean longer overall lead time, especially wait times for developer feedback on builds.
Average time waiting to start
The average time for queued build requests.
Monitor this time to identify bottlenecks caused by long-running jobs. Adjustments, such as increasing the number of executor slots or easing concurrent execution limits, can improve overall feedback cycle time and enhance performance.
Current time to idle
The estimated time until all active jobs are completed.
This estimation aids in identifying anomalies and in determining the best time to restart Jenkins controllers without disrupting ongoing tasks.
Completed runs
The Completed runs chart displays build outcomes by job, date and time for the filtered CI tool data in a specified time frame, as displayed in the example below:
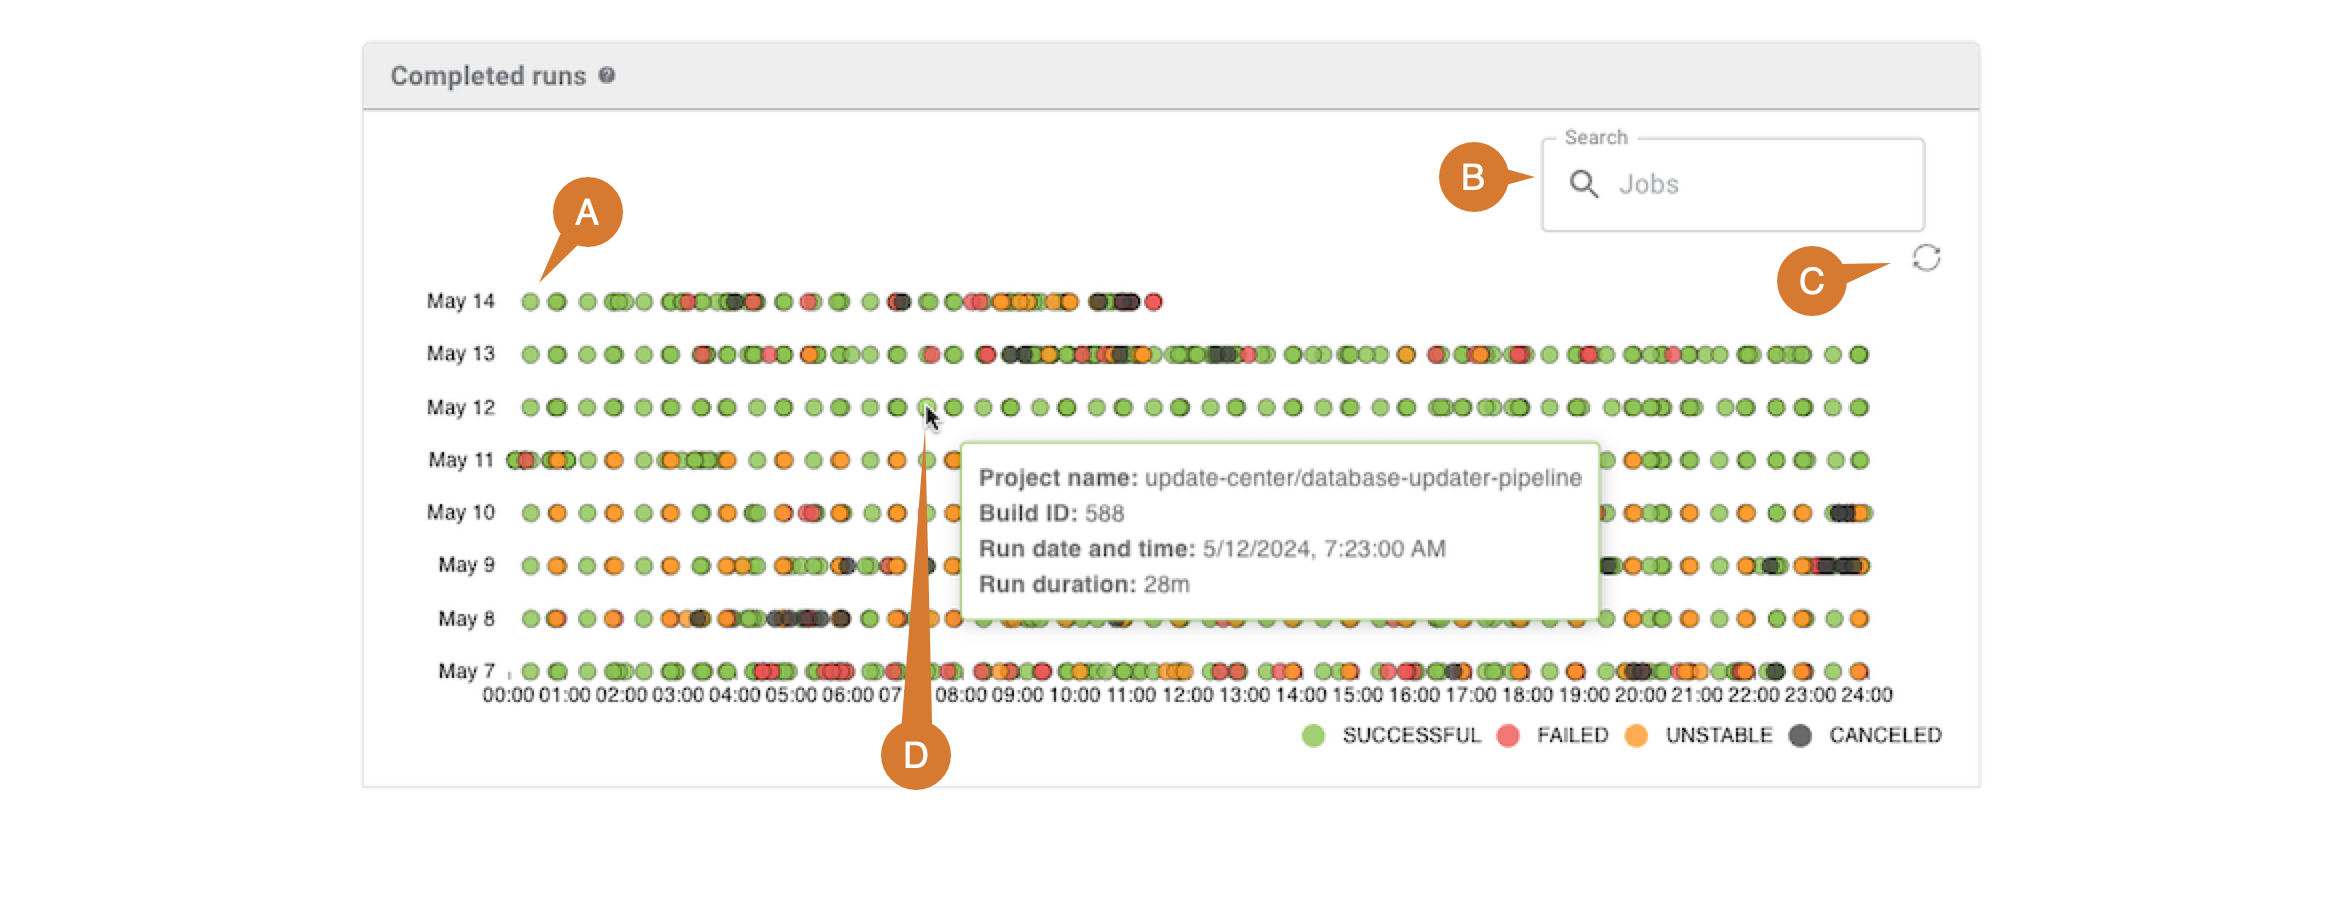
The following details and options are available:
-
Each data point represents a completed run, and its color indicates the run status:
-
Green: Successful
-
Red: Failed
-
Orange: Unstable
-
Gray: Canceled
-
-
Enter all or part of a job name into Search to filter the completed runs display by job name.
-
Scroll within the chart area to adjust the time frame displayed on the x-axis. Select
 to restore to the default time frame.
 -
Hover over a data point to display detailed run information, including:
-
Controller name (if a controller is not already selected)
-
Project name
-
Build ID
-
Run date and time
-
Run duration
-
Project run details
Select a data point to display details of all completed runs for a selected project, as in the example below:
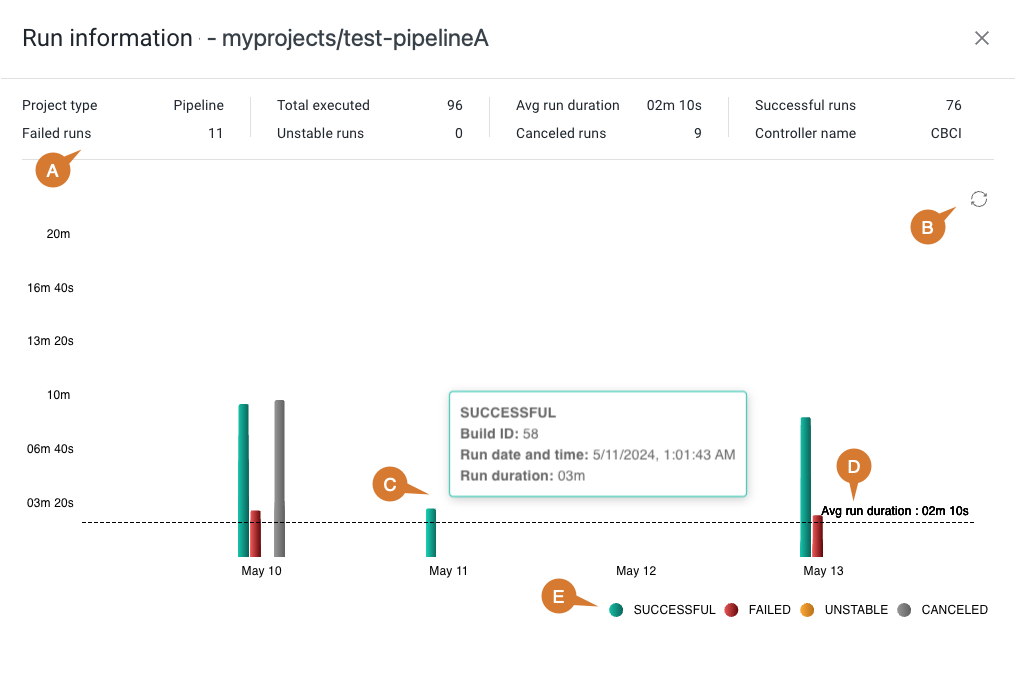
The following details and options are available:
-
At the top of the chart, the following information is listed:
-
Project type
-
Number of failed runs
-
Total runs executed
-
Number of unstable runs
-
Average run duration
-
Number of canceled runs
-
Number of successful runs
-
-
Scroll within the chart area to adjust the time frame displayed on the x-axis. Select
 to restore to the default time frame.
 -
Hover over a bar on the chart to display detailed run information, including:
-
Status
-
Build ID
-
Run date and time
-
Run duration
-
-
The run duration is listed on the y-axis, and the average run duration is displayed as a dotted line.
-
Each bar on the chart represents a completed run, and its color indicates the run status:
-
Green: Successful
-
Red: Failed
-
Orange: Unstable
-
Gray: Canceled
-
Select a bar on the chart to display the CloudBees Pipeline Explorer for that run.
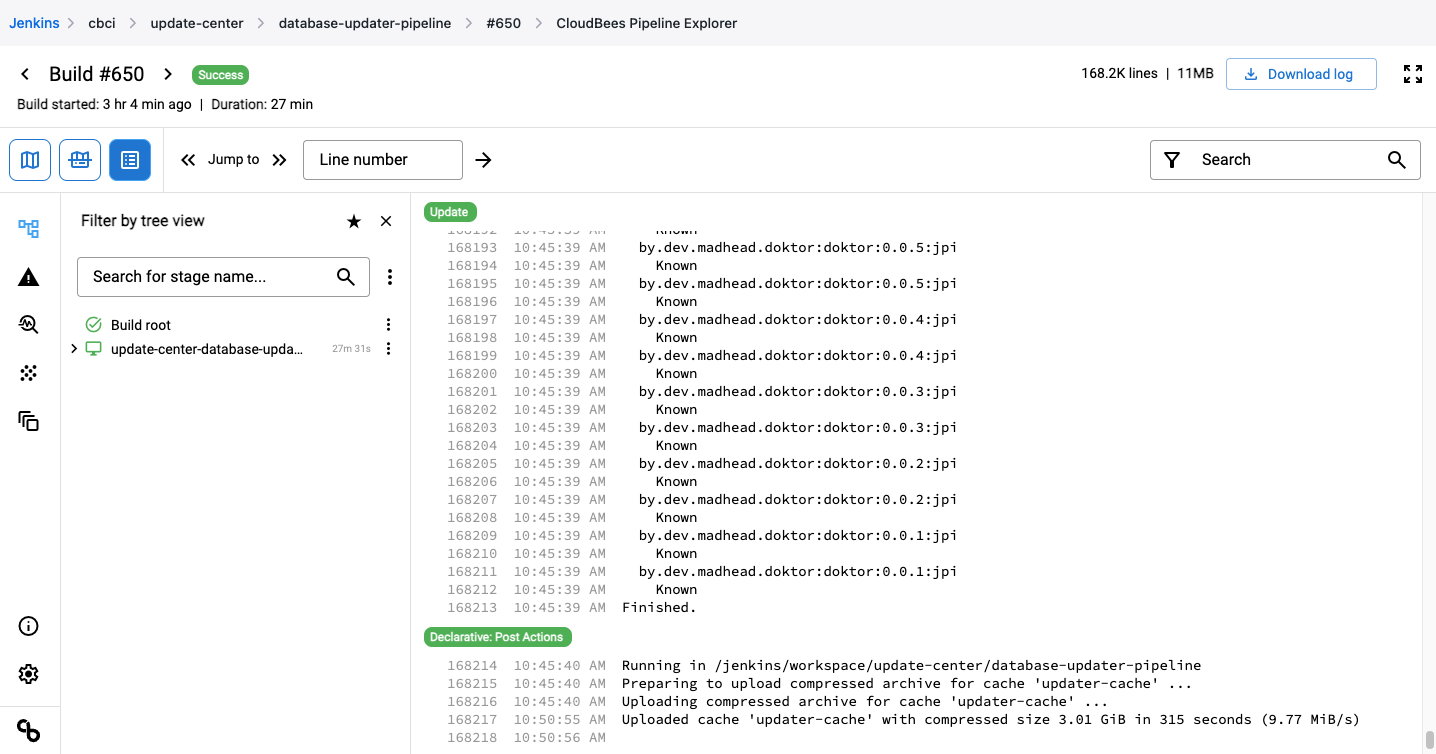
For more information, refer to the CloudBees Pipeline Explorer plugin page.
Usage patterns
The Usage patterns chart displays run activity patterns over the course of a week for the filtered CI tool data in a specified time frame.
The activity for each hour of a week, starting from Sunday at 12am, and ending on Saturday at 11pm, is represented as a blue dot. A gray dot represents no activity for that specific day of the week and hour of the day.
The larger the blue dot, the longer the time duration or the higher the number, as appropriate, for each of the following views:
| View | Definition |
|---|---|
Active runs |
The number of active runs. |
Average time waiting to start |
The average time elapsed before a run starts. |
Current time to idle |
The time elapsed before all runs are idle. |
Idle executors |
The number of idle executors. |
Runs waiting to start |
The number of runs waiting to start. |
Hovering over a dot displays the exact number or time duration, as appropriate, for the chosen view.
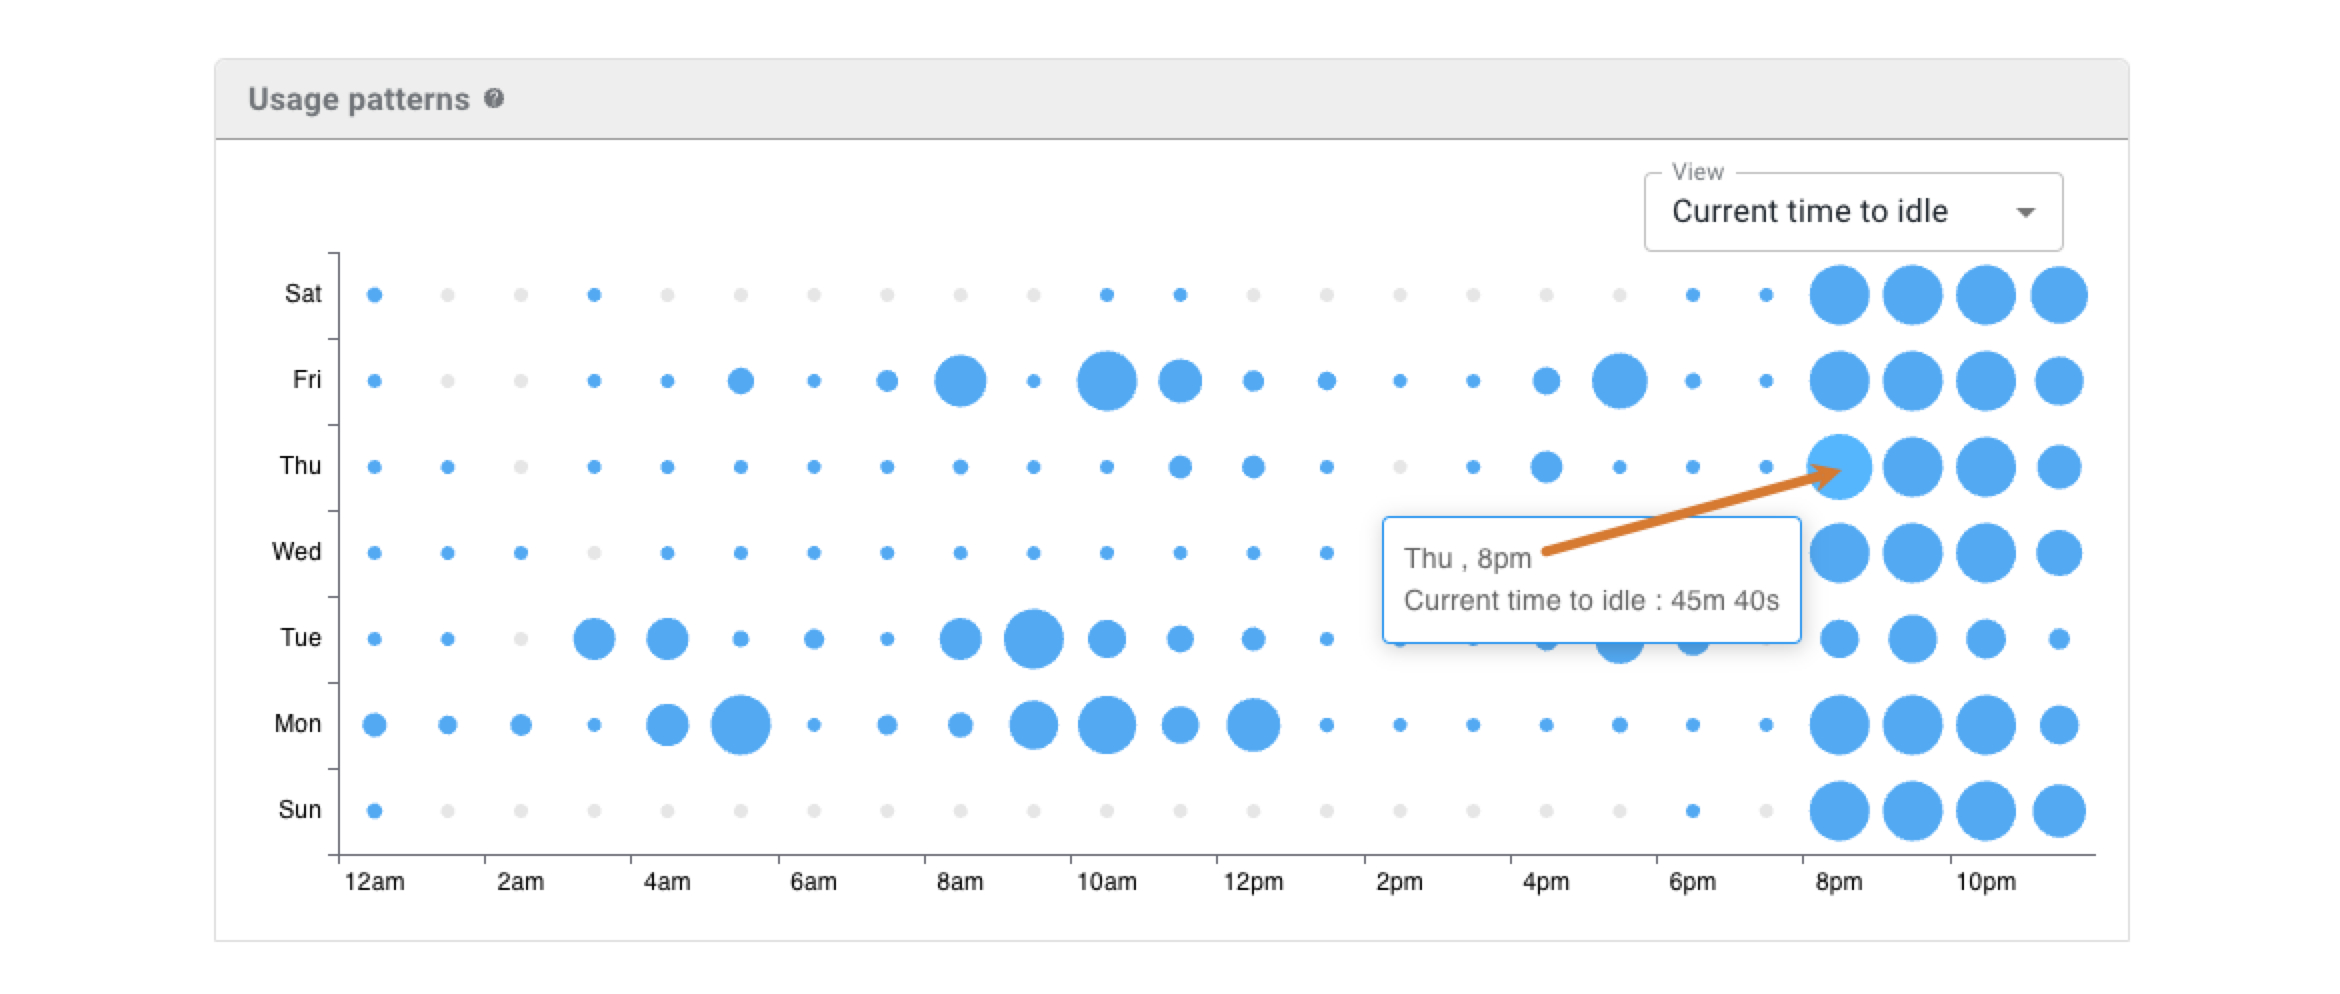
Usage patterns can help you better understand usage peaks in order to optimize resources.
Projects activity
The Projects activity table lists each project for the filtered CI tool data in a specified time frame, as displayed in the example below:
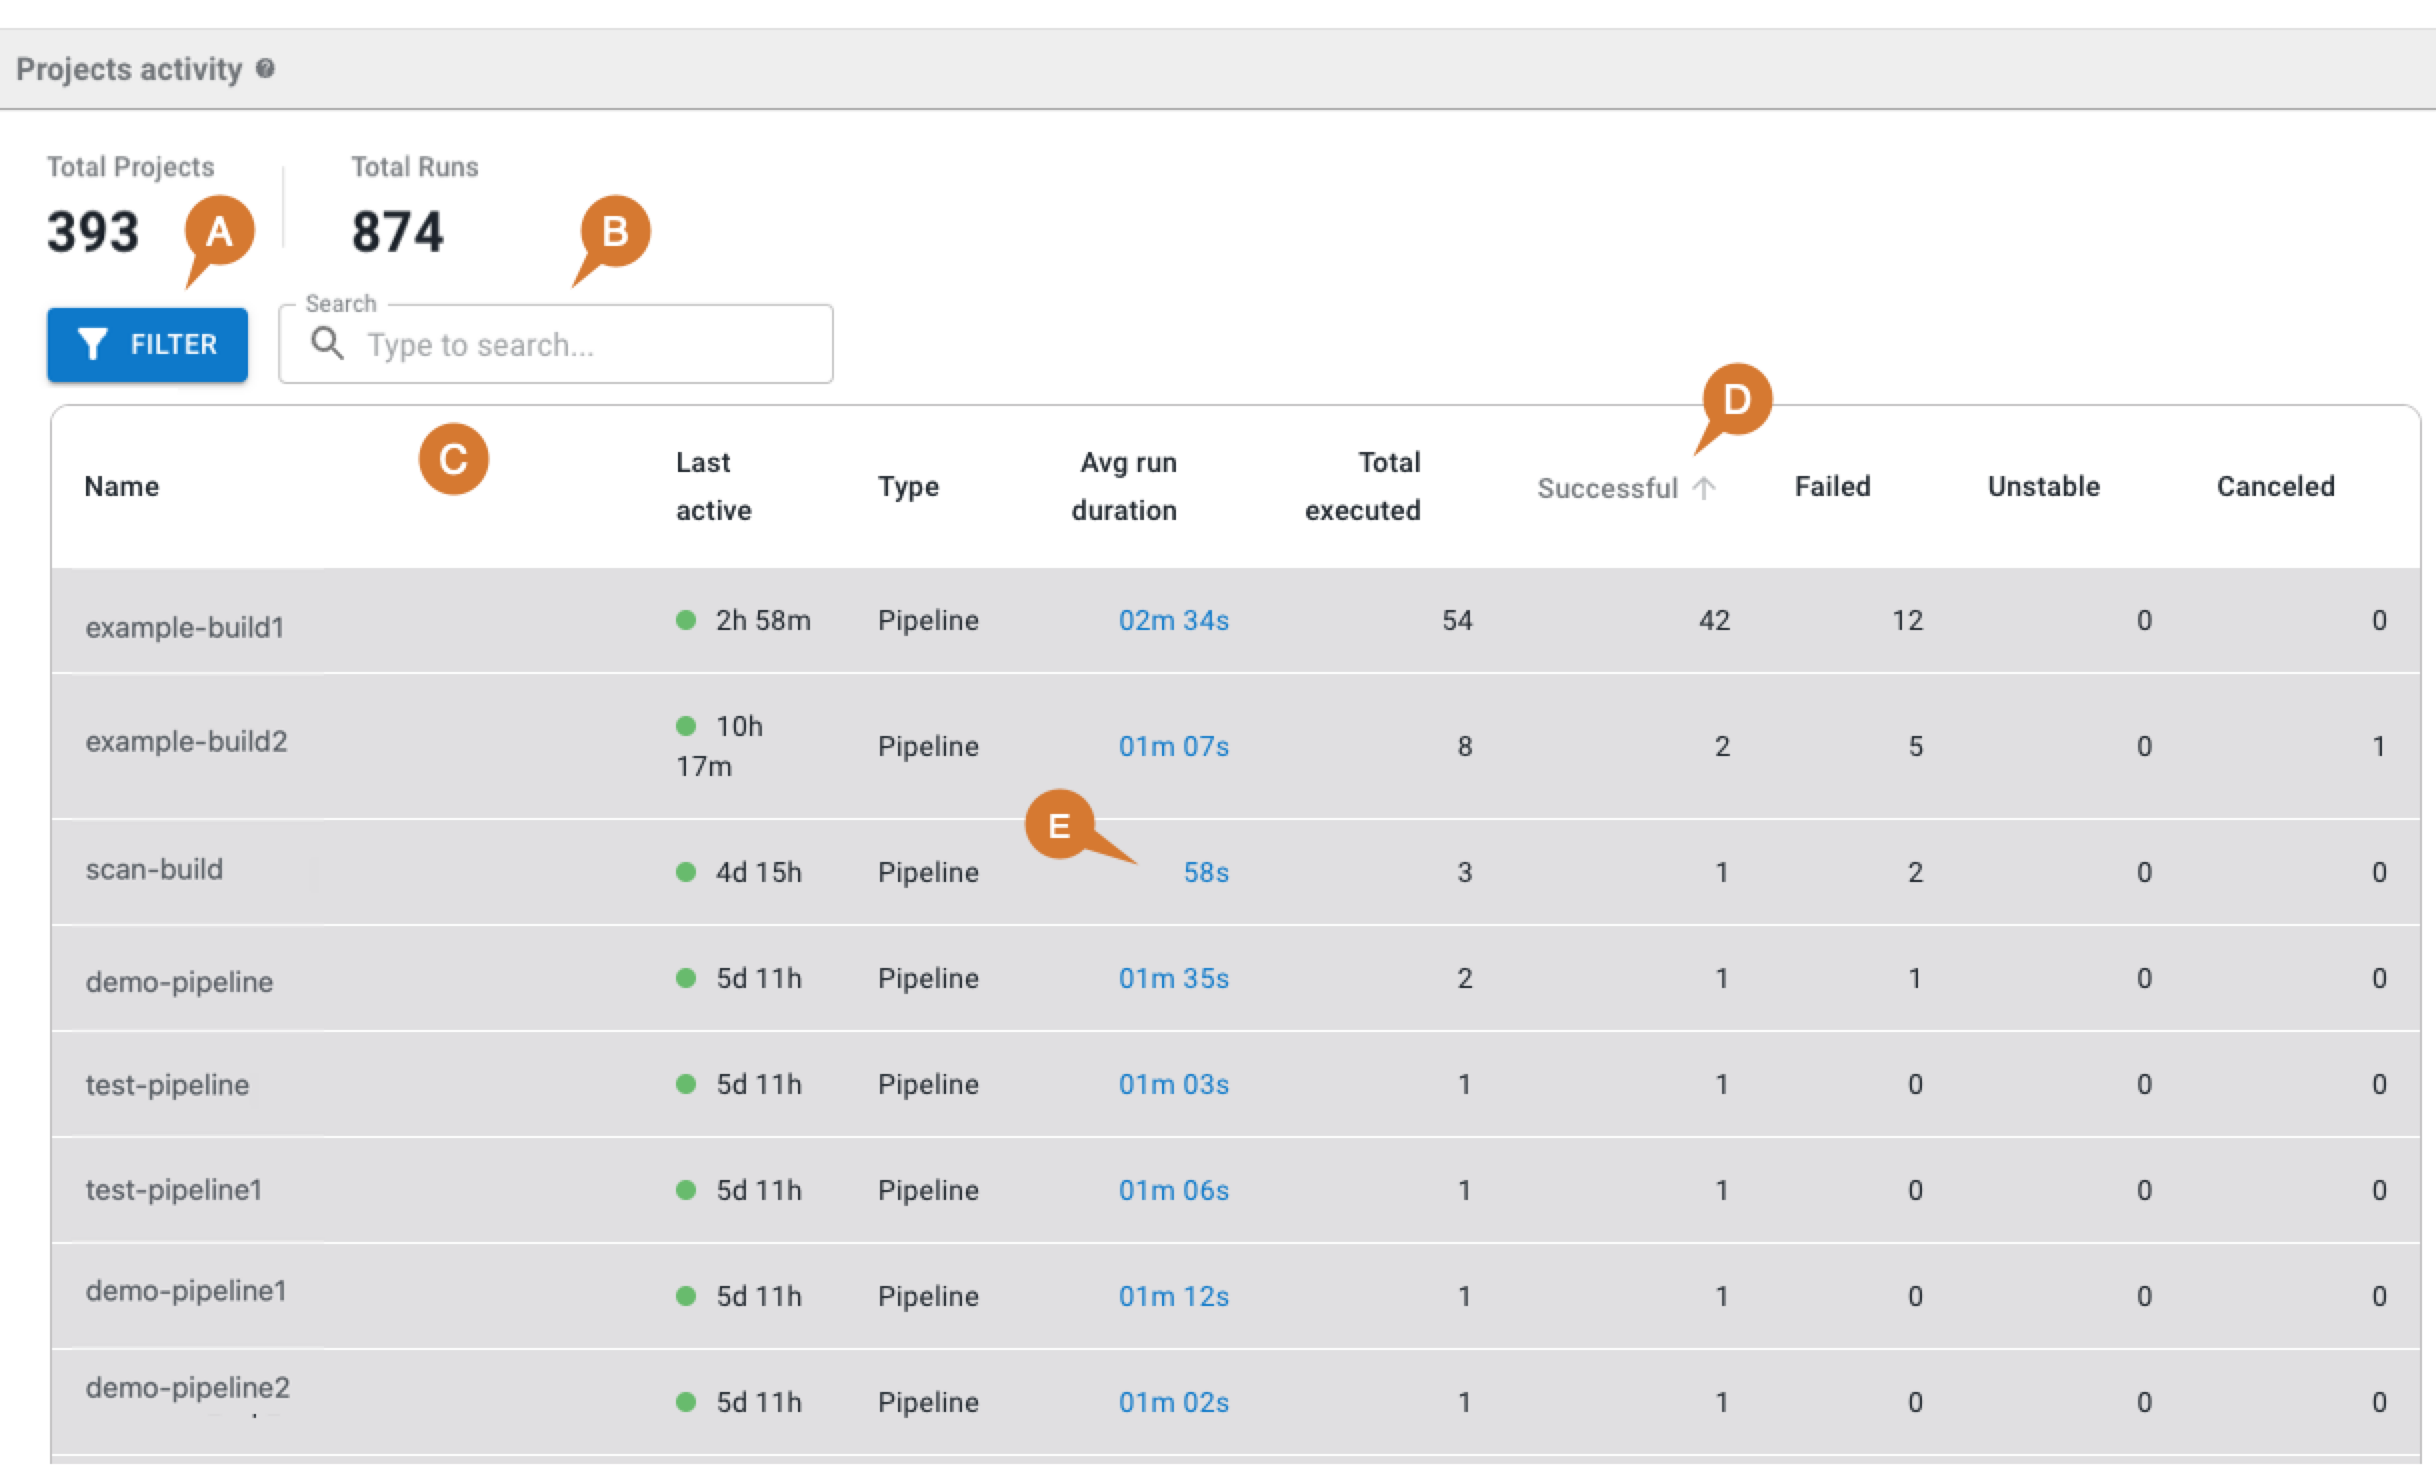
The following details and options are available:
-
Select Filter to display only Idle projects or Fragile projects.
-
Enter all or part of a project name in Search to display only matching project names.
-
Each row of the Projects activity table lists the following information for a given project:
-
Project Name.
-
When project was Last active, in days (d), hours (h), and minutes(m).
-
Project Type.
-
The average run duration (Avg run duration).
-
Total executed (runs).
-
Number of Successful runs.
-
Number of Failed runs.
-
Number of Unstable runs.
-
Number of Canceled runs.
-
-
Select a column heading to sort on that column.
-
Select Avg run duration to display a graph of the run information for that project.