The Security insights dashboard provides a comprehensive overview of your security scan results, enabling you to identify and resolve vulnerabilities. By ingesting data from workflows, scans, and project management systems, CloudBees platform offers detailed reports connected via a secure API. Use this dashboard to analyze components, track vulnerabilities by severity and scan type, monitor SLA compliance, and assess mean time to resolve (MTTR) vulnerabilities efficiently.
Details of the following are displayed:
-
Components, workflows, and workflow runs
-
Coding vulnerabilities
-
Workflows and runs by scan type
-
Vulnerabilities by scan type and severity
-
SLA status
-
Mean time to resolve (MTTR) vulnerabilities
-
CWE™ top 25 vulnerabilities present
|
If you are using CI Multibranch Pipelines:
|
|
Use the following features to access the data on this dashboard:
|
Access and filter security insights
Select components and the time frame of data for analysis in the security insights dashboard. By default, all components and the last seven days of data are displayed.
-
Select .
-
(Optional) Filter for the data you want to display by selecting the following:
-
Select FILTER.
-
Select one or more Components from the options.
-
Select a Duration from the following options:
Table 1. Duration filter definitions Duration Definition Current week
Current week in the month, Monday to Sunday schedule. For example, if current day is Tuesday, only data from Monday and Tuesday are displayed.
Previous week
Previous week in the month, Monday to Sunday schedule.
Two weeks back
Two weeks prior in the month, Monday to Sunday schedule.
Current month
First day of current month up to current day.
Previous month
First day to last day of previous month.
Two months back
First day to last day of two months prior.
Last 7 days
The past seven days.
Last 30 days
The past 30 days.
Last 90 days
The past 90 days.
Custom range
-
Select APPLY.
-
The data are filtered accordingly and displayed in the security insights dashboard.
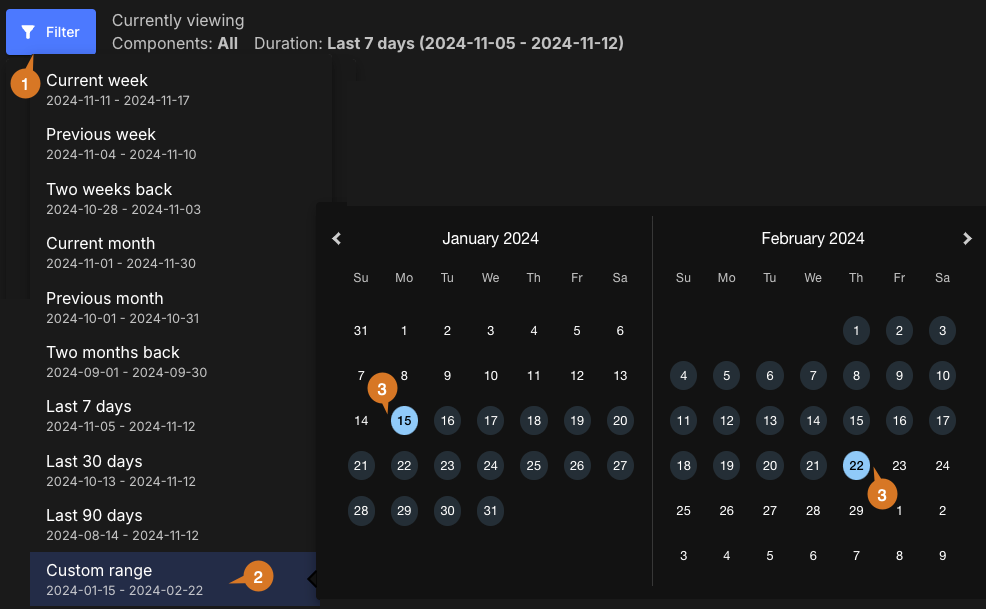
Set a custom date range
To set a custom date range:
-
Select FILTER.
-
Select Custom range.
-
Select dates for the time frame start and end.
The custom date range is set accordingly and displayed in blue on the date picker. You can view the analytics data for any desired time frame, as in the example below:
Customize the dashboard
Customize the dashboard to display only the charts and tables that matter the most to you.
|
Only charts and tables with |
To customize the dashboard:
-
Select Analytics on the left pane, and then select the dashboard.
-
Select
 on the top right of the dashboard.
 -
Select Edit dashboard.
-
(Optional) Remove a chart or table from the dashboard.
-
Select
 next to the chart or table you want to remove.
 -
Select Save.
-
-
(Optional) Add back a chart or table to the dashboard.
-
Select Add chart/table to display a list of the available charts or tables.
-
Select Add to dashboard next to the item to add.
-
Select Apply.
-
-
(Optional) Rearrange items on the dashboard by dragging them into place.
The dashboard is customized accordingly.
Components, workflows, and workflow runs information
Get an overview of components, workflows, and workflow runs for the filtered component data in a specified time frame.
As displayed below, the components, workflows, and workflow runs charts include total numbers and those with and without scanning:

Each chart displays the following details (highlighted in the Components chart):
-
Total number
-
A donut chart of percentages with and without scanners
-
Number with associated scanners
-
Number without associated scanners
| The Components chart also displays the number of associated repositories, and the Workflows chart displays the number of associated branches. |
Components chart links
Select a number in the components chart to list the following:
-
Component name
-
Repository URL
-
Status
-
Last activity date and time
| If you select a section of the donut chart, or the active or inactive numbers, the data displayed is for only that subset of components. |
In the list, perform any of the following:
-
Select FILTER to filter by scanner type.
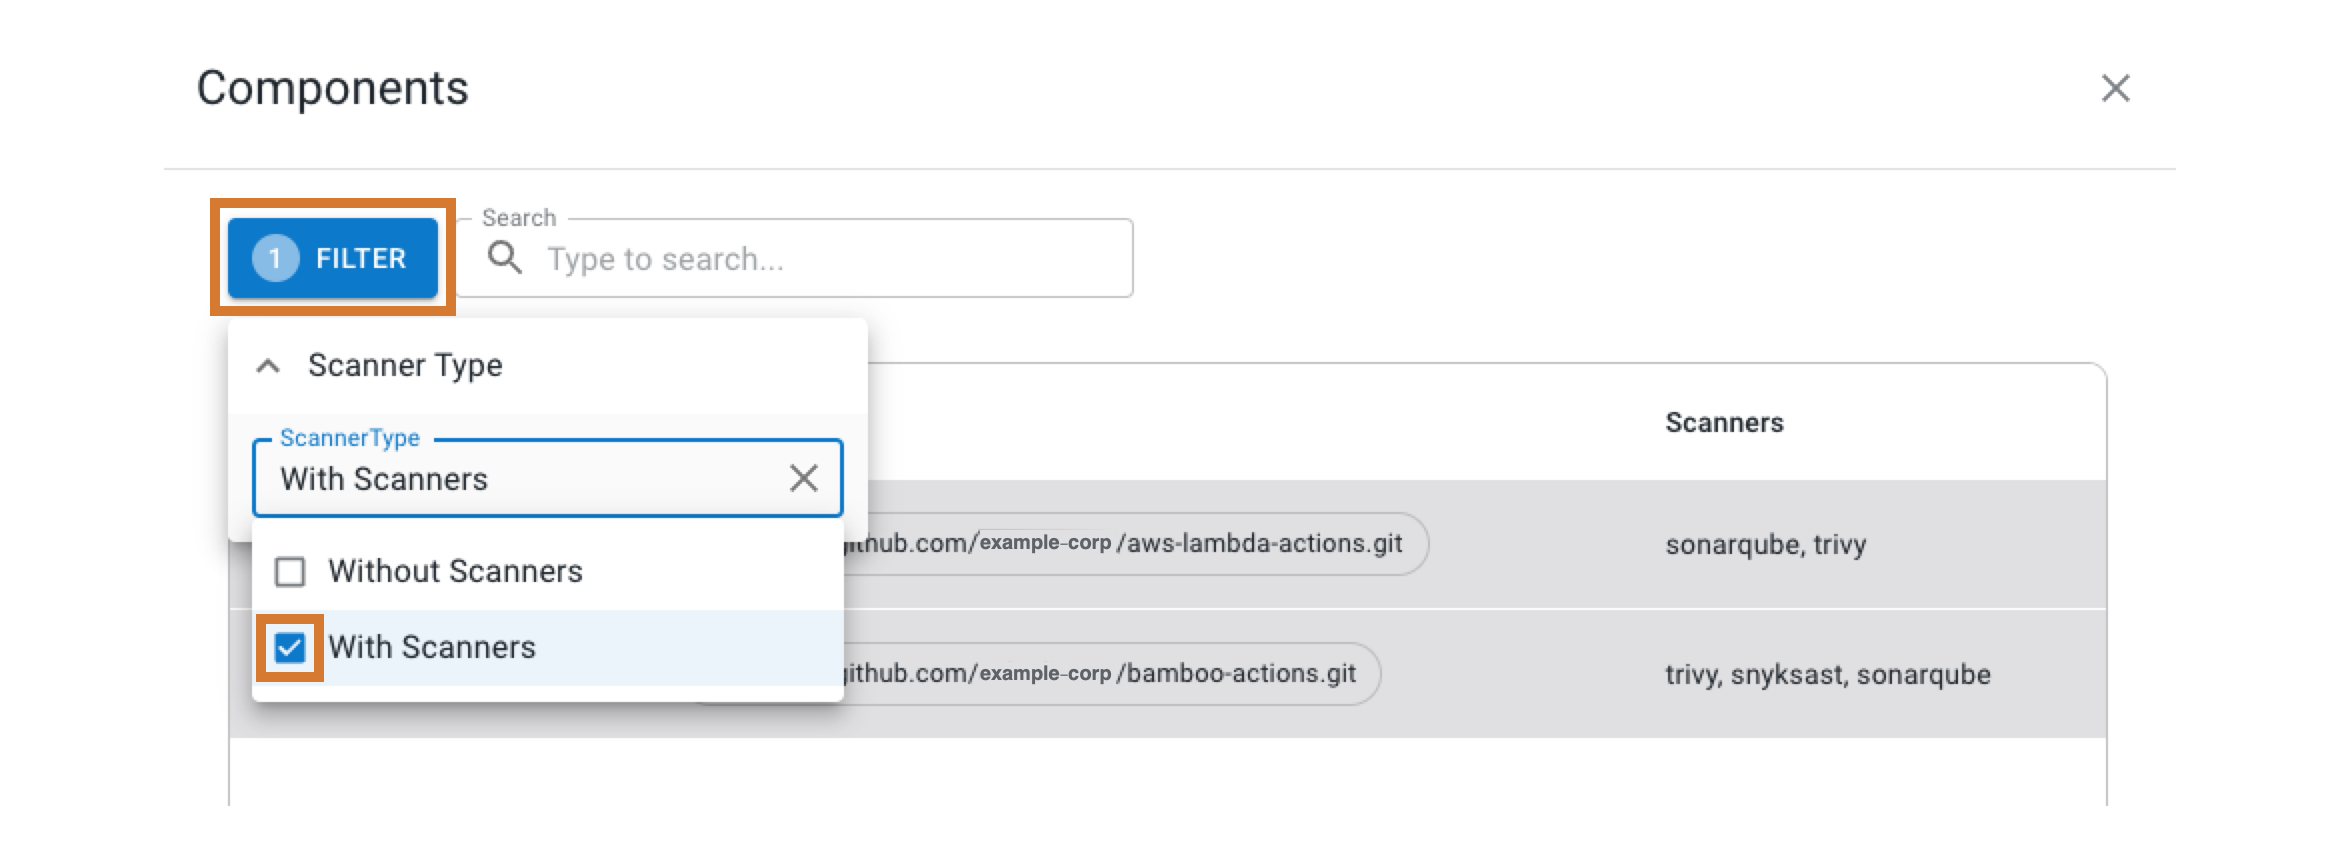 Figure 3. Filtering the component list with scanners only.
 -
Search for specific components by entering all or part of a component name into Search.
-
Select a component name to display runs from that component in a new browser tab.
Workflows chart links
Select a number in the workflows chart to list:
-
Workflow name
-
Component name
-
Branch name
-
Status
-
Last activity date and time
| If you select a section of the donut chart, or the numbers with or without scanners, the data displayed is for only that subset of workflows. |
In the list, perform any of the following:
-
Select FILTER to filter with scanners or without scanners.
-
Search for specific workflows by entering all or part of a workflow name, component name, or branch into Search.
-
Select a component name to display runs from that component in a new browser tab.
Workflow runs chart links
Select a number in the workflow runs chart to list:
-
Run ID
-
Workflow name
-
Component name
-
Branch name
-
Scanner name, if present, or No scanners alert
-
Scanning status
-
If you use scanners for workflow runs, the scan status displays as Scanned or Not scanned. Otherwise, the scan status displays as Not applicable.
-
If you select a section of the donut chart, or the numbers with or without scanners, the data displayed is for only that subset of workflow runs.
-
In the list, perform any of the following:
-
Select FILTER to filter with scanners or without scanners.
-
Search by entering all or part of a workflow name, component name, or branch into Search.
-
Select a run ID to display run detail in a new browser tab.
-
Select a component name to display runs from that component in a new browser tab.
Vulnerabilities overview
Get an overview of vulnerabilities for the filtered component data in a specified time frame. A unique code signature defines each vulnerability. In this way, you can track issues over time, and recurring issues are not treated as newly found.
CloudBees platform can detect fixed vulnerabilities. When a vulnerability is detected as fixed, the following occurs:
-
The status is updated to Resolved.
-
The timestamp of first discovery time is cleared.
-
The current scan time is taken to be the resolved time.
Vulnerabilities are divided into four different status groups.
| Status group | Vulnerability detected in: | |
|---|---|---|
Current scan |
Previous scan |
|
Found |
Yes |
No |
Reopened |
Yes |
Marked resolved |
Resolved |
No |
Yes (last known status open or reopened) |
Open |
Yes |
Yes |
As in the example below, the Vulnerabilities overview provides the number of vulnerabilities grouped by status:
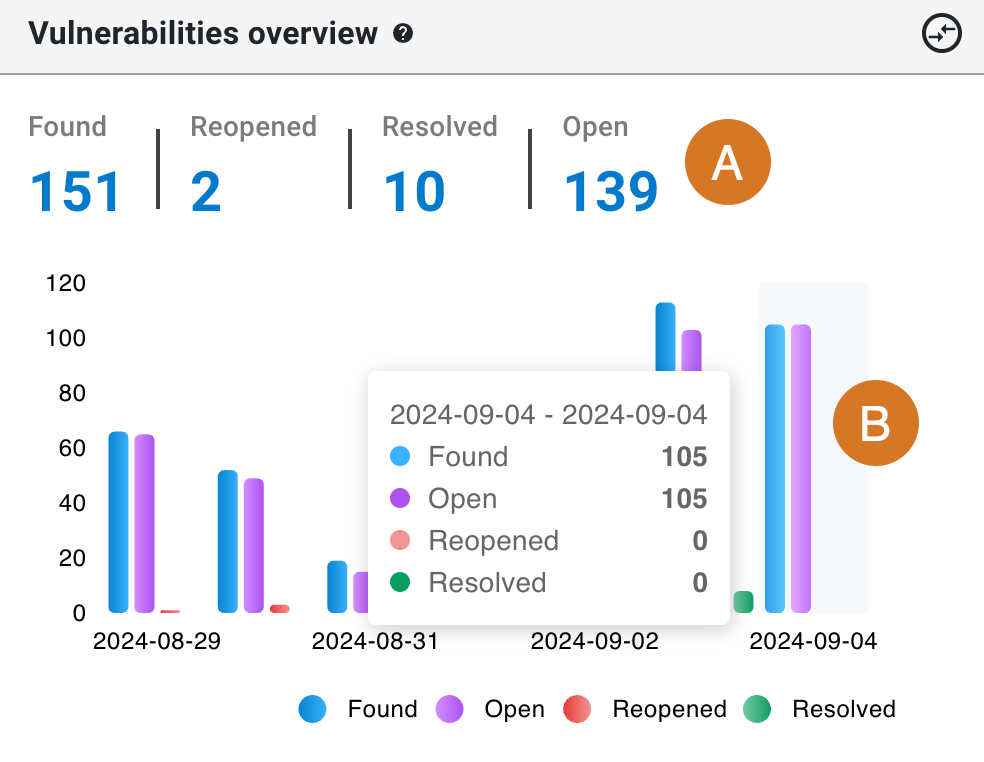
The overview includes the following:
Vulnerabilities details
The following details of vulnerabilities are listed:
-
Vulnerability ID
-
First discovered date and time
-
Vulnerability name
-
Status
-
Severity: Rated by the security tool as Low, Medium, High, or Very high.
-
Number of impacted components
In the list, perform any of the following:
-
Select FILTER to filter by status.
-
Search by entering all or part of one of the following into Search:
-
Vulnerability ID
-
Vulnerability name
-
First discovered date and time
-
Severity
-
-
Select the
 next to a vulnerability ID to display a table of the following for that vulnerability:
-
Last discovered date and time
-
Component name: select to display runs from that component in a new browser tab.
-
Branch name
-
Scanner name
-
Number of occurrences
-
SLA status
-
Vulnerability status
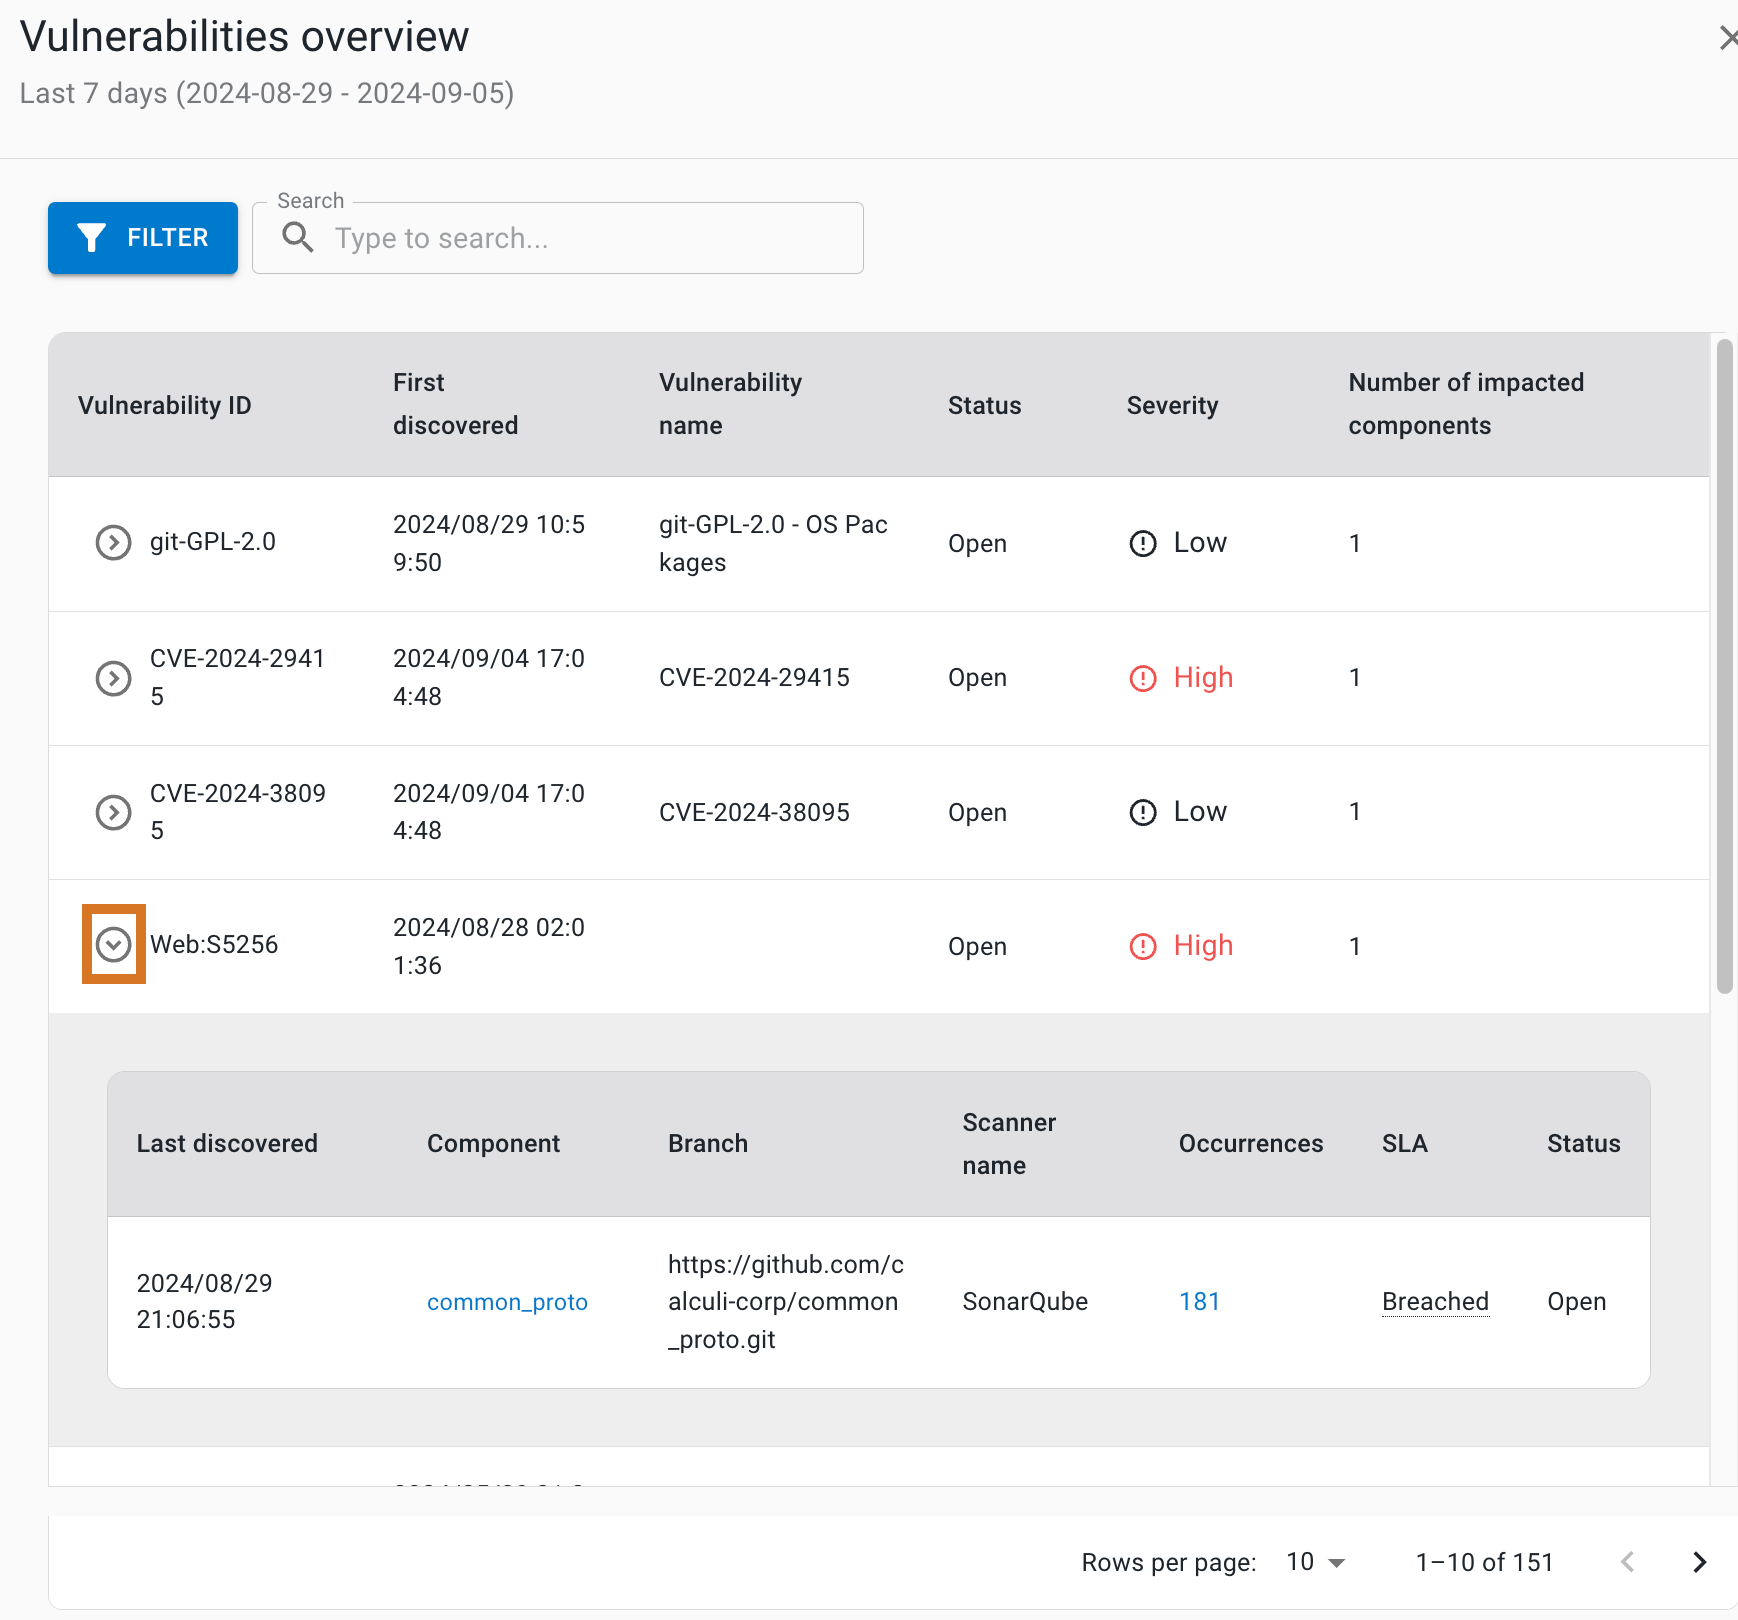 Figure 5. Vulnerabilities list with a highlighted icon to open the table.
-
Open and reopened vulnerabilities
The ages of open and reopened vulnerabilities for the filtered component data in a specified time frame are plotted on box and whisker plots, grouped by severity, and display the data distribution through their quartiles.
How to interpret the box plots:
-
The plot box for a given severity group represents the middle 50% of vulnerability ages.
-
The bisecting line of the box represents the median age.
-
The plot whiskers represent the minimum and maximum ages for that severity group.
An example vulnerability age distribution, grouped by severity:
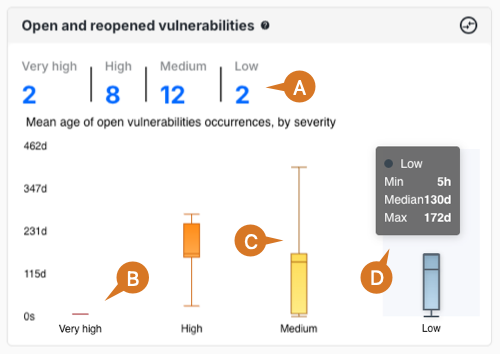
Open and reopened vulnerabilities includes the following:
-
Total Very high, High, Medium, and Low severities of vulnerabilities. Select a total to display details for just that severity group.
-
The Very high box plot has a small spread, indicating that the issues of this severity are resolved promptly.
-
The Medium box plot has a wide spread, indicating that issues of this severity sometimes have a delayed resolution.
-
Hover over a severity group to display the minimum, median, and maximum days open, or select it to display details for just the vulnerabilities at that severity level.
Open and reopened vulnerabilities details
In the details list, perform any of the following:
-
Select FILTER to filter by severity.
-
Search by entering all or part of one of the following into Search:
-
Vulnerability ID
-
First discovered date and time
-
Vulnerability name
-
Severity
-
-
Select the
 next to a vulnerability ID to display the following for that vulnerability:
-
Last discovered date and time
-
Component name: select to display runs from that component in a new browser tab.
-
Branch name
-
Scanner name
-
Number of occurrences
-
SLA status
-
Scan types in workflows
Get an overview of scan types in workflows for the filtered component data in a specified time frame.
The scan types are the following:
As in the example below, Scan types in workflows provides the number of workflows and runs grouped by scan type:
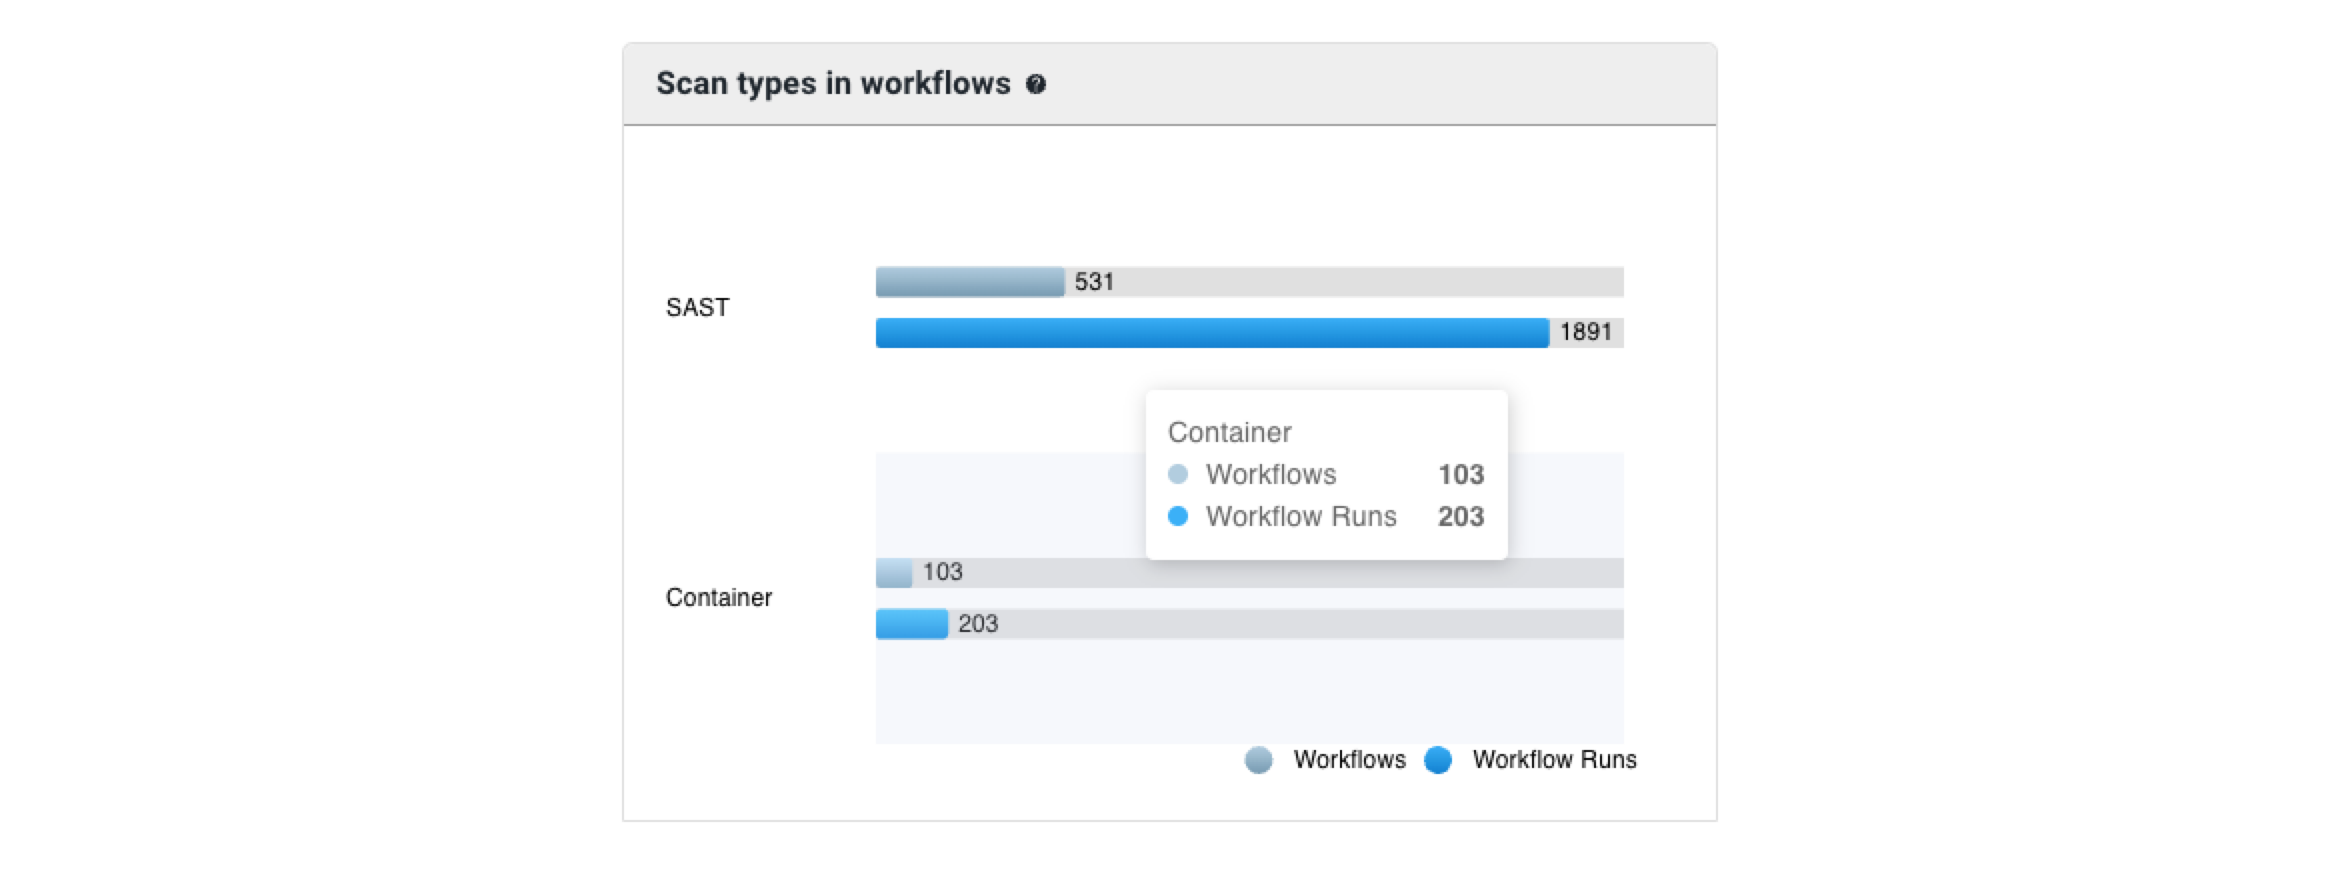
Perform any of the following:
-
Hover over a scan type to display the number of workflows and runs with that type.
-
Select either a workflow or a runs bar to display a list of scan details.
Scan details
The scan details list includes:
-
Build number
-
Workflow name
-
Component name
-
Branch name
-
Scan type: Container, DAST, SAST, or SCA.
-
Scanner name
Perform any of the following:
-
Select FILTER to filter by scan type.
-
Search by entering all or part of one of the following into Search:
-
Workflow name
-
Component name
-
Branch name
-
Scan type: Container, DAST, SAST, or SCA.
-
Scanner name
-
-
Select a Build # to display the run details in a new browser tab.
Vulnerabilities by security scan type
Get an overview of vulnerabilities grouped by scan type for the filtered component data in a specified time frame.
The example chart below displays the number of vulnerabilities, grouped by scan type:
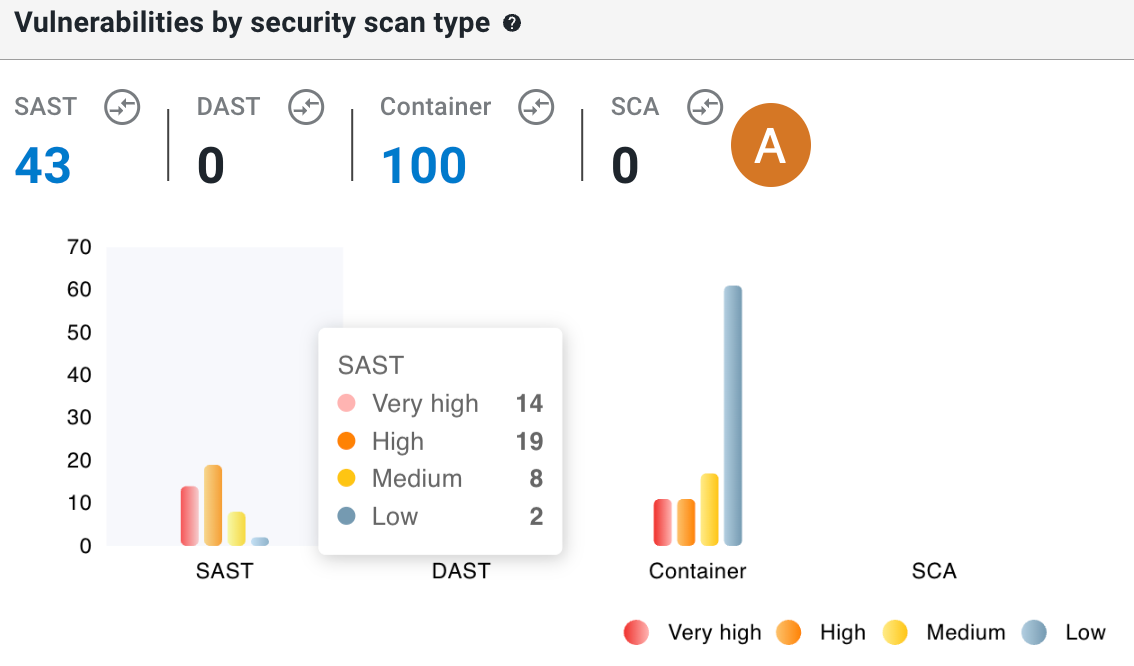
Perform the following with the Vulnerabilities by security scan type chart:
-
Total vulnerabilities with Container, DAST, SAST, or SCA scan types are displayed. Select a total to display a list of vulnerability details for just that scan type.
Vulnerability details by scan type
The list of vulnerability details displays the following:
-
Vulnerability ID
-
First discovered date and time
-
Vulnerability name
-
Severity: Rated by the security tool as Low, Medium, High, or Very high
-
Scan type
-
Number of impacted components
In the list, perform any of the following:
-
Select FILTER to filter by scan type and/or severity.
-
Search by entering all or part of any column item (except for Number of impacted components) into Search.
-
Select the
 next to a vulnerability ID to display the following for that vulnerability:
-
Last discovered date and time
-
Component name: select to display runs from that component in a new browser tab.
-
Branch name
-
Scanner name
-
Number of occurrences
-
SLA status
-
Vulnerability status
-
Hover to display the number of vulnerabilities in a given scan type, grouped by severity.
-
Select a bar on the graph to display vulnerability details for just that scan type and severity.
-
-
SLA status overview by occurrences
Get an overview of vulnerability occurrence and SLA status for the filtered component data in a specified time frame.
All open vulnerabilities are grouped by SLA status, defined as how long each has remained unresolved:
-
On track: Open less than two days.
-
At risk: Open more than two days but less than three days.
-
Breached: Open three days or more, which exceeds the allowed SLA resolution time.
All resolved vulnerabilities are grouped by SLA status, defined as how long each remained unresolved:
-
Within SLA: Resolved within three days.
-
Breached: Resolved after three days or more, which exceeds the allowed SLA resolution time.
As in the example below, the SLA status overview by occurrences chart provides the number of vulnerabilities grouped by their status and their SLA status:
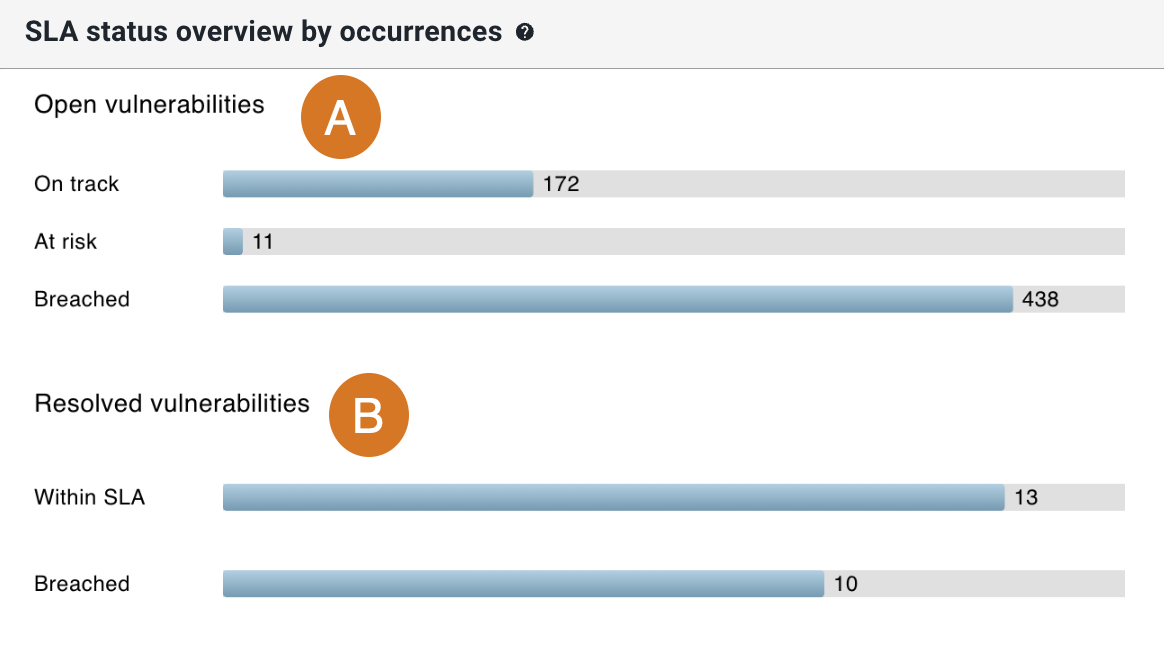
The overview includes the following:
-
Totals of Open vulnerabilities by SLA status.
-
Totals of Resolved vulnerabilities by SLA status.
Select a bar on the chart to display details for just that status group.
SLA status details
The list of SLA status details includes the following:
-
First discovered date and time
-
Vulnerability name
-
Component name
-
Severity: Rated by the security tool as Low, Medium, High, or Very high.
-
SLA status
-
Vulnerability status
In the list, perform any of the following:
-
Select FILTER to filter by SLA status.
-
Search by entering all or part of any column item into Search.
MTTR for vulnerabilities occurrences
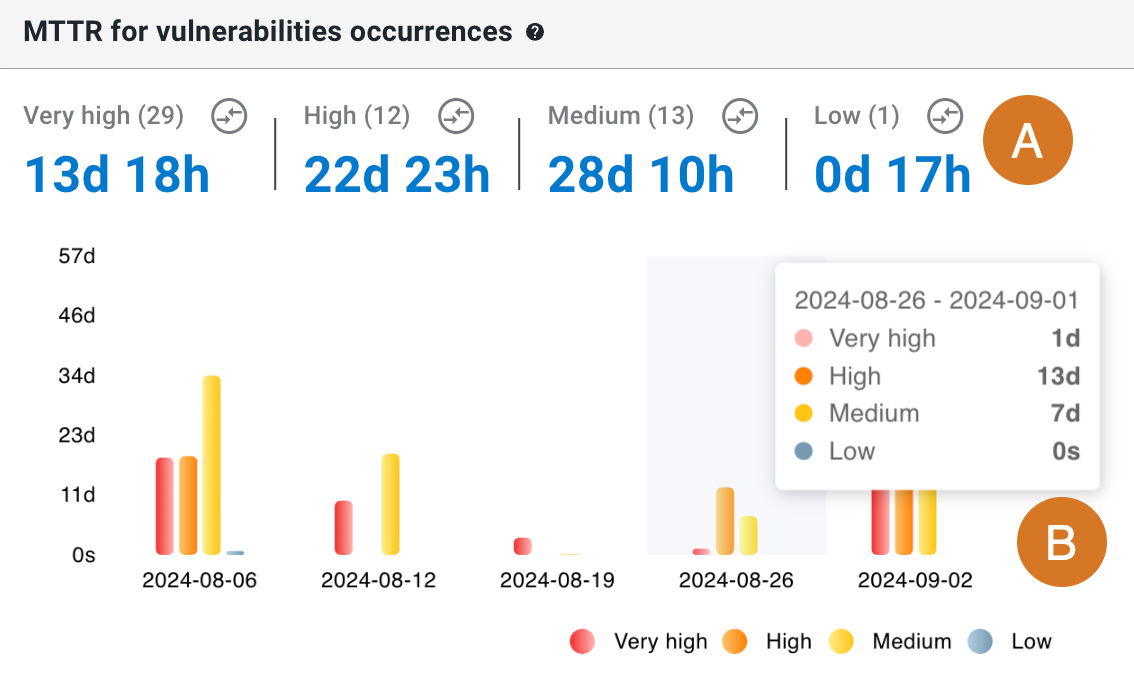
The mean time to resolve (MTTR) is a metric to track how long it takes to fix vulnerabilities. MTTR is calculated as the time in hours from the time of first discovery of a vulnerability to the time of the scan when it is marked Resolved. Get an understanding of the MTTR for vulnerabilities (grouped by severity) for the filtered component data in a specified time frame.
|
All vulnerabilities included in the MTTR data:
|
The example chart below displays the MTTR of vulnerabilities, grouped by severity:
Perform the following with the MTTR for vulnerabilities occurrences chart:
-
MTTs are grouped by severity, as rated by the security tool: Very high, High, Medium, or Low. Select an MTTR to display its details.
-
Hover over a date to display the MTTR by severity. Select a bar on the chart to display the details list for that date and severity.
MTTR for vulnerabilities details
The details list includes the following:
-
Vulnerability ID
-
First discovered date and time
-
Average resolution time
-
Severity
-
Resolved areas
Perform the following in the details list:
-
Select FILTER to filter by severity.
-
Search by entering all or part of any column item (except for Resolved areas) into Search.
-
Select the
 next to a vulnerability ID to display the following for that vulnerability:
-
Last discovered date and time
-
Component name: select to display runs from that component in a new browser tab.
-
Branch name
-
Scanner name
-
Resolution time
-
SLA status
-
CWE™ Top 25 vulnerabilities
The Common Weakness Enumeration (CWE™) Top 25 is a community-developed list of common software weaknesses. Get an understanding of components impacted by any of the CWE Top 25 vulnerabilities for the filtered component data in a specified time frame.
The CWE Top 25 chart displays the following:
-
CWE ID
-
Vulnerability name
-
Number of impacted components
Select a component number to display CWE Top 25 occurrences details.
CWE™ Top 25 occurrences details
-
Vulnerability ID
-
First discovered date and time
-
Vulnerability name
-
Severity
-
Number of impacted components
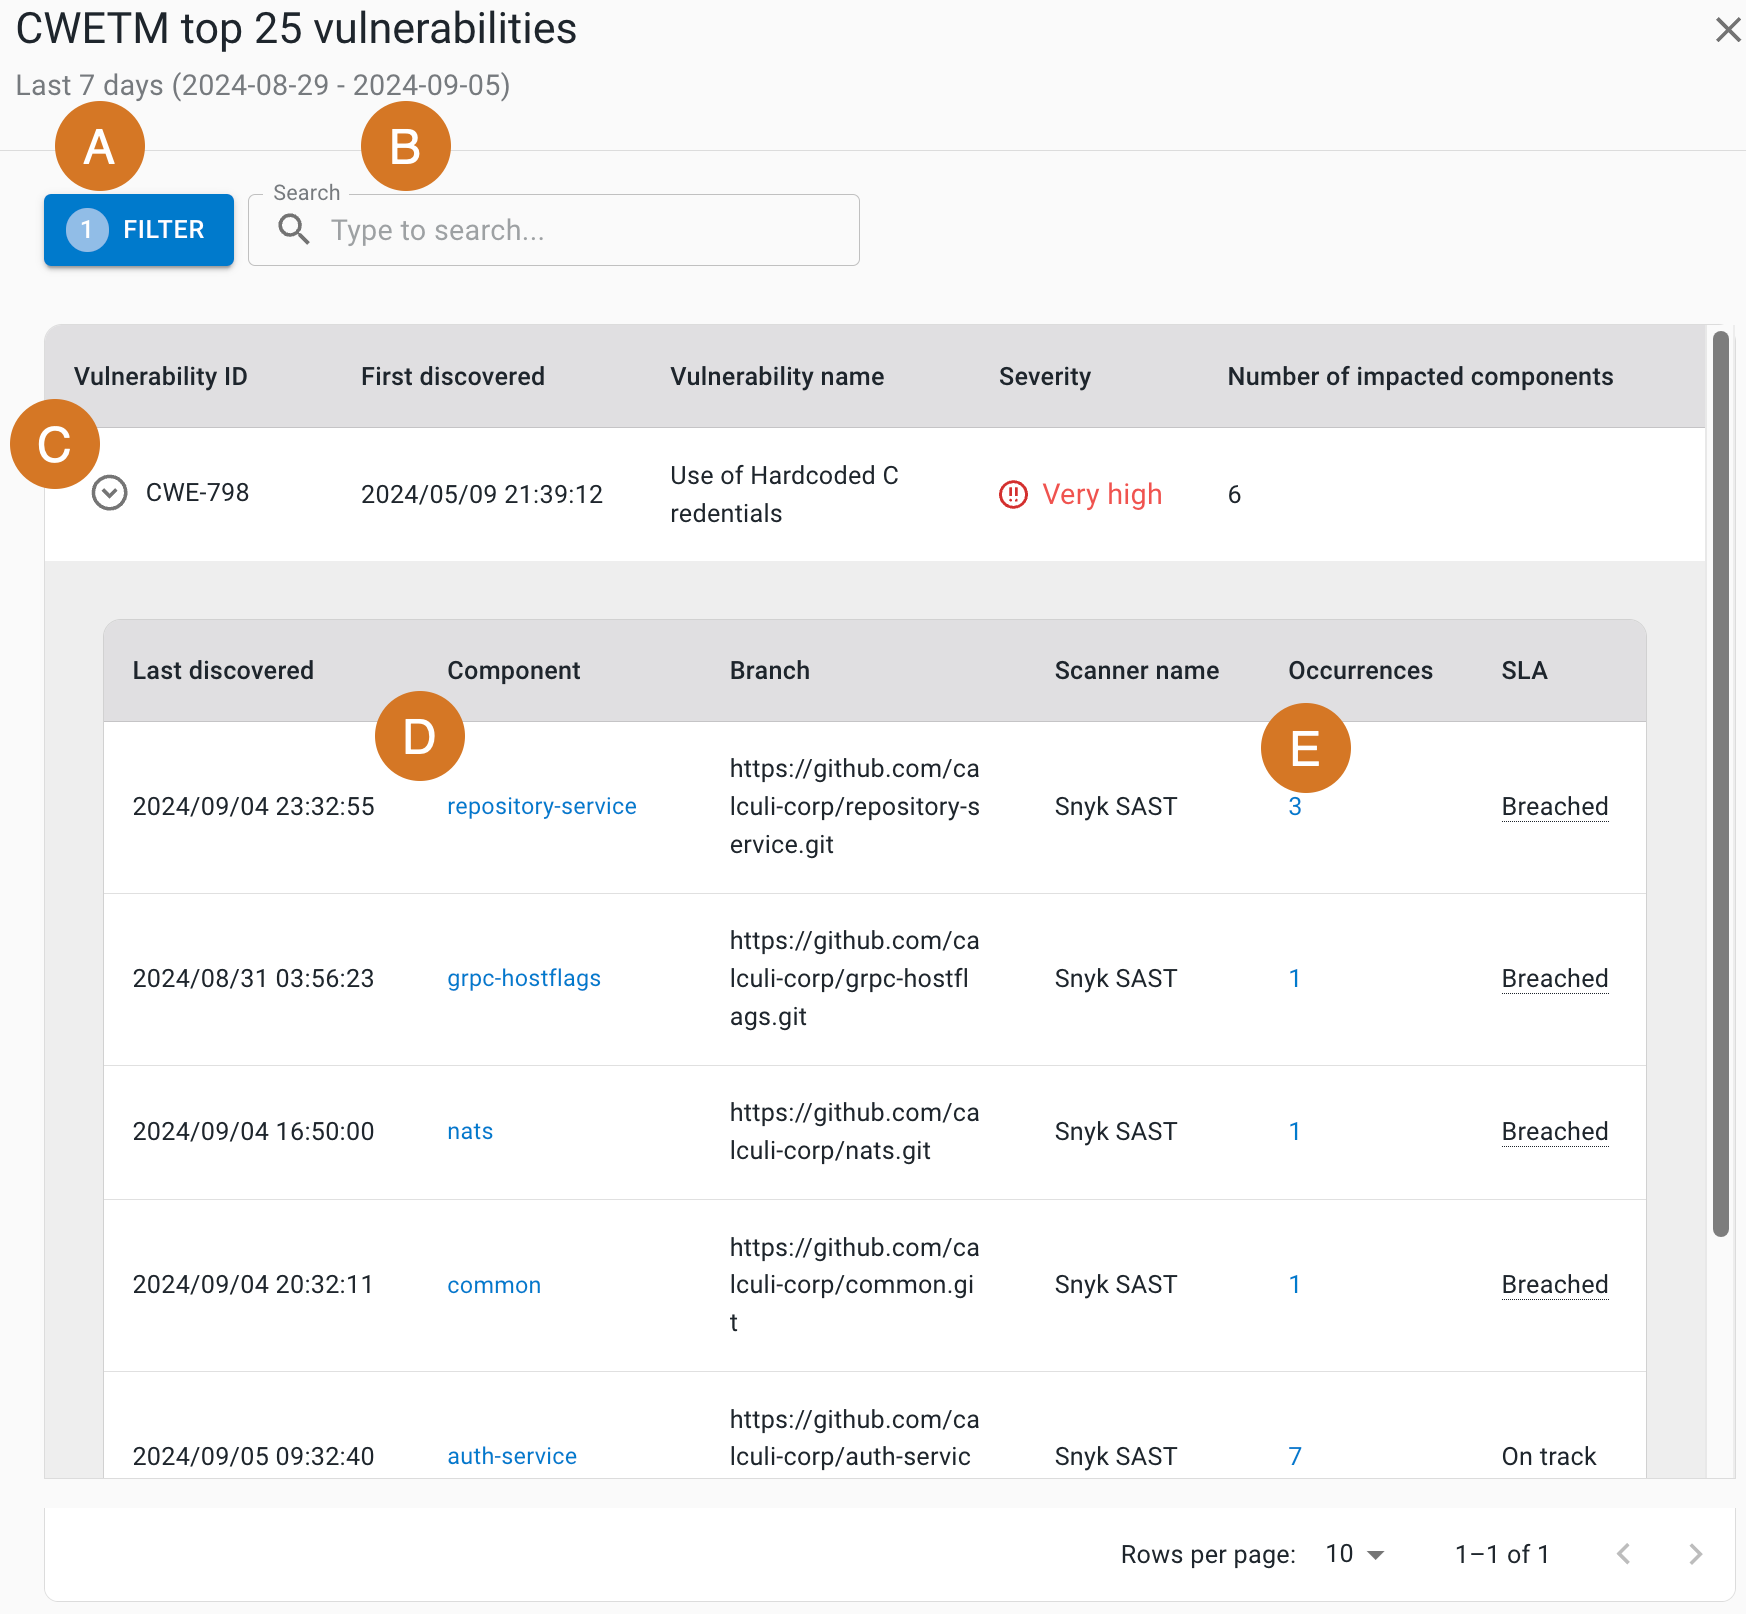
As in the CWE Top 25 details example above, perform the following:
-
Select FILTER to filter by vulnerability ID.
-
Search by entering all or part of any column item (except for Number of impacted components) into Search.
-
Select the
 next to a vulnerability ID to display:
-
Last discovered date and time
-
Component name
-
Branch name
-
Scanner name
-
Number of occurrences
-
SLA status
-
-
Select a component name to display runs from that component in a new browser tab.
-
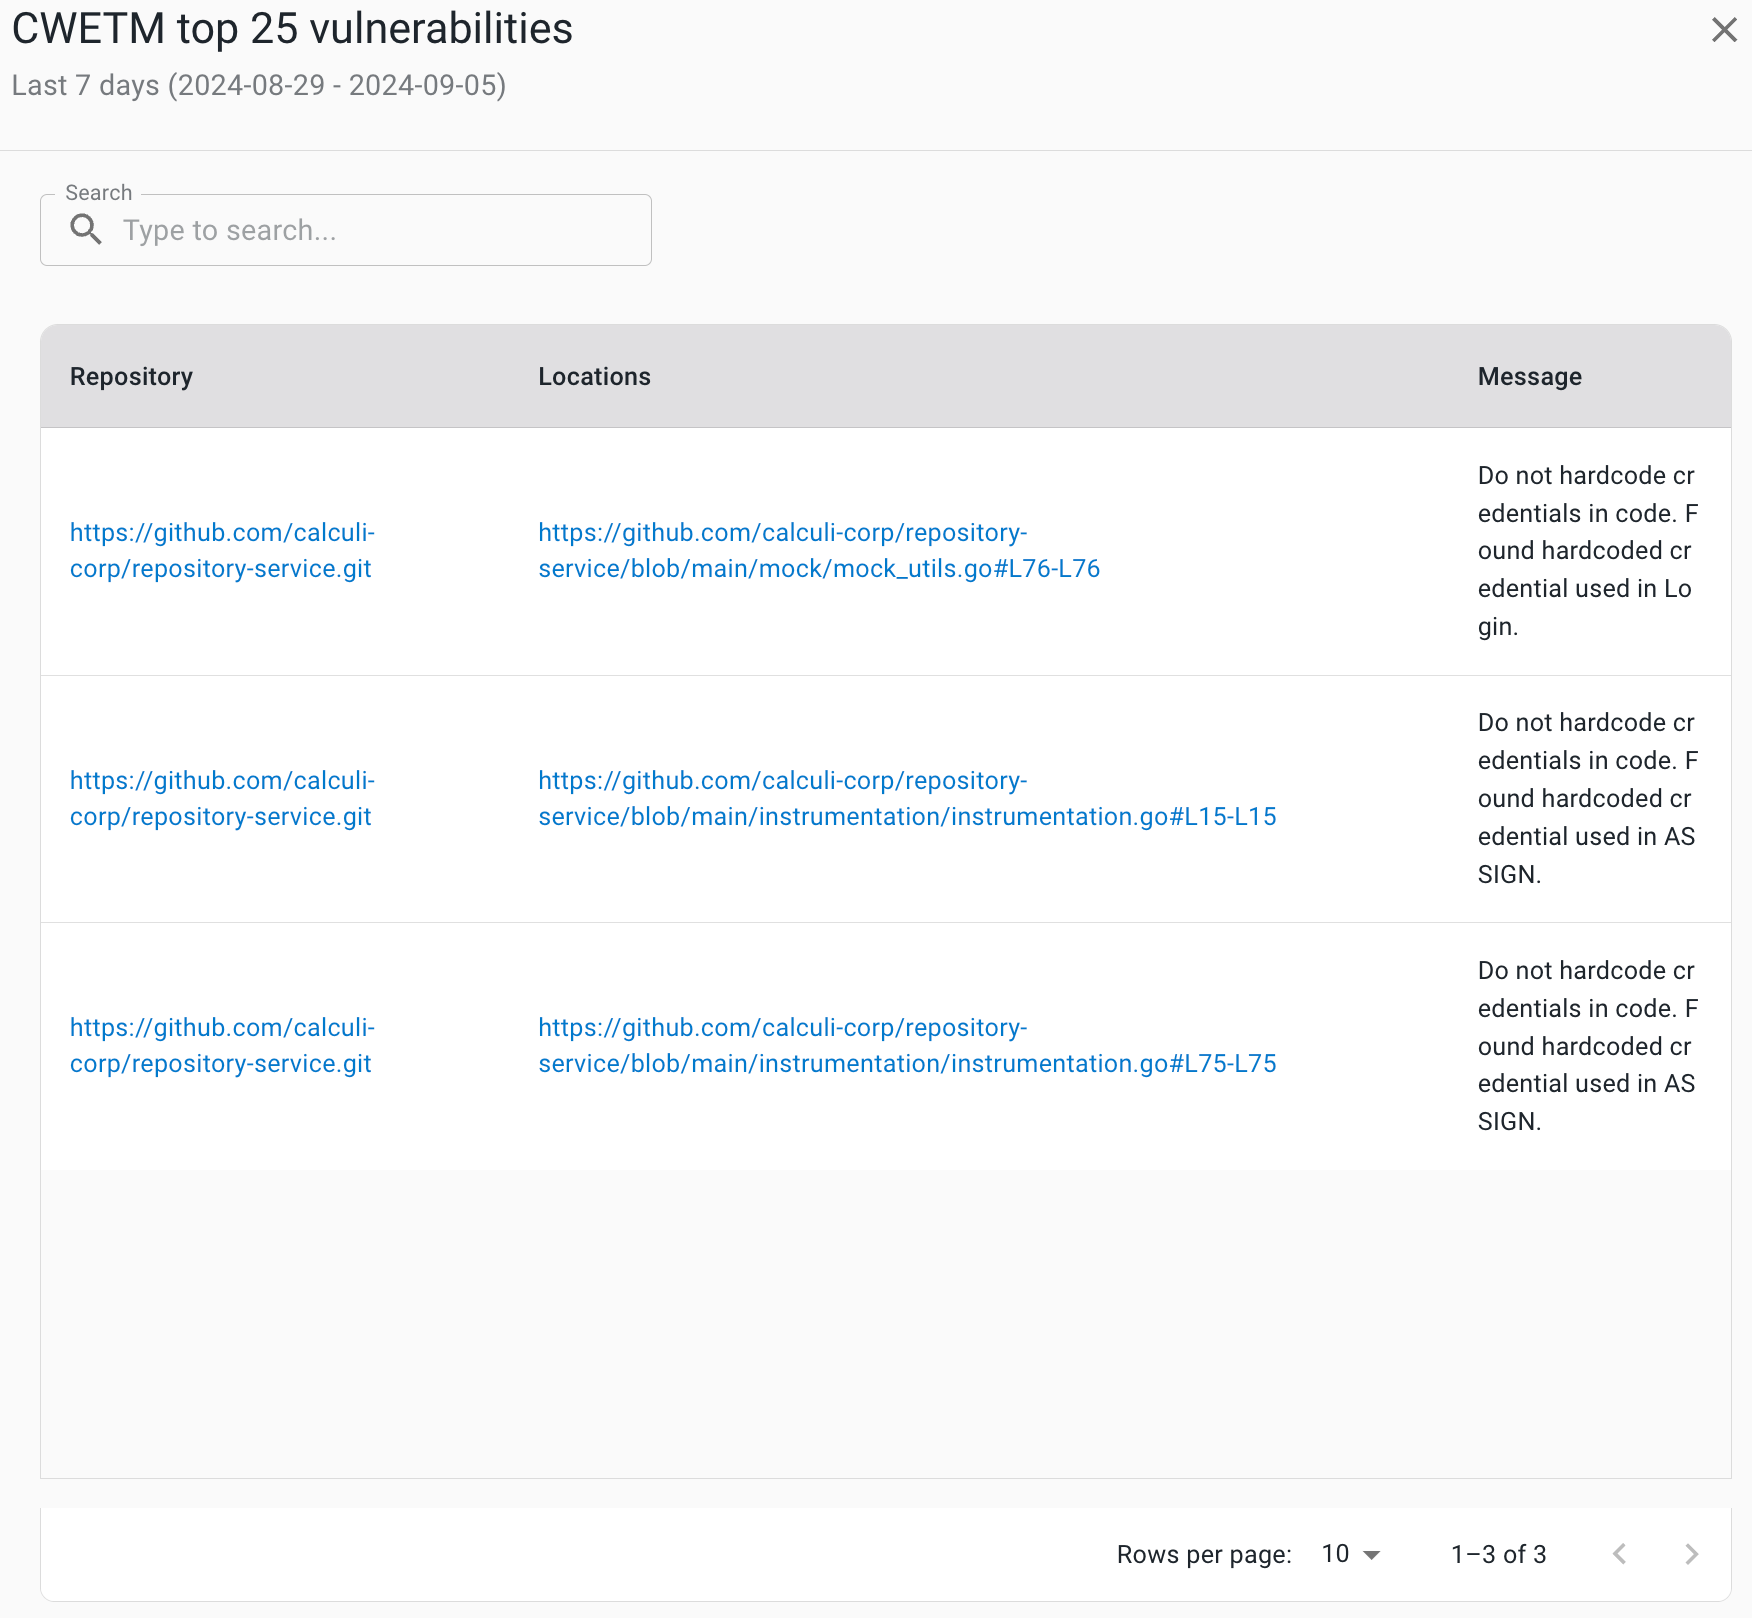
Select an occurrence number to display the following:
-
Repository URL: select to go to the URL.
-
Locations (file name and line numbers)
-
Message
-
Compare metrics
Use this feature to compare metrics among all organizations and sub-organizations in the tenant. You can compare metrics within select charts in the analytics dashboards. In the generated list of all organizations/sub-organizations, sort by the org/sub-organization name or its status. Select an organization to drill down to the component level to display a more fine-grained status list. Hover over a status item to display more information.
|
You can only compare metrics for charts with |
To compare metrics:
-
Select Analytics on the left pane, and then select a dashboard.
-
Select any
 on the upper right of a chart to display the list of organizations/sub-organizations and their status.
The number of items in the compare metrics list equals the total displayed in the chart. -
(Optional) Hover over a status to display more information.
-
(Optional) Select
 or
or  next to a column heading to sort on that heading.
 -
(Optional) Select an organization to list more information about each sub-organization and/or component within that organization.
-
(Optional) Select a sub-organization to list more details about each sub-organization and/or component within that sub-organization.
The list of the status of all organizations/sub-organizations/components for the specific metric is displayed.