The summary provides a snapshot of all the run activity for a component, including the following:
| Not all charts may display data, depending on the type of workflows run. For example, to populate the Build chart, a build step must be executed in at least one run. |
Access and filter the summary
Filter the summary by the repository branch and a specific time frame.
To access and filter the summary:
-
Select a component, and then select Summary.
-
Filter for the data you want to display by selecting the following:
-
Select FILTER.
-
Select a Branch/PR from the options.
-
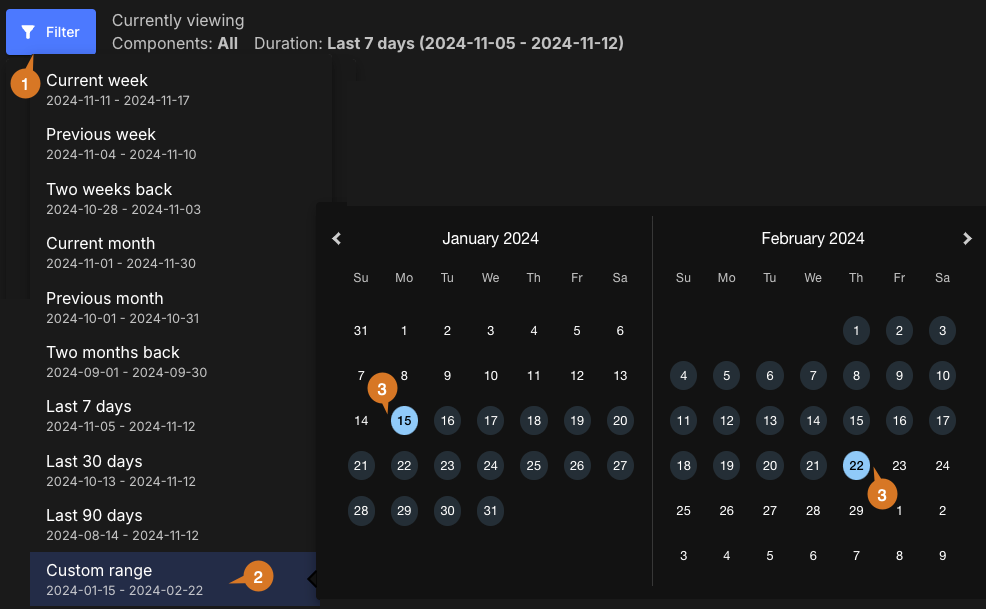
Select a Duration from the following options:
Table 1. Duration filter definitions Duration Definition Current week
Current week in the month, Monday to Sunday schedule. For example, if current day is Tuesday, only data from Monday and Tuesday are displayed.
Previous week
Previous week in the month, Monday to Sunday schedule.
Two weeks back
Two weeks prior in the month, Monday to Sunday schedule.
Current month
First day of current month up to current day.
Previous month
First day to last day of previous month.
Two months back
First day to last day of two months prior.
Last 7 days
The past seven days.
Last 30 days
The past 30 days.
Last 90 days
The past 90 days.
Custom range
-
Select APPLY.
-
The data are filtered accordingly and displayed in the components summary dashboard.
Set a custom date range
To set a custom date range:
-
Select FILTER.
-
Select Custom range.
-
Select dates for the time frame start and end.
The custom date range is set accordingly and displayed in blue on the date picker. You can view the analytics data for any desired time frame, as in the example below:

Activity
An example Activity chart filtered by branch and time frame is displayed below:

The chart includes the following:
-
Numbers of total, active, and inactive workflows. Select the Total workflows number to list workflow details, including:
-
Workflow name
-
Branch name
-
Status
-
Last active date and time (UTC)
In the list, perform any of the following:
-
Select FILTER to filter by status.
-
Search for specific workflows by entering all or part of any column item into Search.
-
-
-
Numbers of total PRs and direct commits, number of commits per active developer, and number of active developers. Select the Total PRs and direct commits number to list commit details, including:
-
Commit ID
-
Repository URL
-
Branch name
-
Author
-
Commit date and time (UTC)
In the list, perform any of the following:
-
Select FILTER to filter by branch.
-
Search for specific commits by entering all or part of any column item into Search.
-
-
-
Numbers of total, successful, and failed workflow runs. Select the Total workflow runs number to list run details, including:
-
Workflow name
-
Branch name
-
Run ID
-
Status
-
Run start date and time (UTC)
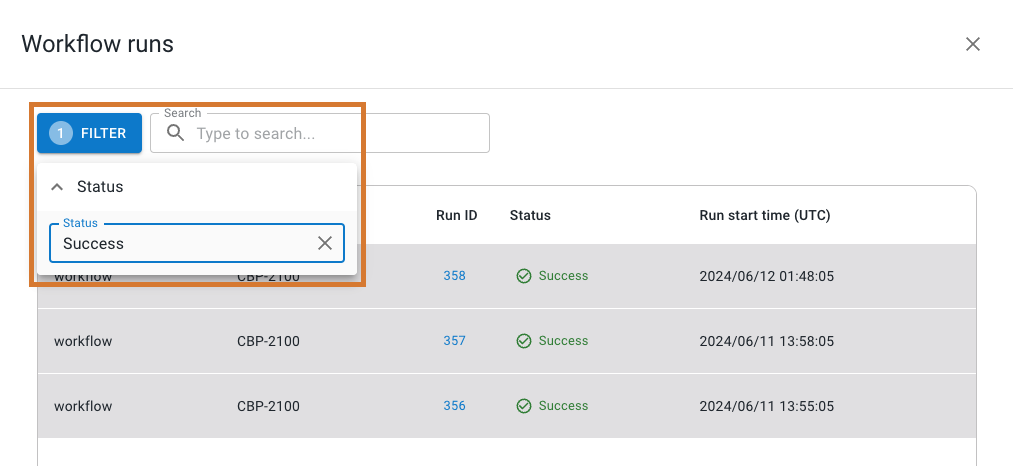
In the list, perform any of the following:
-
Select FILTER to filter by status.
 Figure 3. List of run details with filter set on Success status.
 -
Search for specific commits by entering all or part of any column item into Search.
-
Select a Run ID to display the run details in a new browser tab.
-
-
Builds and deployments
The builds and deployments summaries provide status data for the chosen branch and time frame.
Example Builds and Deployments charts are displayed below:

Each chart displays the following (highlighted in the deployments chart):
-
Total number
-
Number of successes and failures
| Hover over a stacked bar in the chart to display the number of successes and failures for that time point. |
Builds chart details
Select a linked number in Builds to display:
-
Run ID
-
Status
-
Start time
-
Duration
-
Workflow name
In the list, perform any of the following:
-
Select FILTER to filter by status.
-
Search for specific builds by entering all or part of any column item into Search.
-
Select a Run ID to display the run details in a new browser tab.
-
Deployments chart details
Select a linked number in Deployments to display:
-
Run ID
-
Start time
-
Duration
-
Status
-
Workflow name
-
Environment
In the list, perform any of the following:
-
Select FILTER to filter by status.
-
Search for specific deployments by entering all or part of any column item into Search.
-
Select a Run ID to display the run details in a new browser tab.
-
Security summary
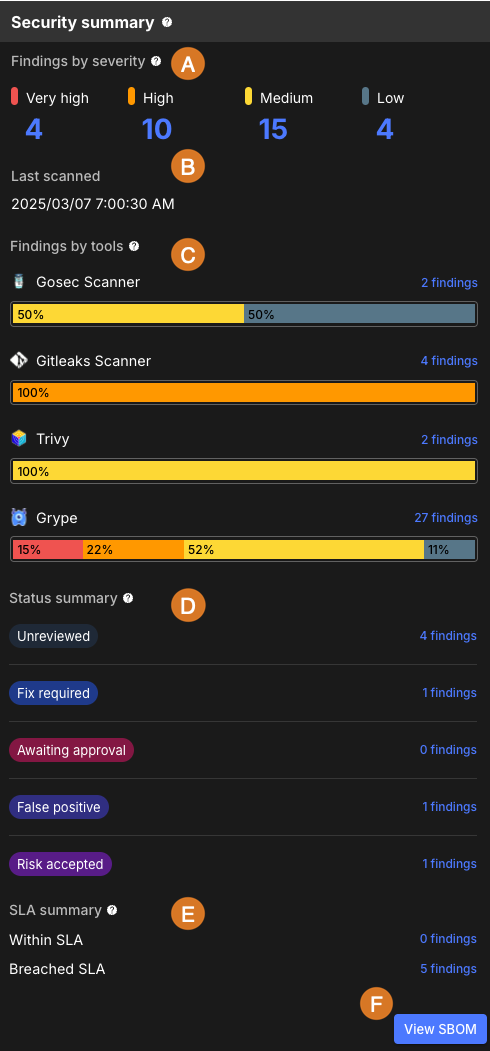
The security summary provides real-time security information for the chosen branch. It gives an at-a-glance view of the security posture when the component was scanned, the tools involved in the scan, and the severity distribution of open security findings.
Findings on the CloudBees Unify are individual occurrences of a security issue reported in a branch, file, or code location.

-
Review the number of findings, grouped by severity. Severity is the rating reported by the security tool that discovered the finding.
Select a number of findings to navigate to the Component security center, with issues filtered by that severity. The following severity ratings are assigned by the security tool when they are discovered:
-
Very high
-
High
-
Medium
-
Low
-
-
Review the date and time that the component was last scanned.
-
Review the number and proportion of findings, grouped by the security tool that found them.
Select the number of findings to navigate to the security center, with issues filtered by that tool.
Hover over the bar to display the percentage of findings of each severity. Select a section of the bar to navigate to the Component security center, with issues filtered by that tool and severity. The proportion of findings of each severity is indicated by the color of the bar, with severities represented by the following colors:
-
Very high: Red.
-
High: Orange.
-
Medium: Yellow.
-
Low: Gray.
-
-
Review the number of findings grouped by triage status. Select the number of findings to navigate to the Component security center with the triage status filter applied. The following triage statuses, which can be changed from the security center by an admin, reflect where a finding is in the triage process:
-
Unreviewed: The default status assigned to a finding when it is first discovered by a security scan.
-
Fix required: A security finding that needs to be fixed.
-
Awaiting approval: A Risk accepted or False positive finding that requires approval from an organization owner.
-
False positive: A finding that is not actually a security risk, or is not actionable.
-
Risk accepted: A finding that falls within your risk tolerance.
-
-
Review the number of findings that are within, or have breached, your SLA. Select the number of findings to navigate to the Component security center with the SLA status filter applied.
-
Select View SBOM to review a summary of the component’s software bill of materials. Then select Export to download the complete SBOM as a .CSV file, or in CycloneDX format.
You must enable SBOM analysis for an SBOM to be created. For further information, refer to SBOM analysis.
SonarQube scanner charts
CloudBees Unify SonaQube scanner charts provide detailed insights about code coverage, issue types, and duplicated code for the chosen code branch and time frame of components scanned by SonarQube.
SonarQube code coverage summary
The SonarQube code coverage summary chart compares the current scan to the previous scan in a bar chart, as in the example below:

The summary lists the following metrics for the current scan:
-
Percent total code coverage.
-
Total number of lines.
-
Total number of lines of code.
-
Number of lines of code covered.
-
Number of lines of code still to cover.
SonarQube issue types chart
The SonarQube issue types chart gives you an overview of issue types detected in the previous scan compared to the current scan. The number of each issue type found in the current scan is listed above the bar chart.
The issue types and their legend color are as follows:
-
Code smell:

-
Bug:

-
Vulnerability:

-
Security hotspot:


| Hover over either of the Current scan or Previous scan groups in the chart to display a tabular view of data for that group. |
SonarQube duplicated code metrics
The SonarQube duplicated code metrics chart provides detailed metrics on duplicated code, as in the example below:

The summary lists the following for the current scan:
-
Percentage density of duplicated lines of code.
-
Number of files with duplication.
-
Number of duplicate code blocks.
-
Number of total lines of code.
-
Number of duplicate lines of code.
SonarQube code quality metrics
The CloudBees Unify SonarQube code quality table provides file-level code coverage and complexity metrics for the chosen code branch and time frame, of components scanned by SonarQube.
The following metrics are displayed:
-
File name
-
Total lines of code
-
Code coverage
-
Covered lines of code
-
Lines of code still to cover
-
Cyclomatic complexity
-
Cognitive complexity
Open issues from all scanners
Get an overview of open issues from all scanners for the chosen code branch and time frame.
The overview lists the following vulnerability information:
-
A summary at the top of total issues and severity.
-
Date and time first discovered.
-
Vulnerability ID.
-
Scanner name.
-
Issue type.
-
Severity.
-
Number of occurrences.
-
SLA status.
Perform any of the following:
-
Select FILTER to filter by vulnerability ID and/or severity.
-
Search by entering all or part of any column item (except for Occurrences) into Search.
-
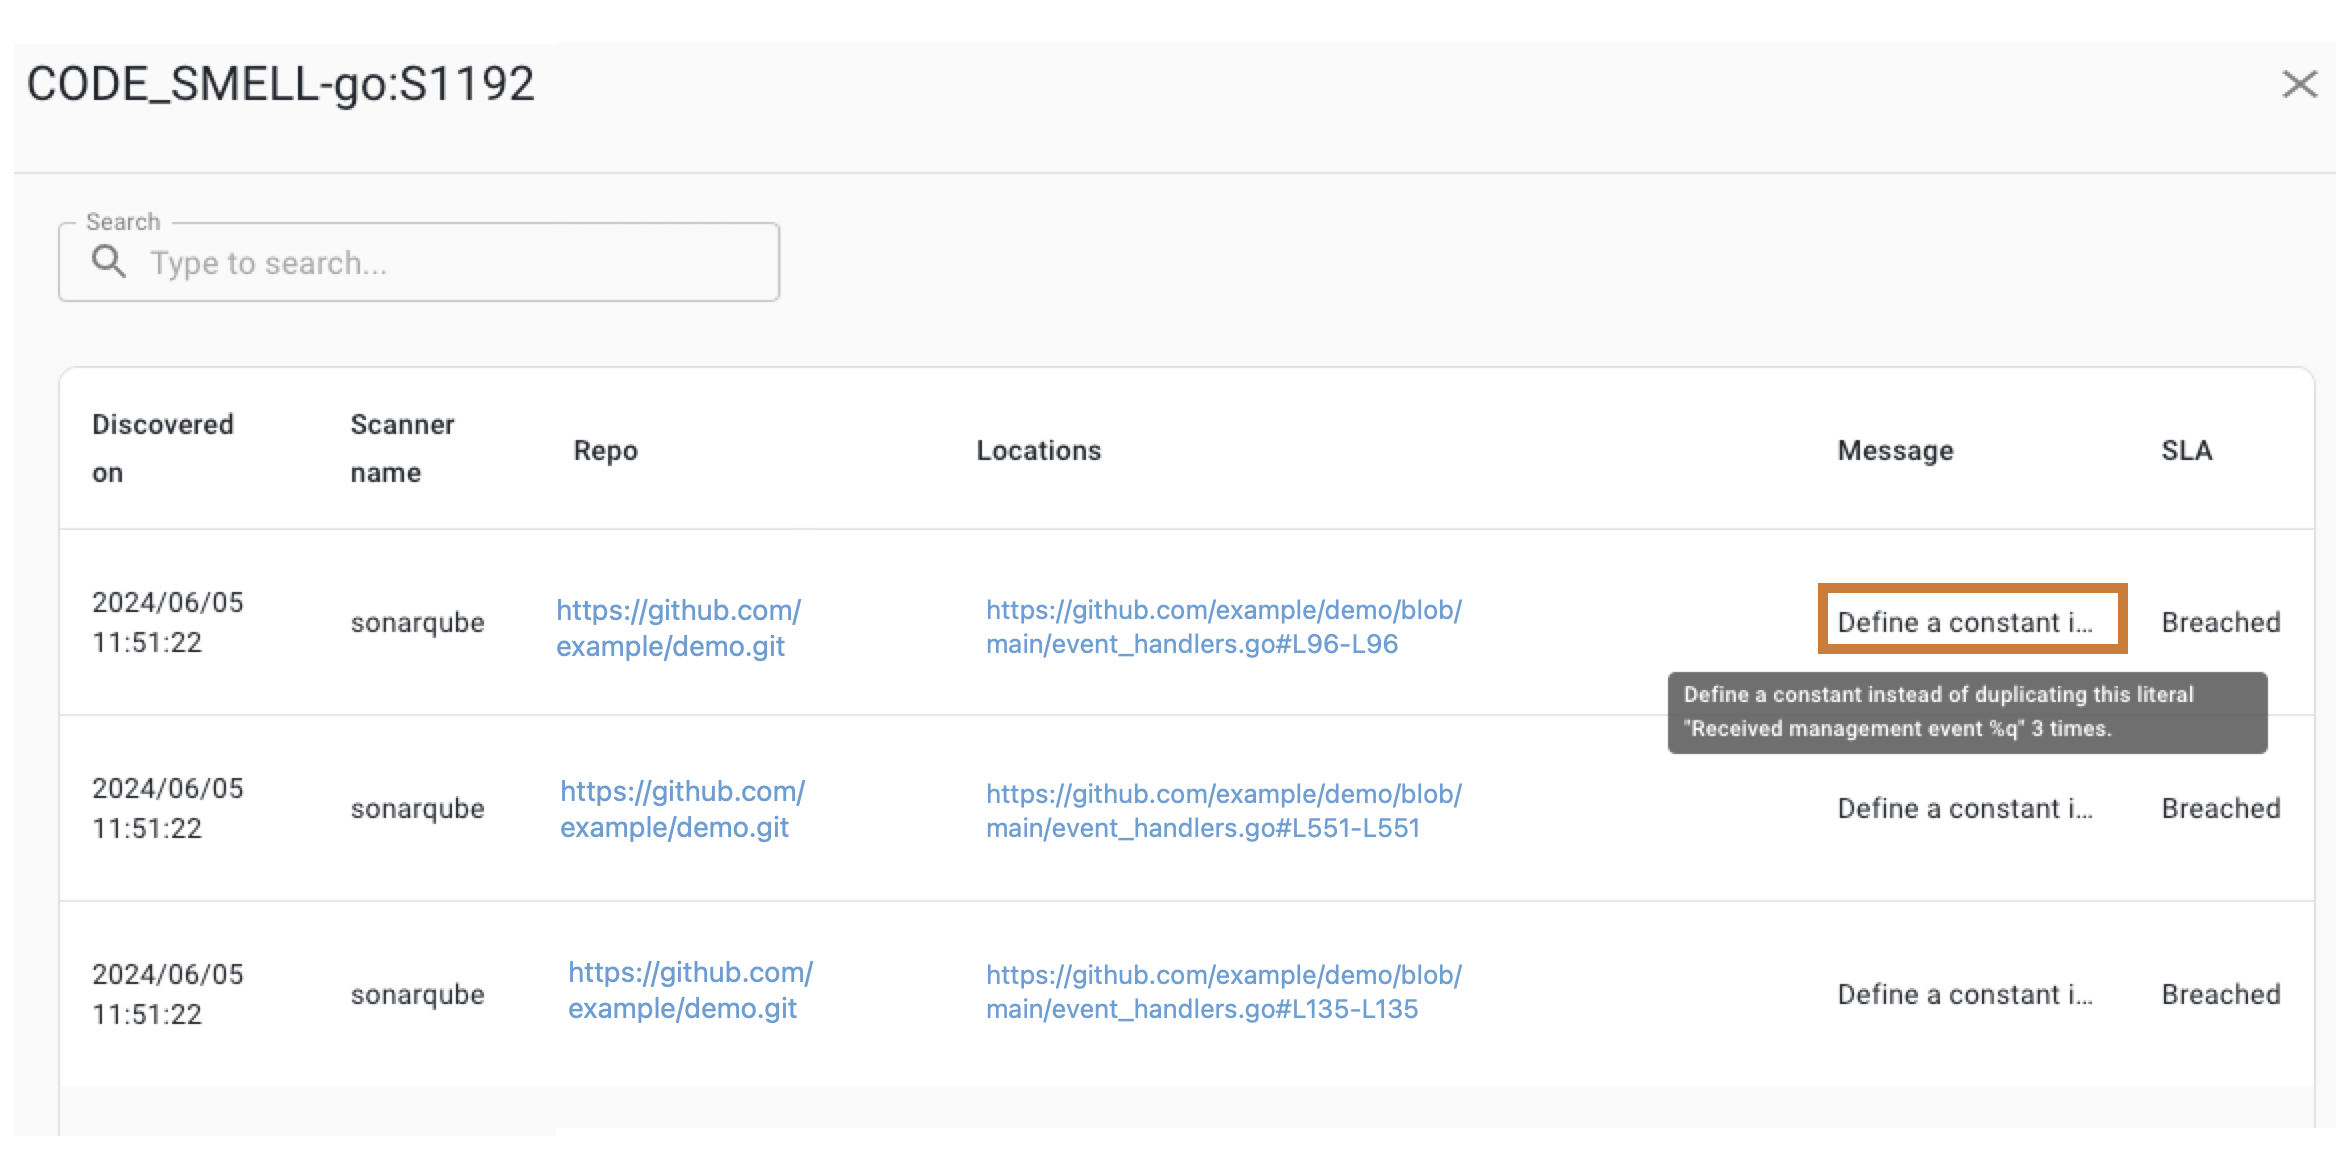
Select the number of occurrences to display the occurrence details for that issue:
-
Discovered date and time.
-
Scanner name.
-
Repository URL: Select to display the source code.
-
Location (file and line numbers): Select to display the file with the occurrence highlighted.
-
Message.
-
SLA status.
-
An example list of occurrence details is displayed below.

The file line numbers are formatted as #L<beginning line number>-L<ending line number>.
|
Latest test results
Get a summary of the test suites performed within your chosen code branch and time frame.
Search by entering all or part of the test suite name into Search.
The summary includes the following:
-
Test suite name
-
Workflow name
-
Last run date and time
-
-
Totals
-
Passing
-
Failed
-
Skipped
-
-
Run duration
Trivy licenses overview
Get a summary of licenses, severities, and library locations from the Trivy scan of your chosen code branch and time frame.
The overview lists the following library vulnerability information:
-
Date and time first discovered
-
License type
-
Classification
-
Severity
-
Number of occurrences: Select the number of occurrences to display the occurrence details for that issue:
-
Package name
-
Failure location
-
Used since date and time
-