CloudBees Unify provides new users a preview image of the Value Stream Management (VSM) dashboard during onboarding. Additionally, the onboarding screen provides the preconditions needed to enable and view data on the dashboards, Jenkins® controllers, and CI insights for Jenkins.
Below are the preconditions to enable the dashboards, which vary for each dashboard:
-
Availability of a component.
-
Availability of a workflow.
-
Integrating your Jira.
-
Defining the flow items.
-
Availability of an environment.
-
Availability of an integration.
When you access the corresponding screen for the first time, the precondition instructions are displayed. You can also navigate directly to the exact screen to complete the required tasks. After you meet the preconditions, the onboarding screen no longer appears.
Below is a sample screenshot of an onboarding screen:
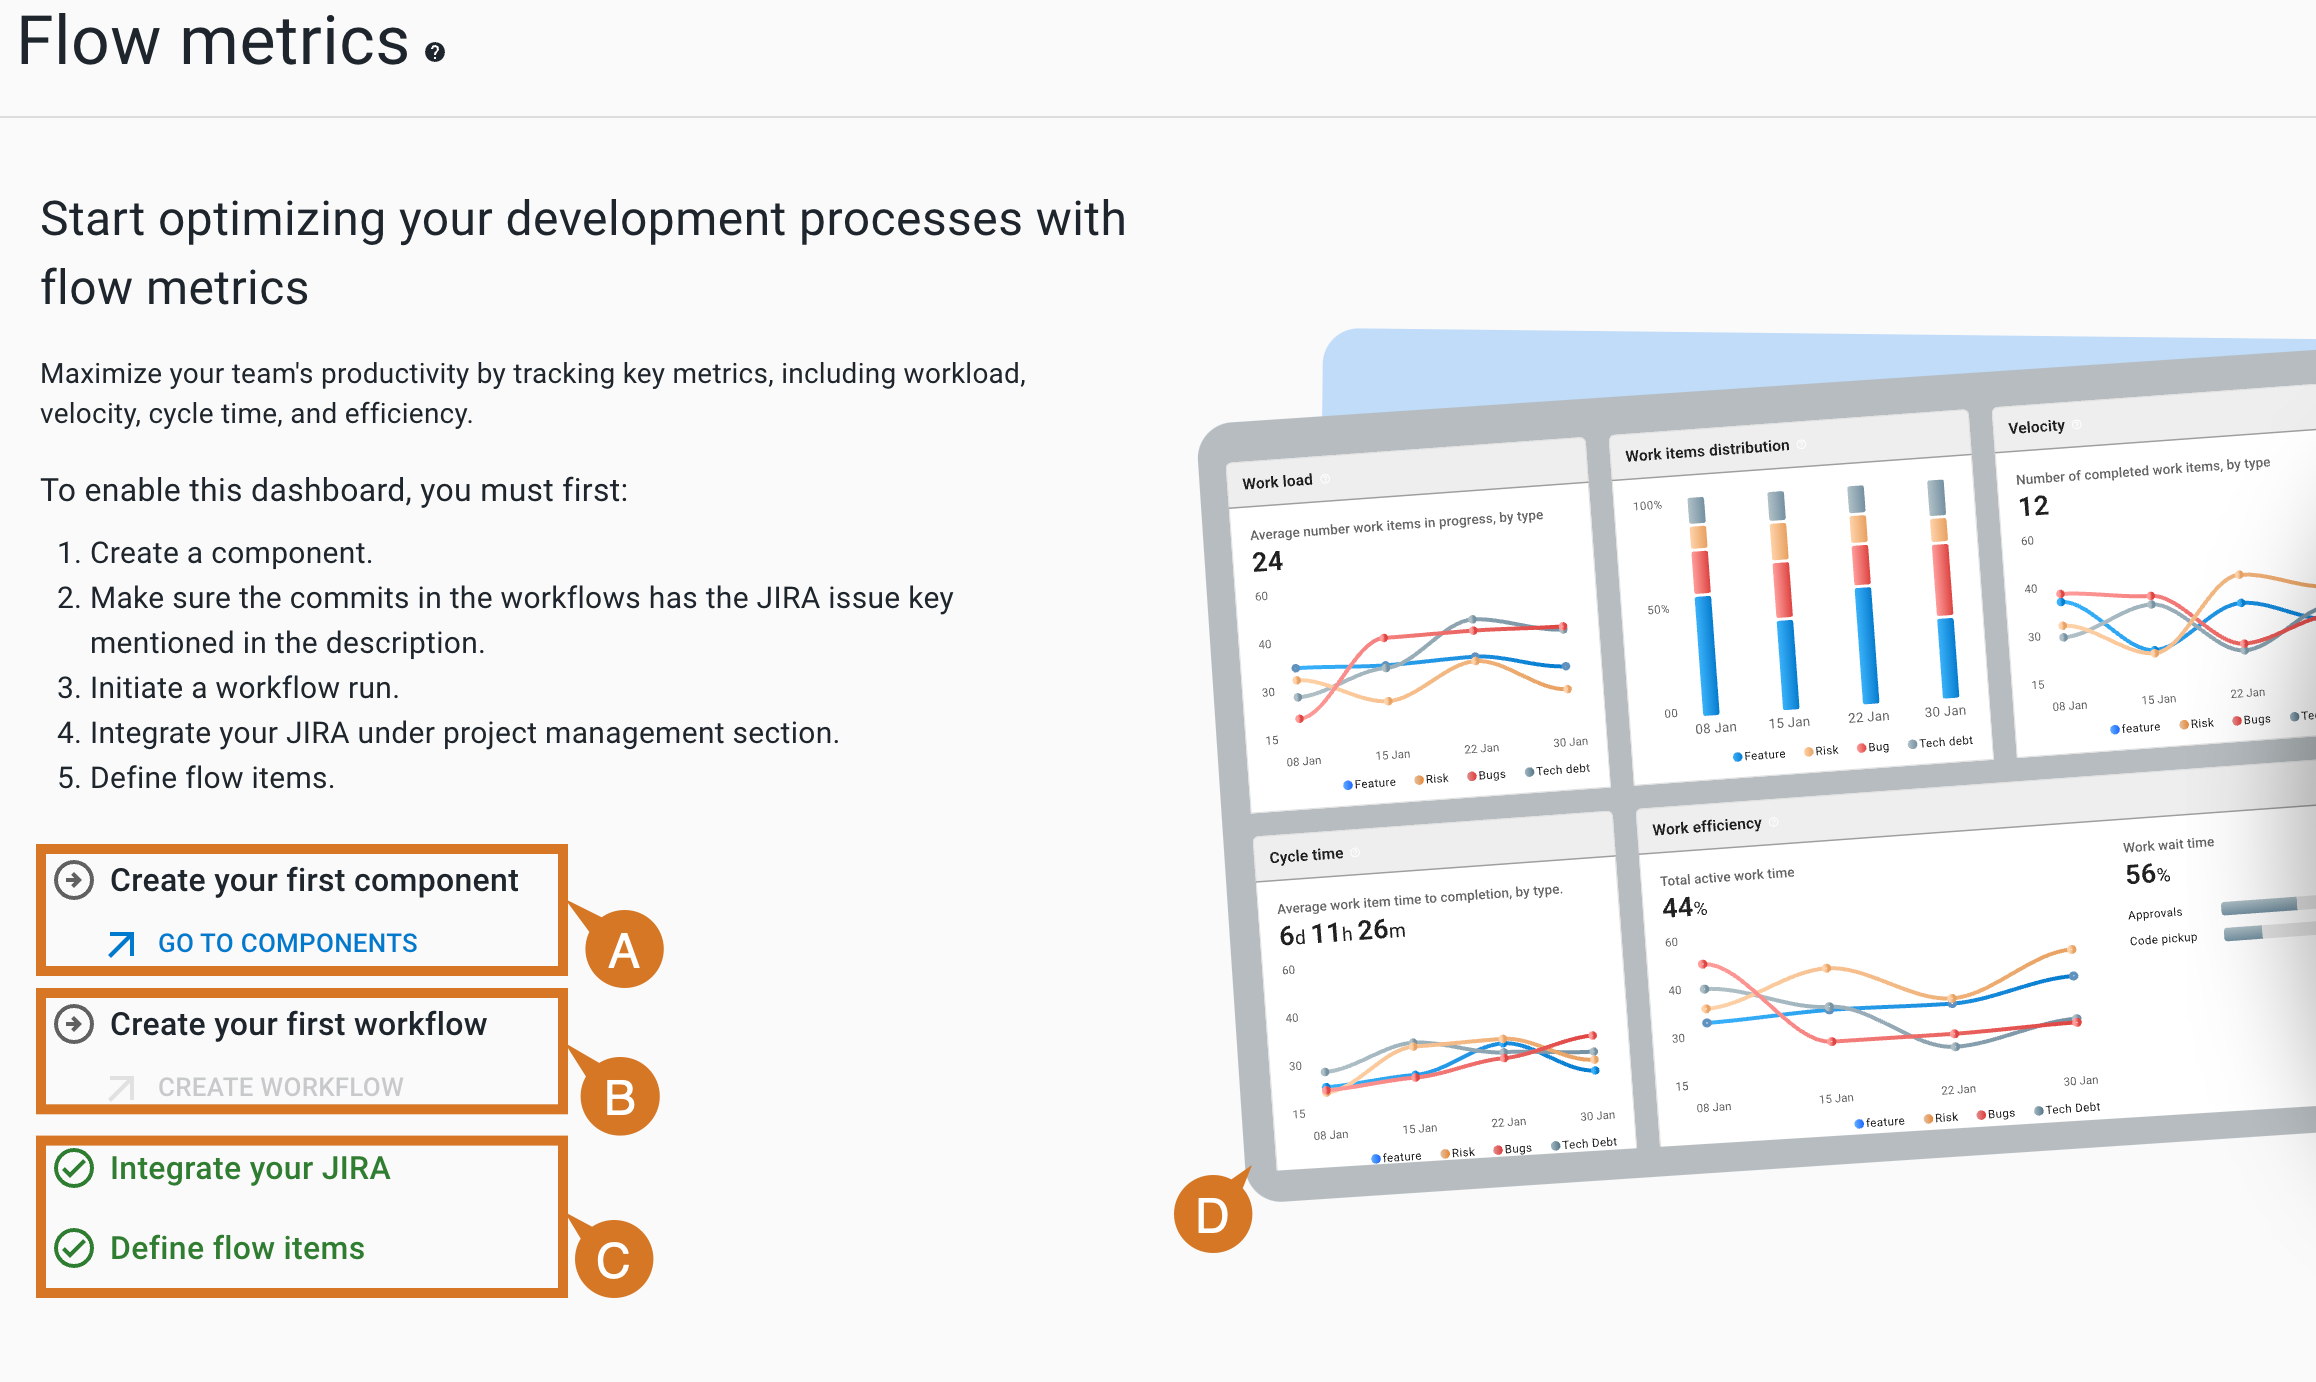
-
Task can be performed on selecting the blue link.
-
Task can be performed only after the dependent task is completed.
-
Task is completed successfully.
-
Preview image of the dashboard.
The preview screen with instructions appear for the following screens:
-
VSM dashboards
-
Jenkins management
Listed below are some key pointers to consider while enabling a dashboard:
-
Creating your first component and workflow are dependent tasks. Start by creating the component, then proceed to create the workflow. In contrast, creating an environment, integrating your Jira, defining the flow items, and creating an integration are independent tasks.
-
Execute at least one workflow run to generate data for the dashboard.
-
Include the Jira issue key in every commit to generate complete data in your flow metrics dashboard.
-
Include the build and deploy steps to the workflow for the DORA metrics dashboard. Specify the appropriate step kind for each step, as noted in Associate run data with analytics dashboards.
-
Include the test actions in the workflow for the test insights dashboard.
Enable software delivery activity
To enable the software delivery activity dashboard:
-
Go to .
-
Select GO TO COMPONENTS to create your first component.
-
Select Create workflow to create your first workflow.
If multiple components are available, the system prompts to select a component to create a workflow.
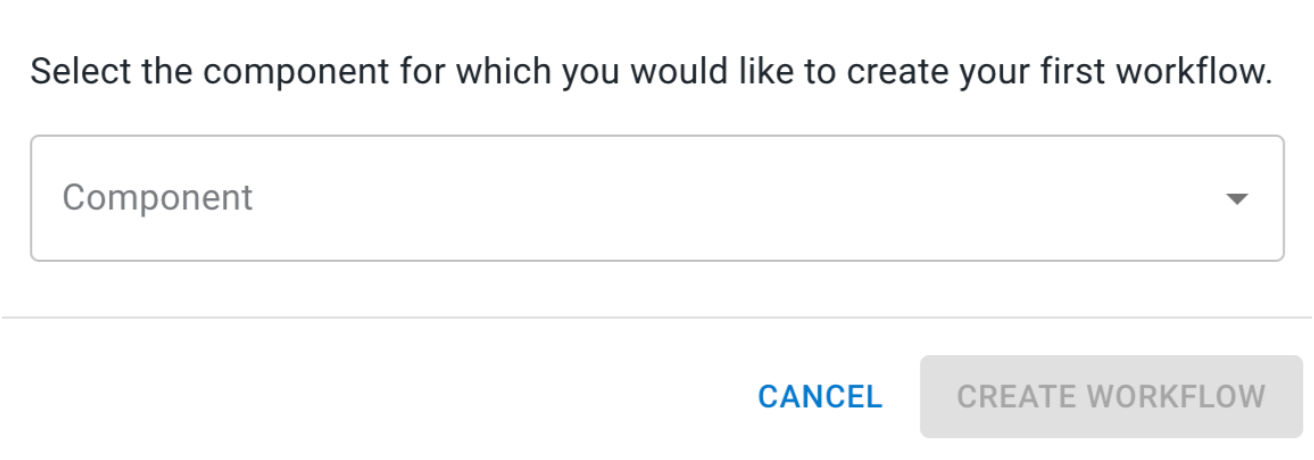 Figure 2. Component selection to create workflow
You must select the component and then select Create workflow to proceed with the workflow creation step.
If all the precondition steps are completed, the Software delivery activity dashboard is enabled. However, if the preconditions steps are completed but the workflow runs are not executed, a warning appears. You must execute at least one workflow run to generate data on the dashboard.
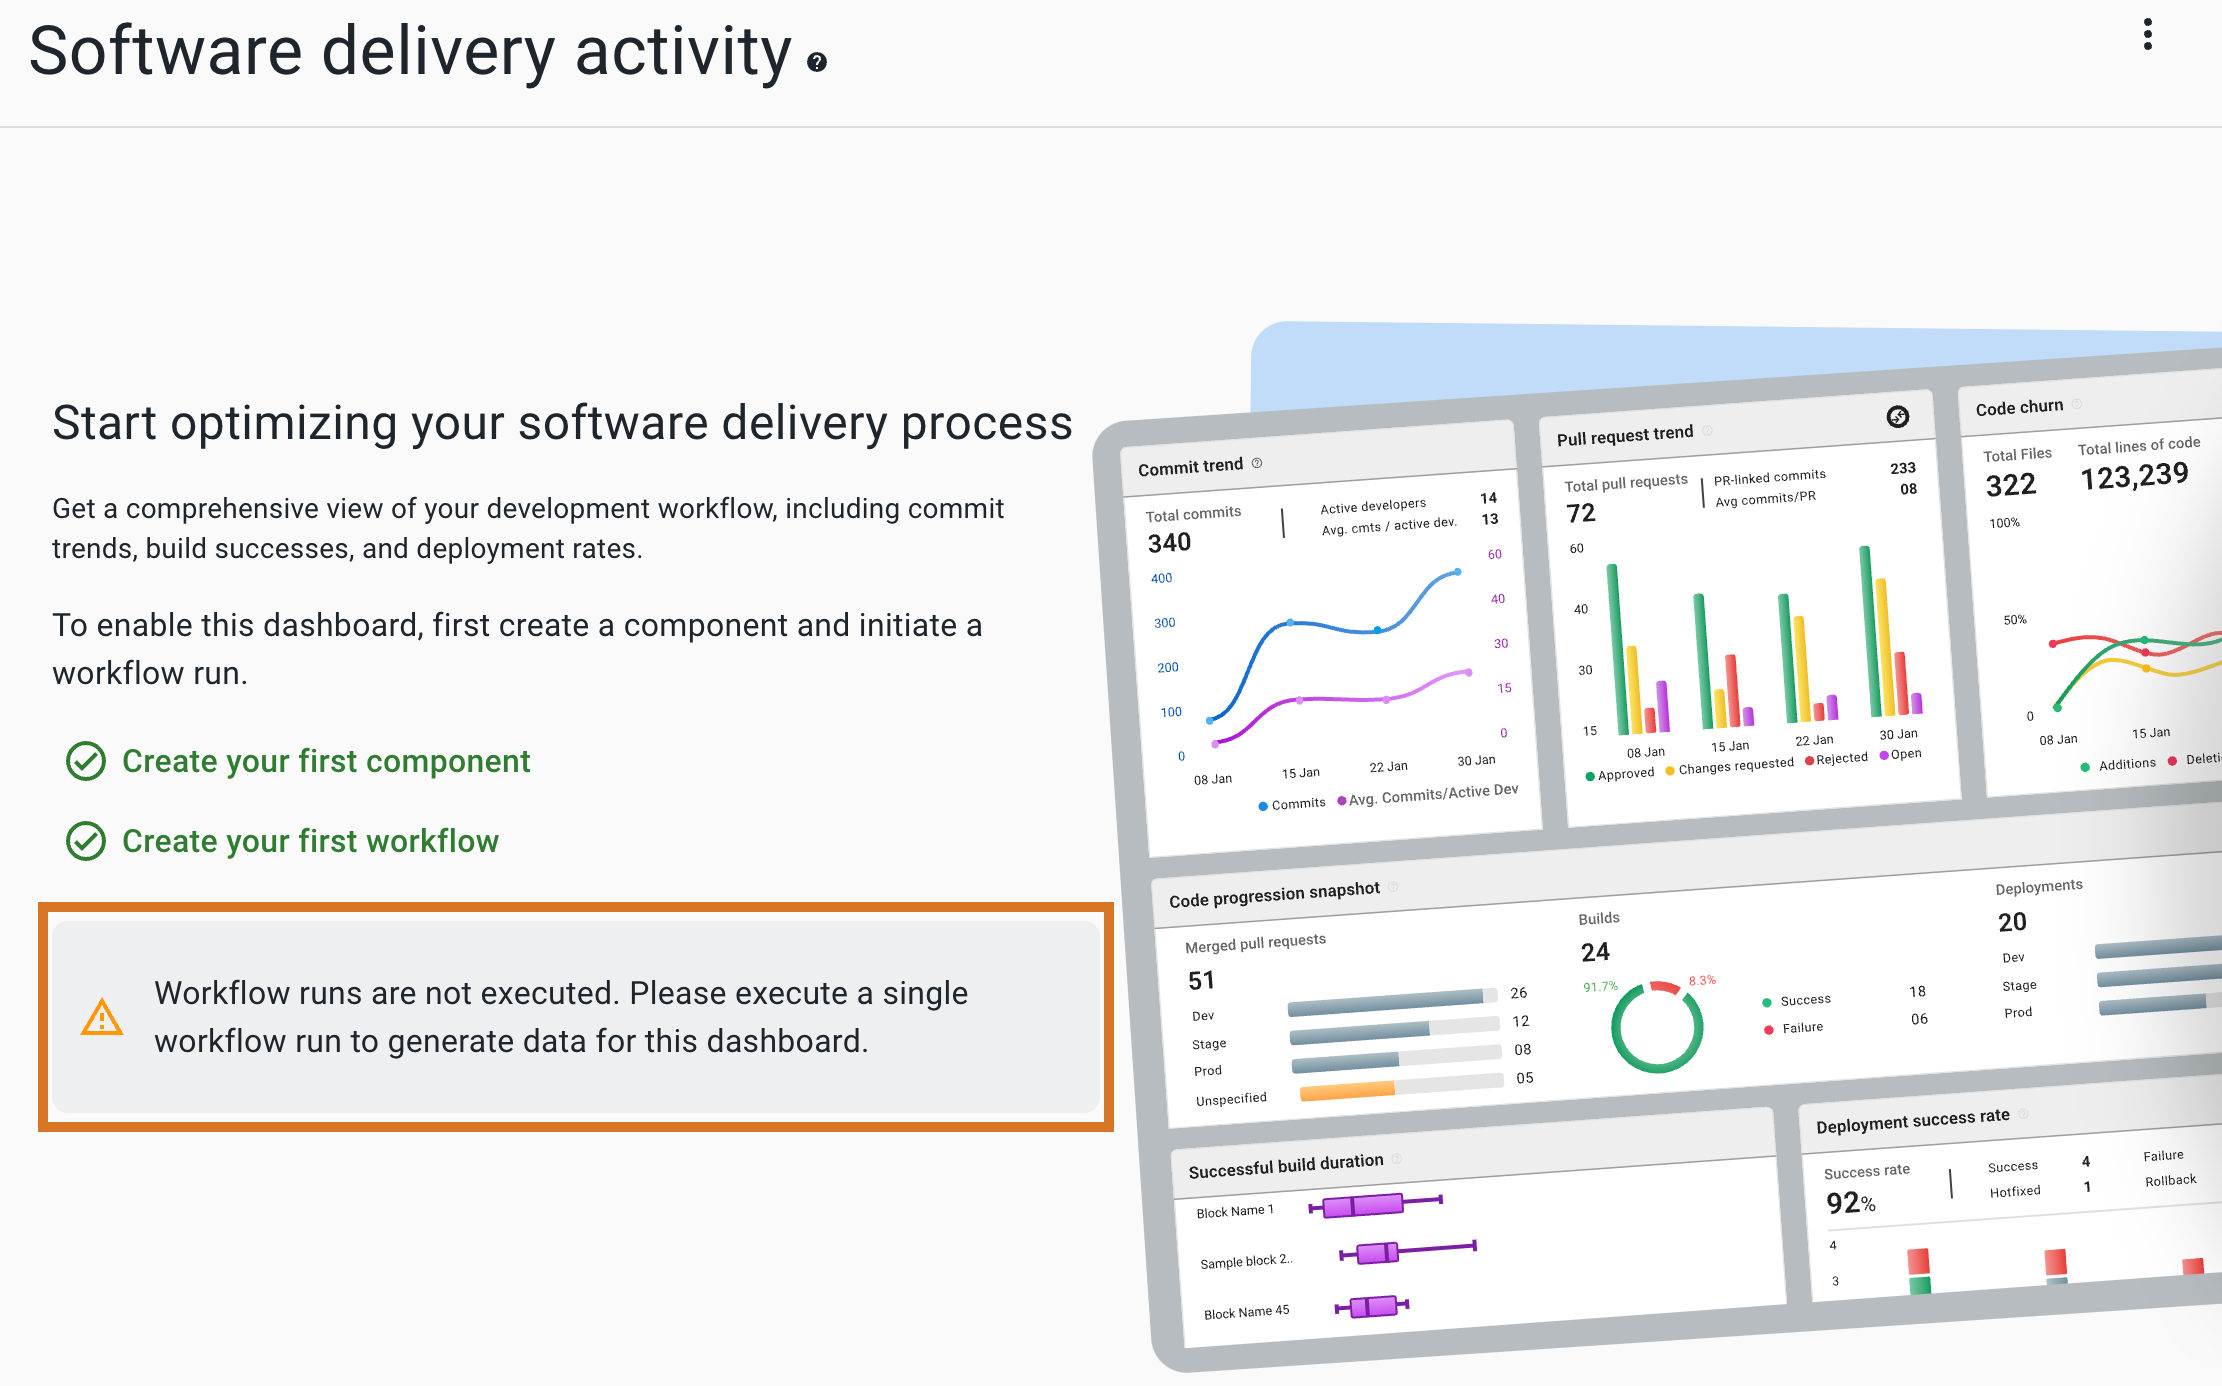 Figure 3. Preconditions met but runs not executed
Enable security insights
To enable the security insights dashboard:
-
Go to .
-
Select GO TO COMPONENTS to create your first component.
-
Select CREATE WORKFLOW to create your first workflow.
-
If multiple components are available, the system prompts to select a component to create a workflow.
-
If you include a security scanner while creating a workflow, the dashboard populates the data with security scanner details. Otherwise, it populates the data without scanner details.
If all the precondition steps are completed, the Security insights dashboard is enabled. However, if the preconditions steps are completed but the workflow runs are not executed, a warning appears. You must execute at least one workflow run to generate data on the dashboard.
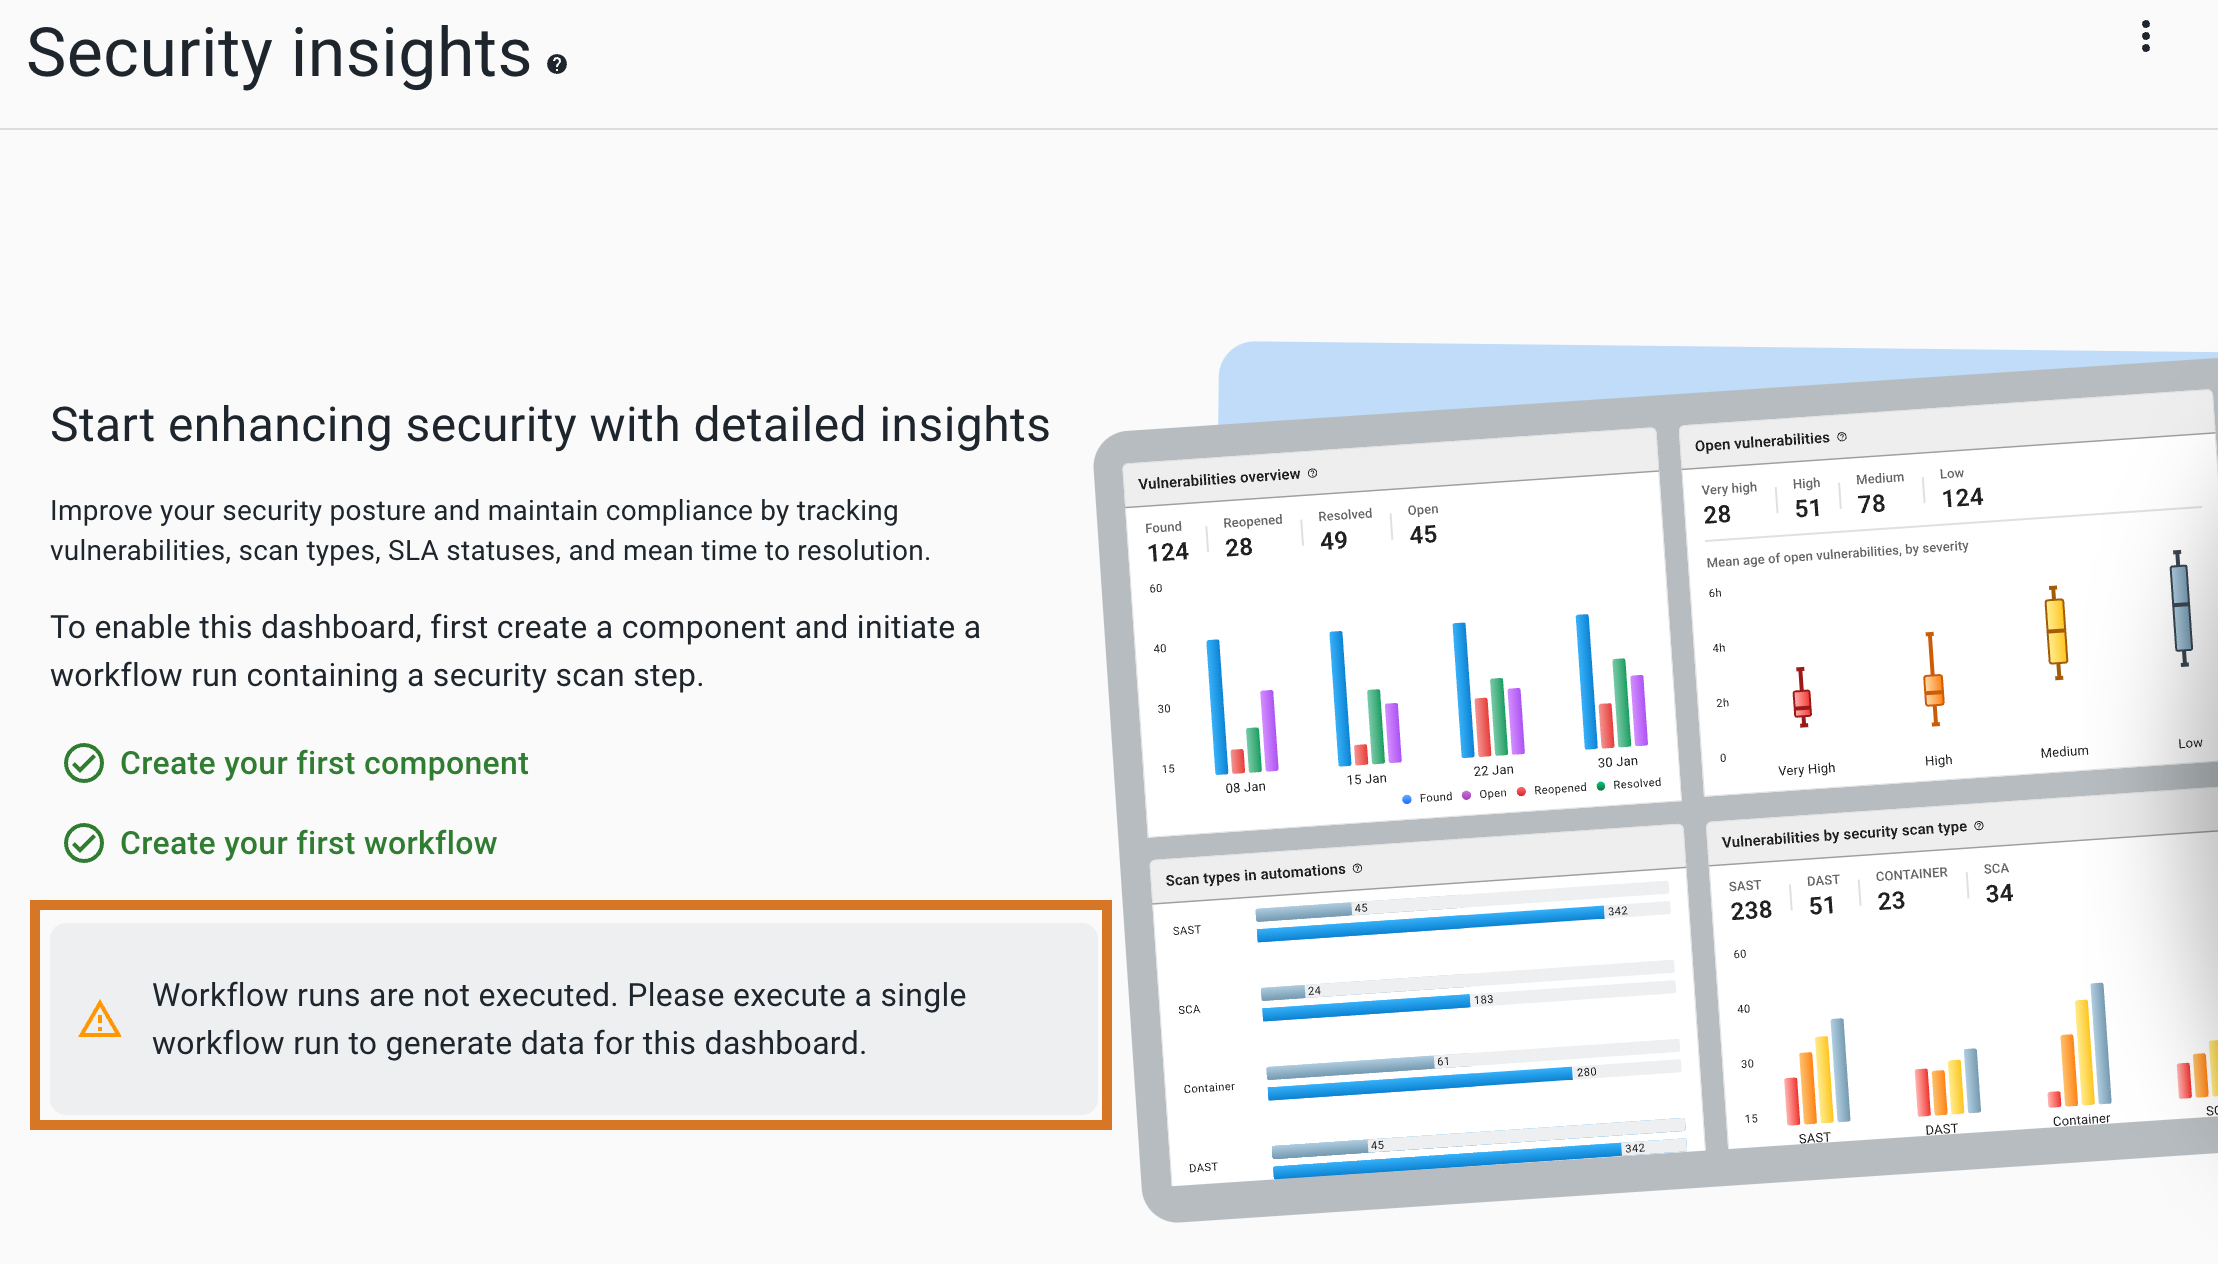 Figure 4. Preconditions met but runs not executed
 -
Enable flow metrics
To enable the flow metrics dashboard:
-
Go to .
Creating your first component and workflow are dependent tasks. Start by creating the component, then proceed to create the workflow. In contrast, integrating with Jira and defining flow items are independent tasks that can be completed separately. -
Select GO TO COMPONENTS to create your first component.
-
Select CREATE WORKFLOW to create your first workflow.
If multiple components are available, the system prompts to select a component to create a workflow. -
Select GO TO INTEGRATIONS to integrate your Jira.
-
Select GO TO ANALYTICS CONFIGURATION to define the flow items.
If all the precondition steps are completed, the Flow metrics dashboard is enabled. However, if the preconditions steps are completed without including the Jira ticket to the commit, a warning appears. You must include the Jira issue key to enable the dashboard.
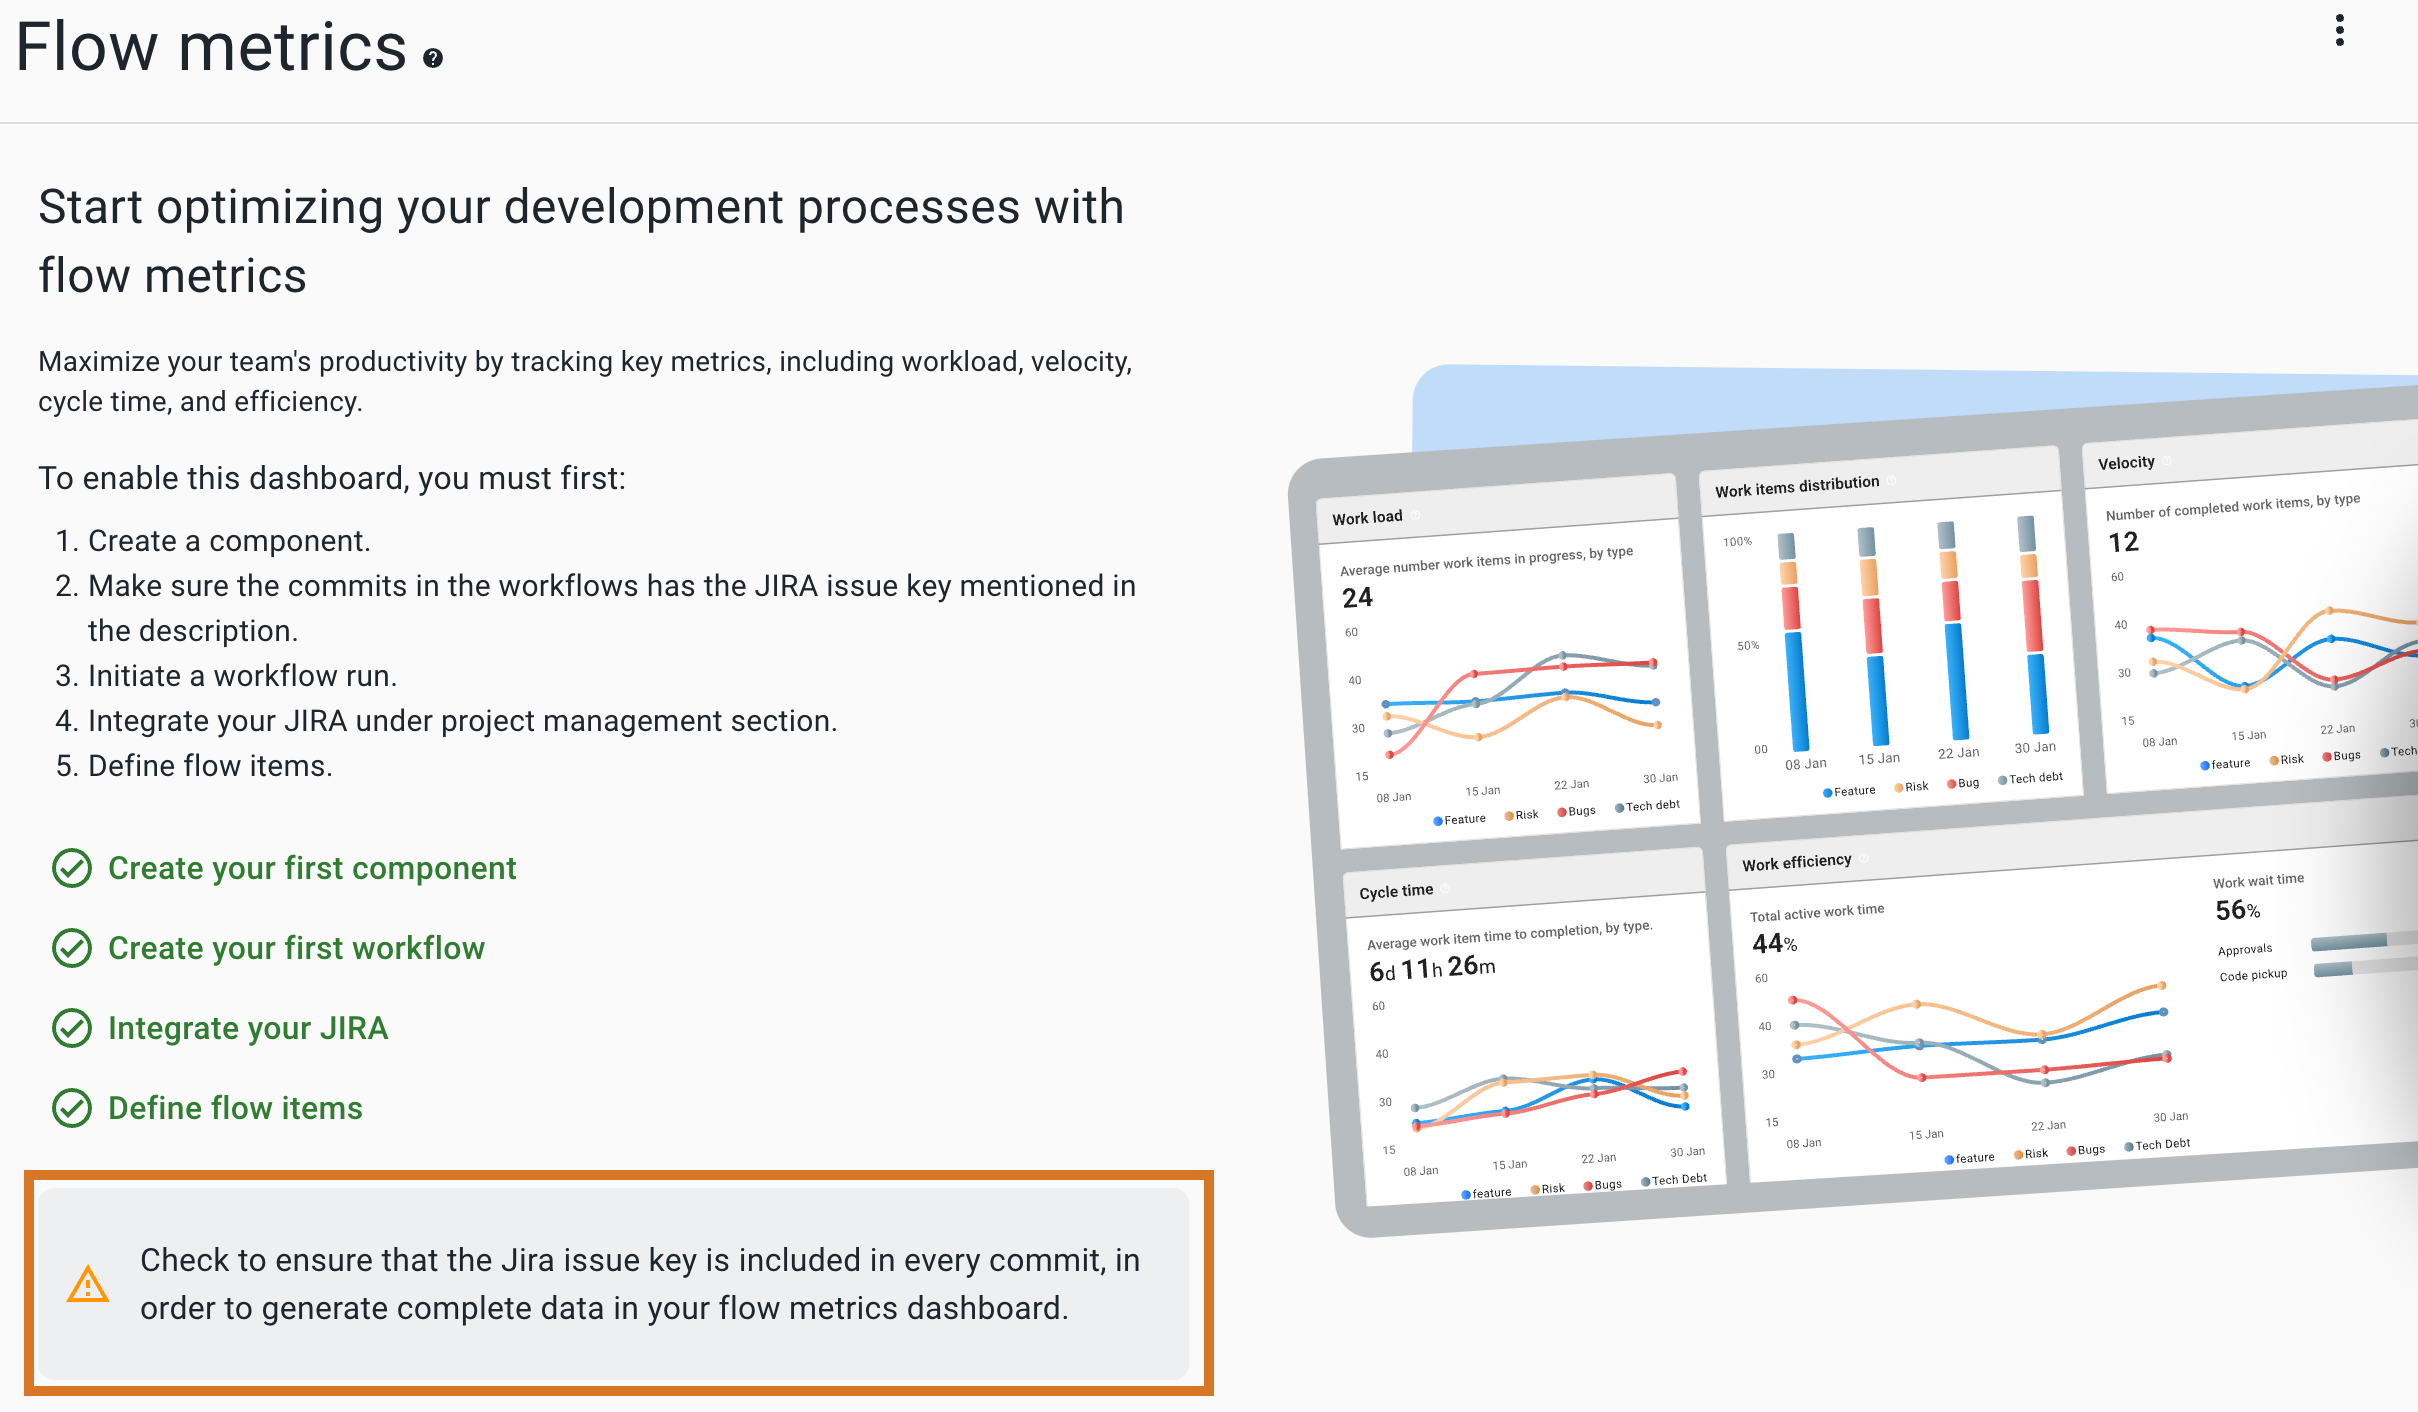 Figure 5. Preconditions met but Jira issue key not included
Enable DORA metrics
To enable the DORA metrics dashboard:
-
Go to .
Creating your first component and workflow are dependent tasks. Start by creating the component, then proceed to create the workflow. In contrast, creating an environment is an independent task. -
Select GO TO COMPONENTS to create your first component.
-
Select CREATE WORKFLOW to create your first workflow.
If multiple components are available, the system prompts to select a component to create a workflow.
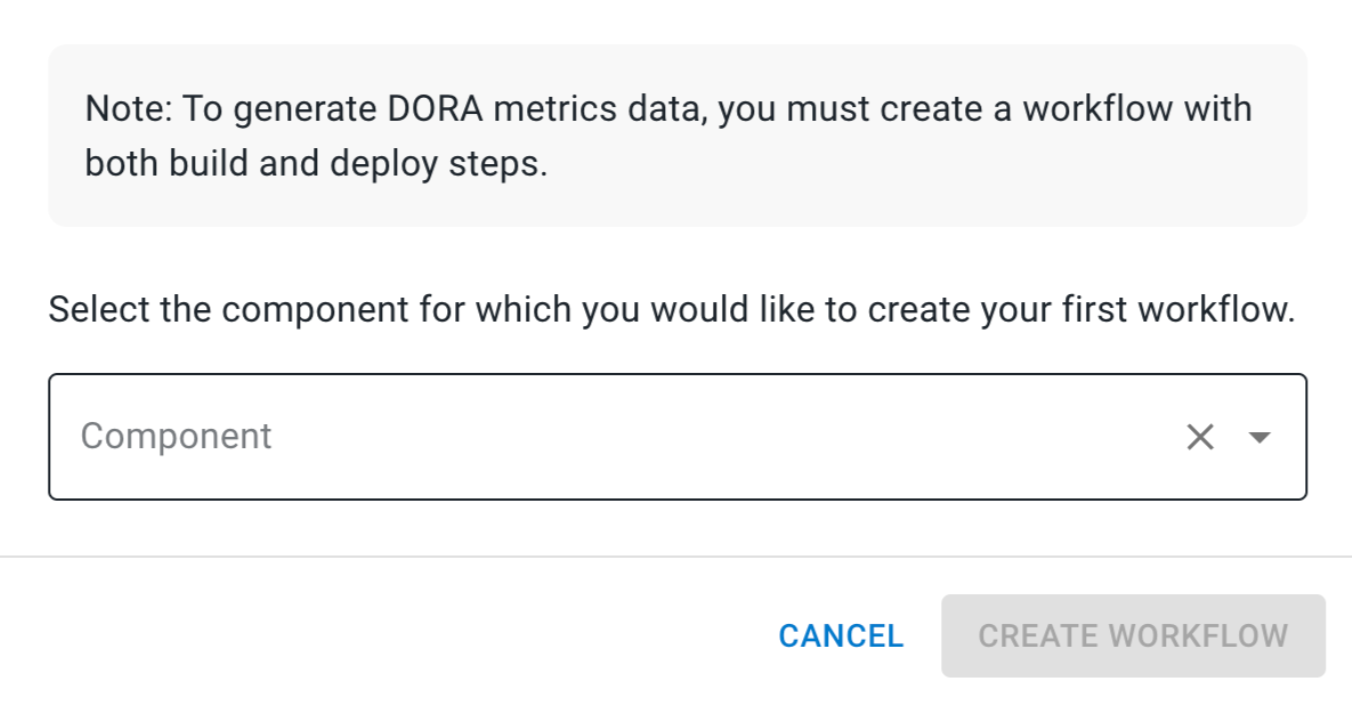 Figure 6. Component selection for DORA metrics
You must select the component and then select CREATE WORKFLOW to proceed with the workflow creation step.
-
Select CREATE ENVIRONMENT to create your first environment.
If all the precondition steps are completed, the DORA metrics dashboard is enabled. However, if the preconditions steps are completed without including the build and deployment steps, a warning appears. You must include the build and deploy steps to enable the dashboard.
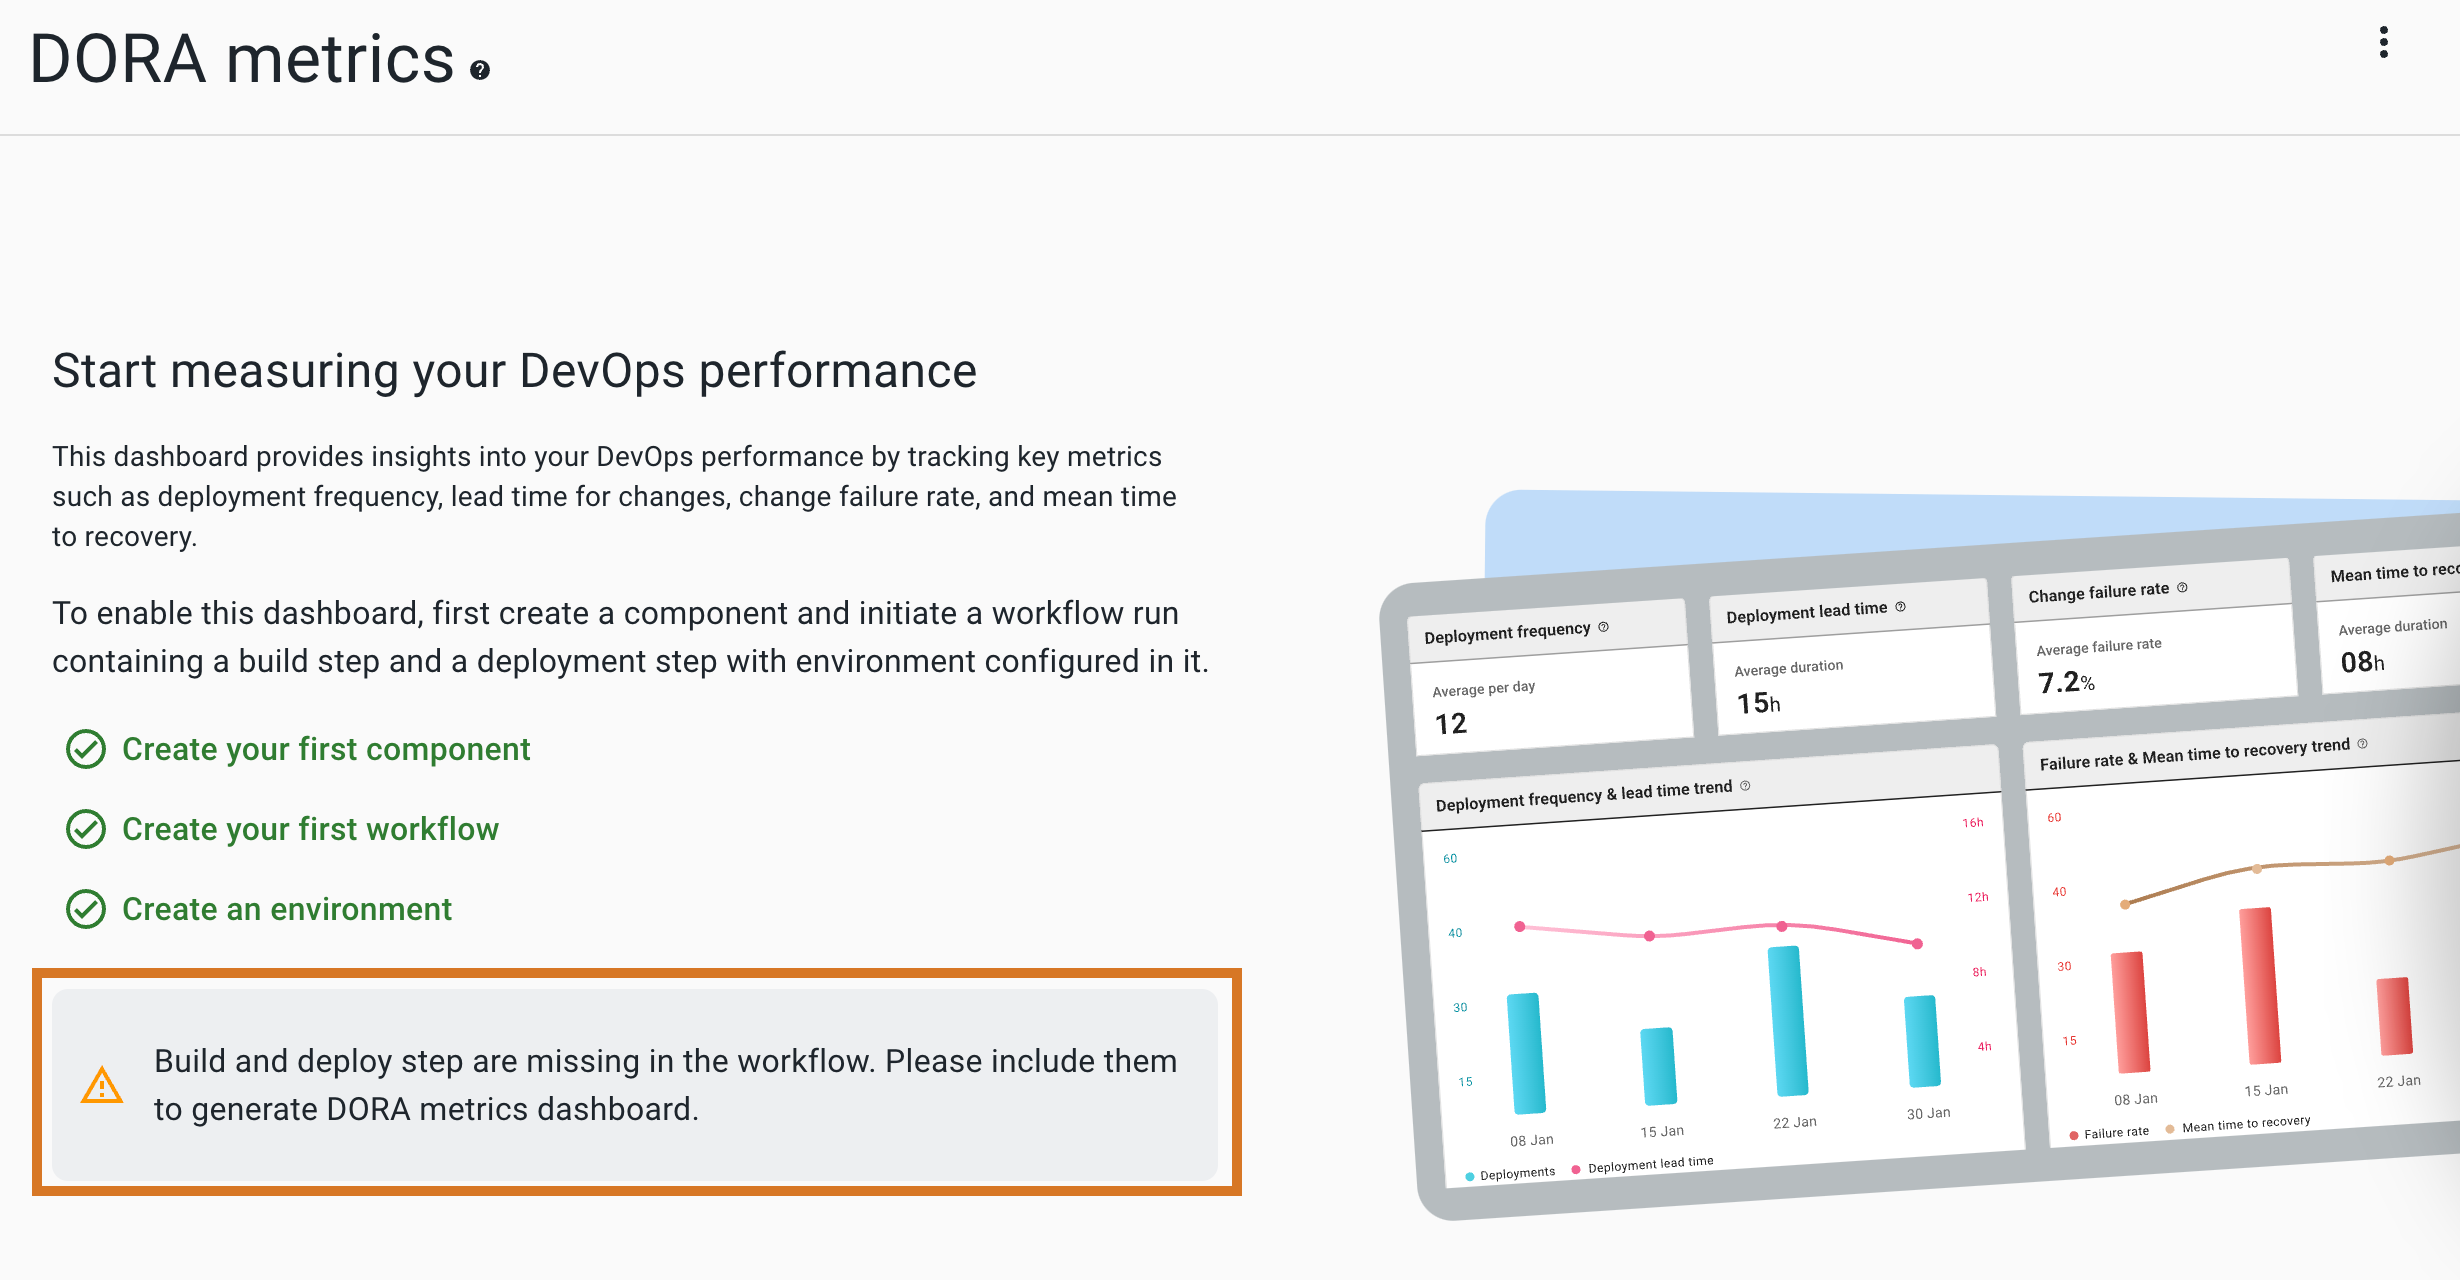 Figure 7. Preconditions met but build and deploy step are missing
Enable test insights
To enable the test insights dashboard:
-
Go to .
-
Select GO TO COMPONENTS to create your first component.
-
Select CREATE WORKFLOW to create your first workflow.
If multiple components are available, the system prompts to select a component to create a workflow.
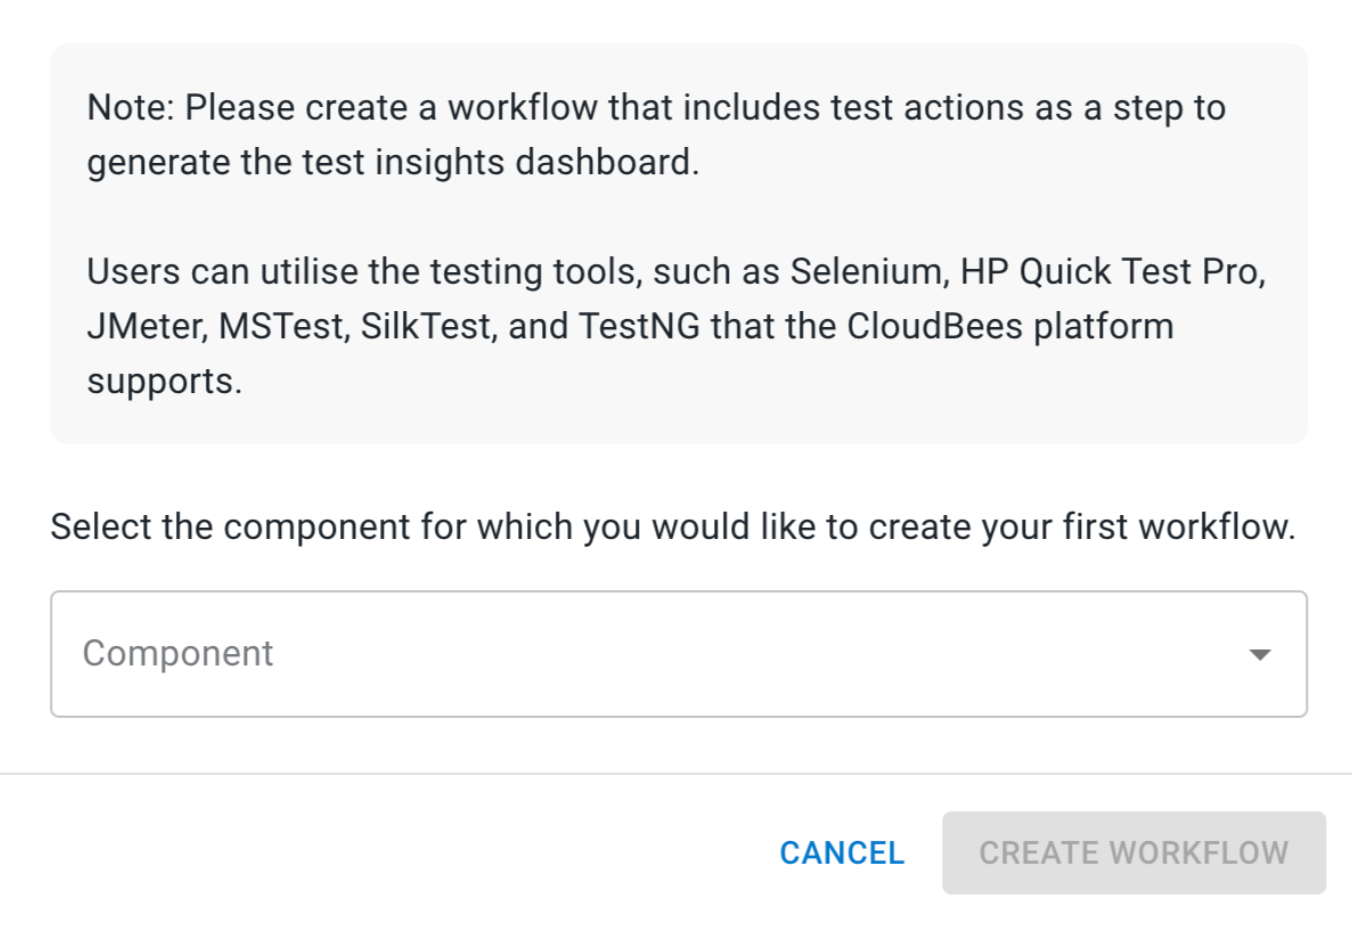 Figure 8. Component selection for test insights
You must select the component and then select CREATE WORKFLOW to proceed with the workflow creation step.
If all the precondition steps are completed, the Test insights dashboard is enabled. However, if the preconditions steps are completed without including the test actions to the workflow, a warning appears. You must add the test actions to enable the dashboard.
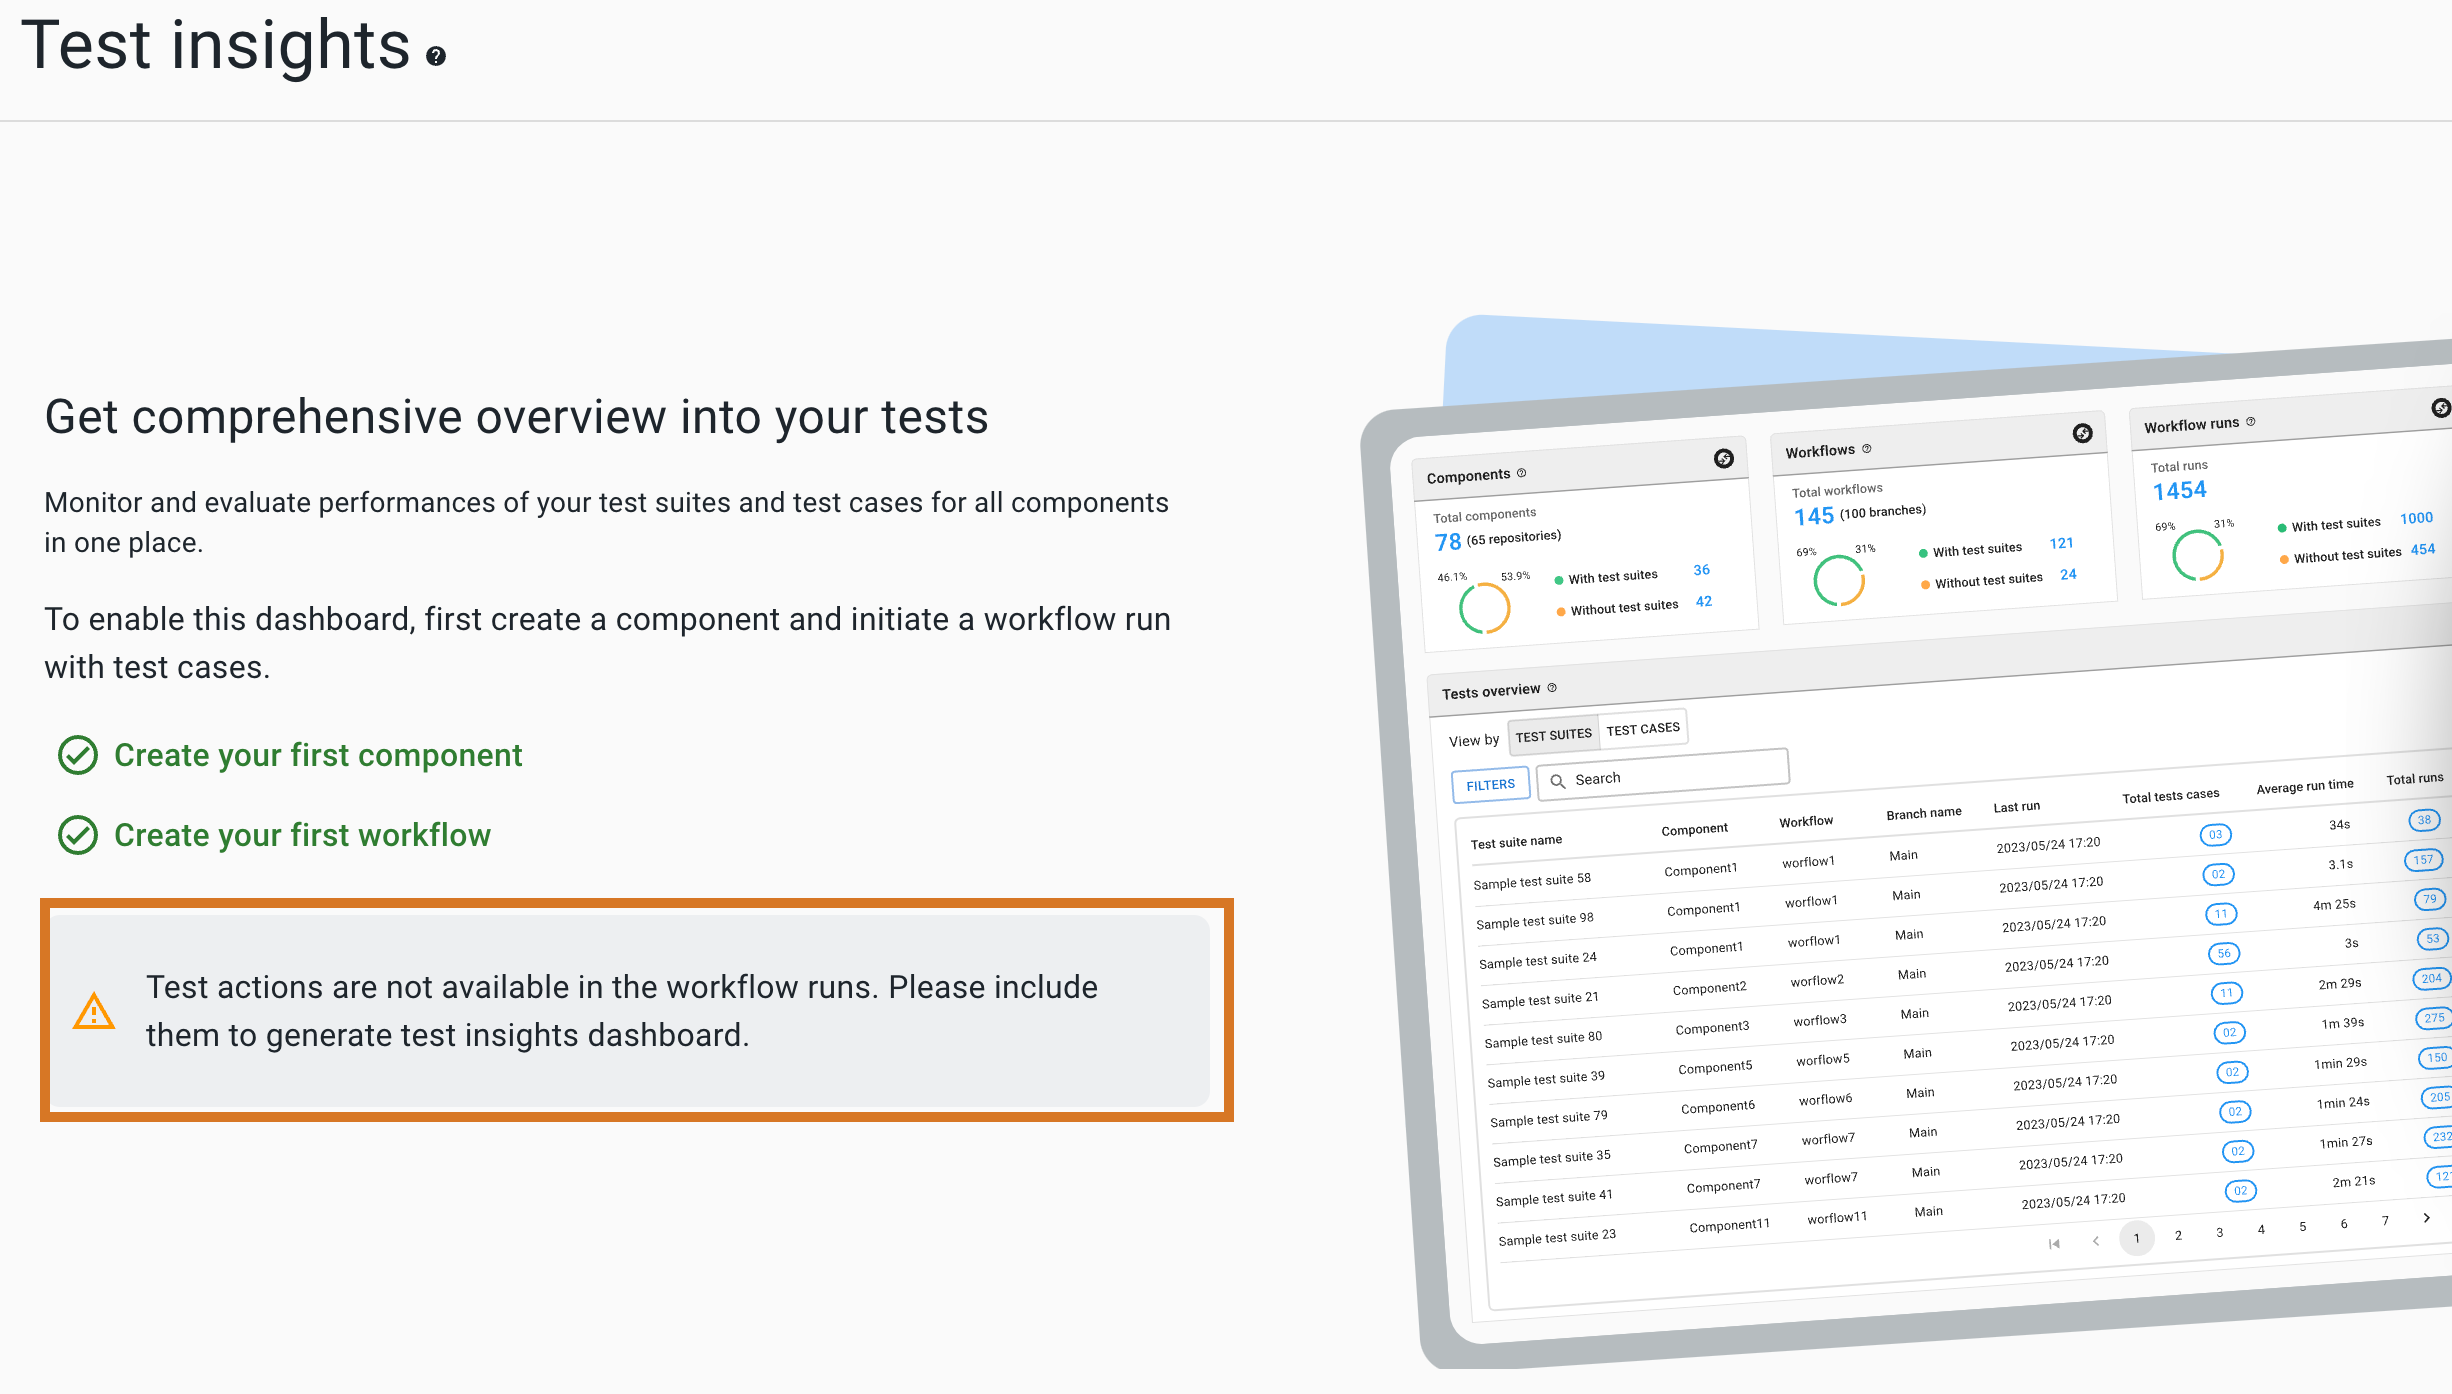 Figure 9. Test insights - Preconditions met
Enable CI insights for Jenkins
To enable the CI insights for Jenkins dashboard:
-
Go to .
-
Select GO TO INTEGRATIONS to create your first CI integration.
Once the CI integration is completed, the CI insights for Jenkins dashboard is enabled.
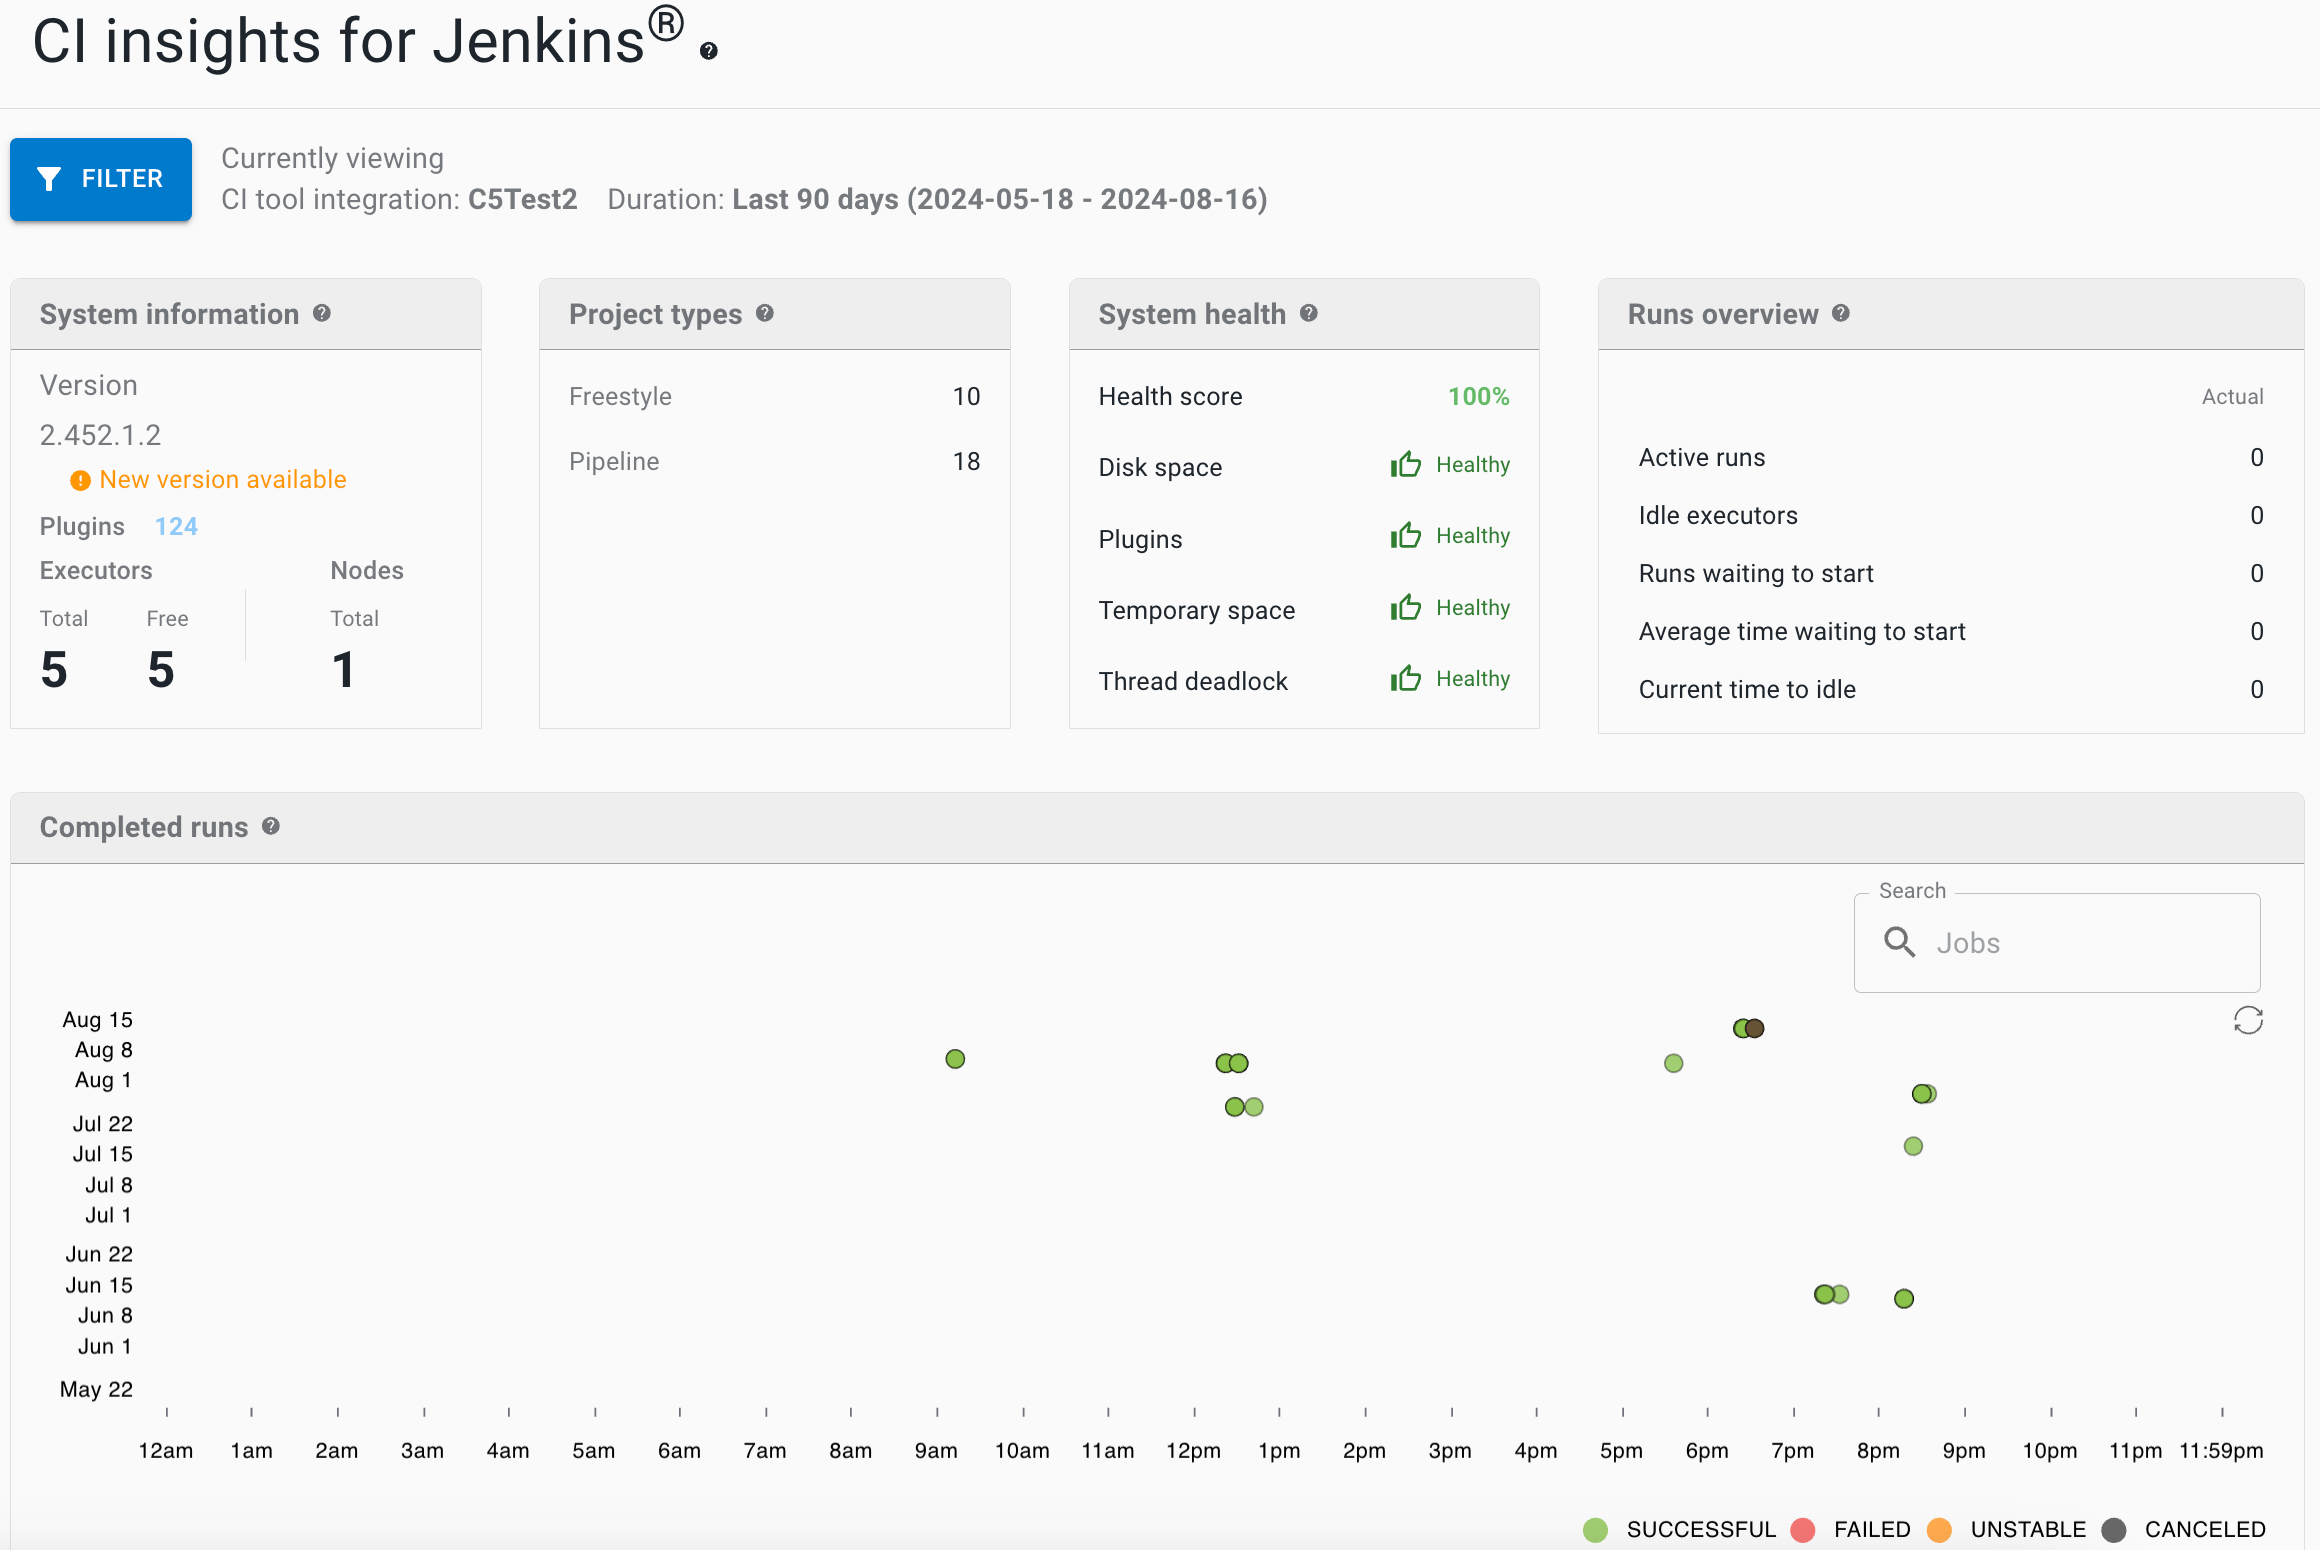 Figure 10. CI insights for Jenkins dashboard enabled
Enable Jenkins controllers
To integrate the controllers with CloudBees Unify:
-
Go to .
-
Select Create integration to integrate your controller with CloudBees Unify.
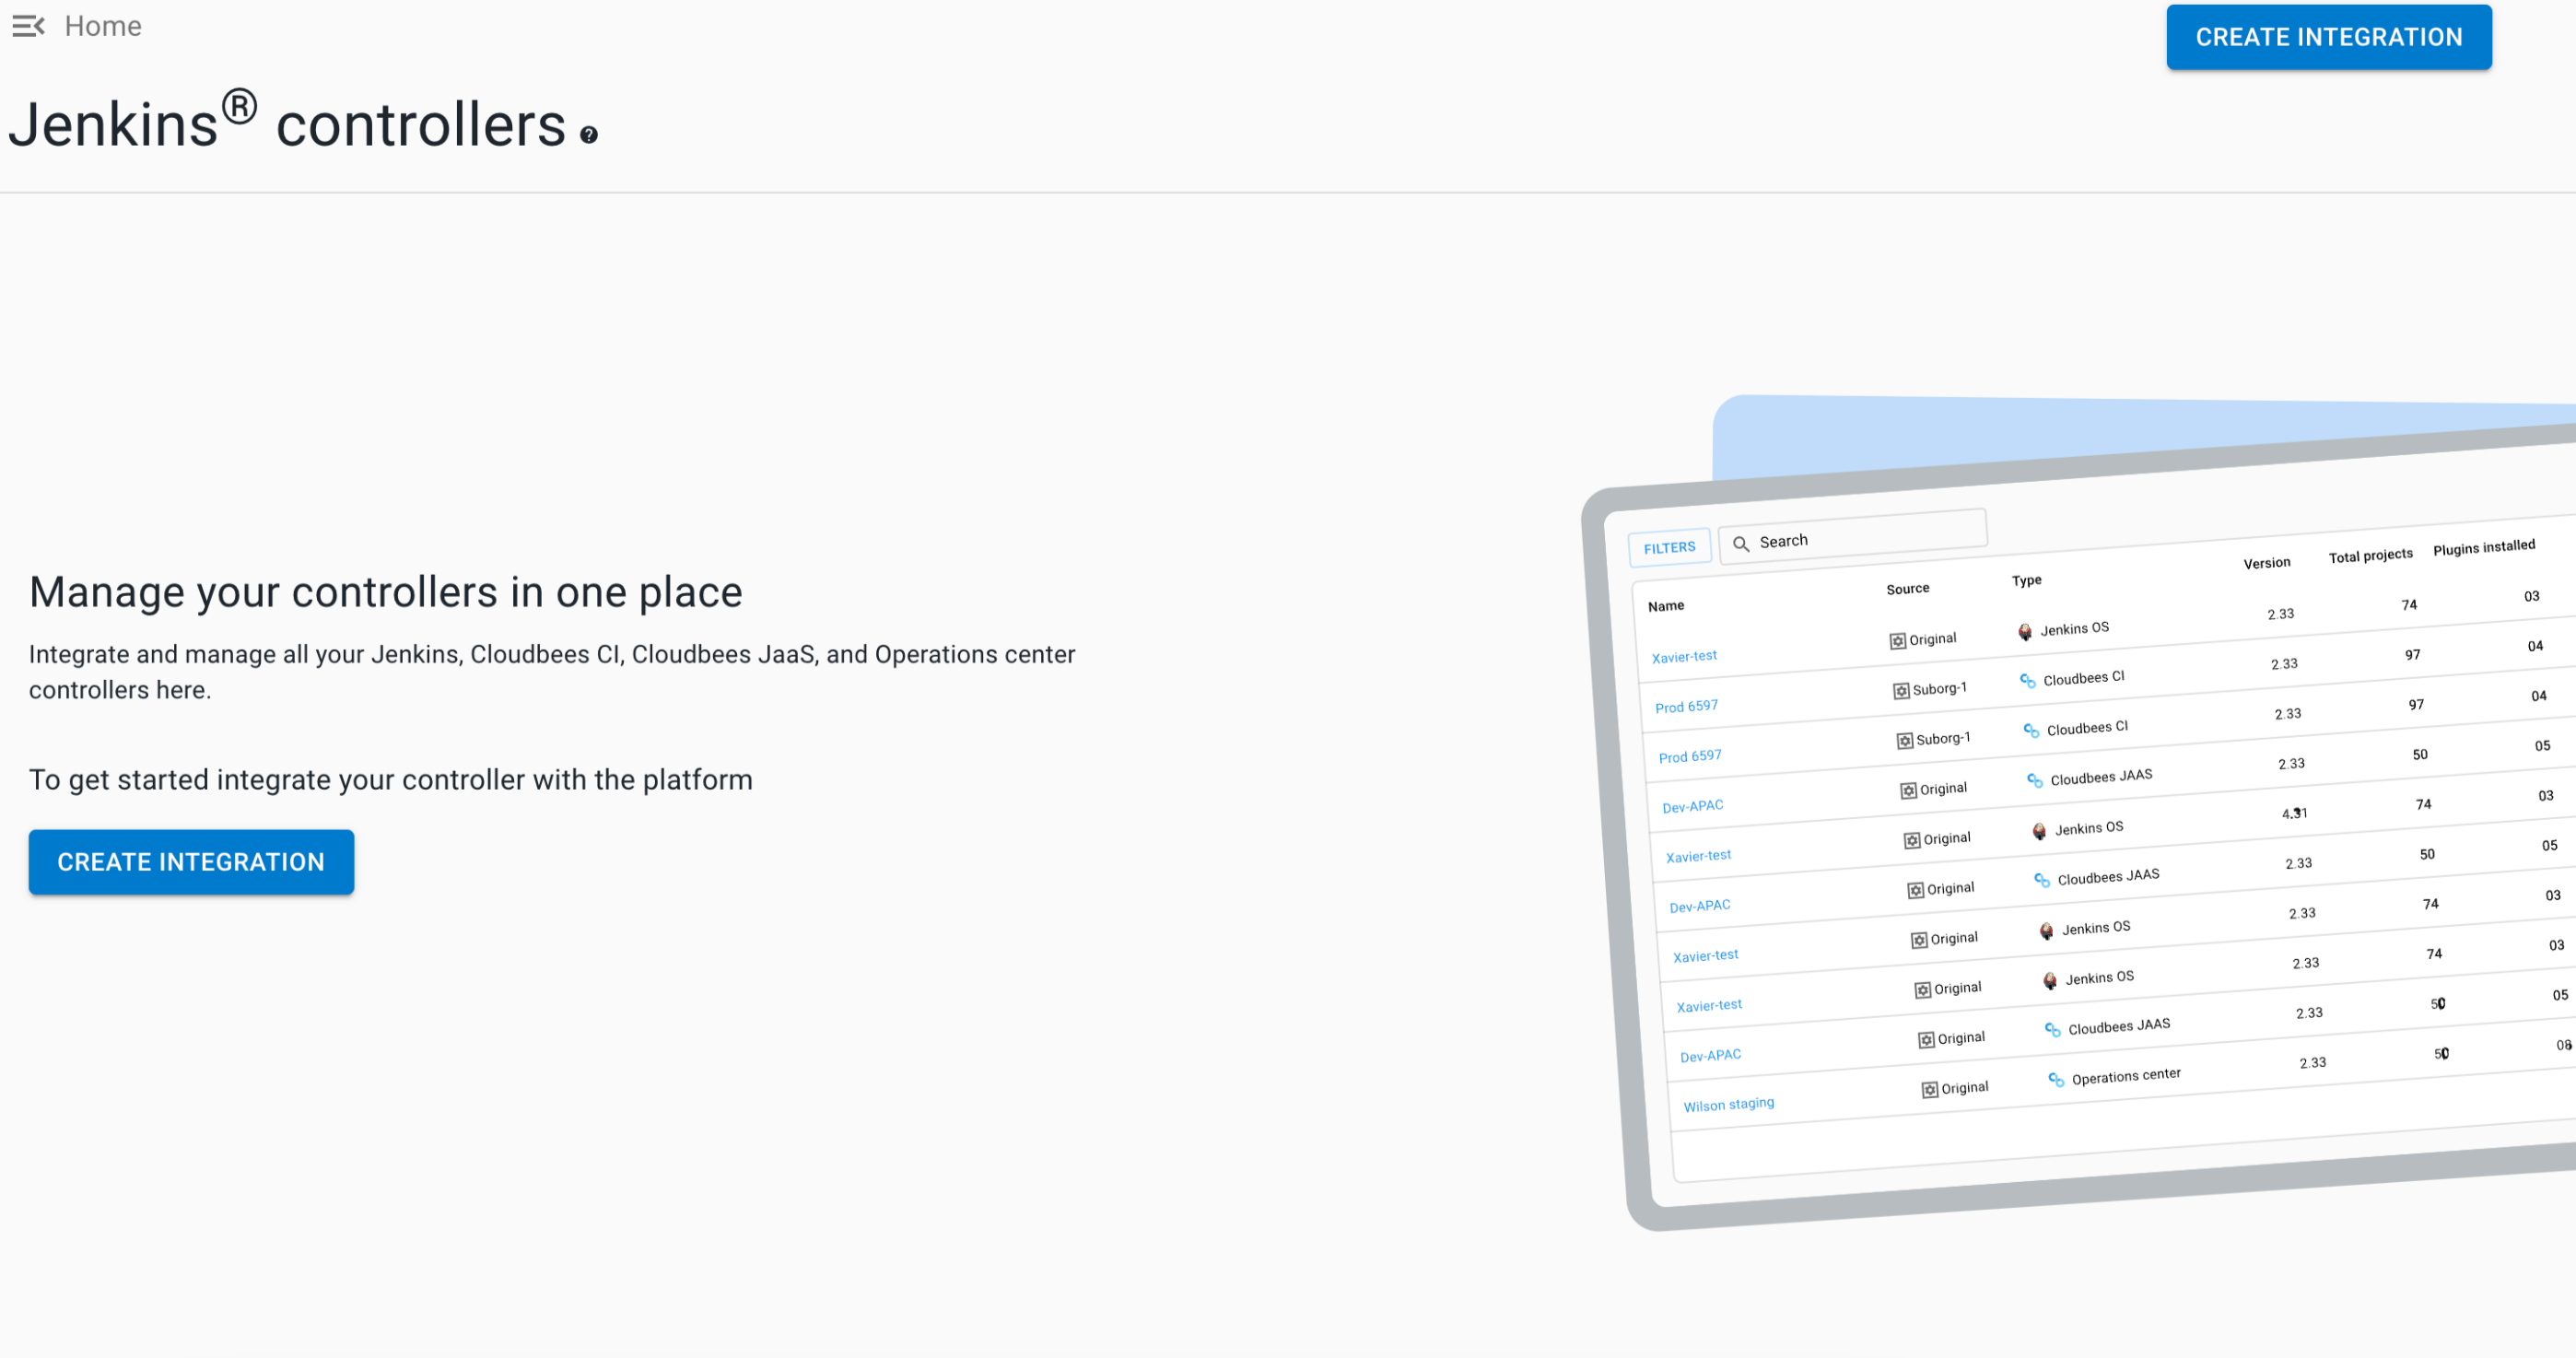 Figure 11. Jenkins controllers onboarding
Once the integration is completed, the Jenkins controller is enabled.
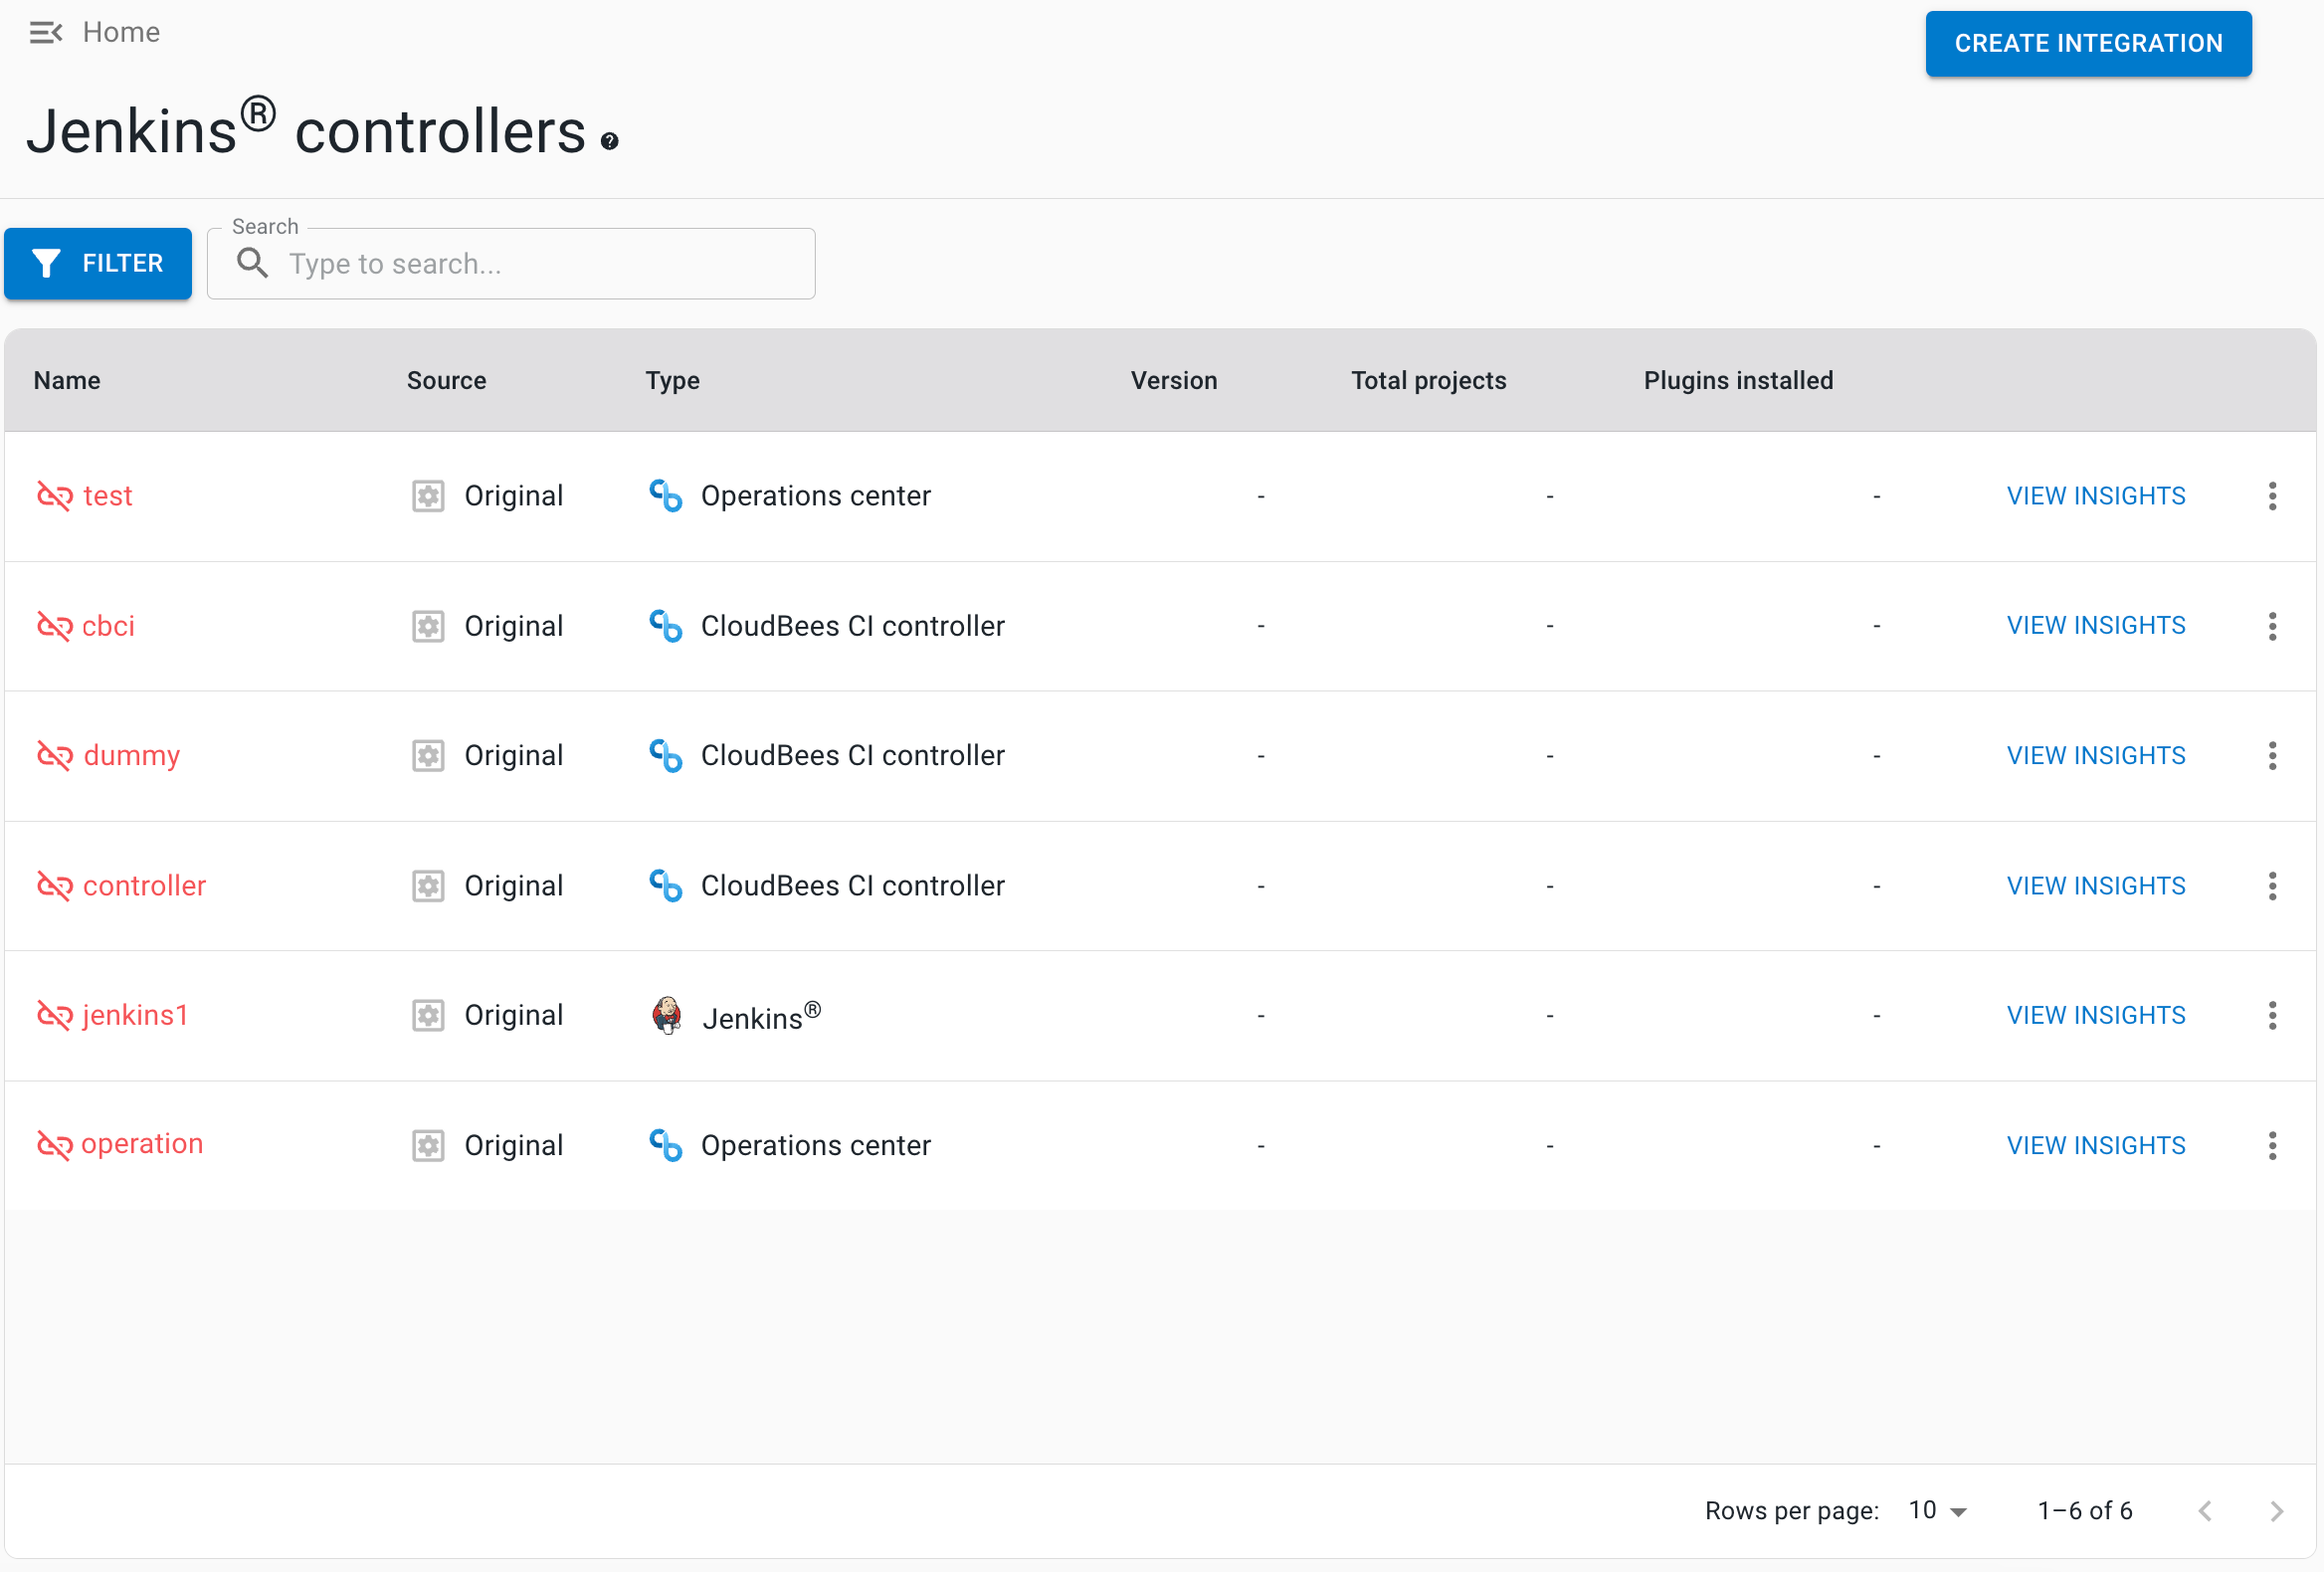 Figure 12. Jenkins controllers enabled