Flag impressions in the CloudBees platform enable you to visualize and analyze your feature flag configuration data. Every time a flag is evaluated, that evaluation is counted as an impression. There are five types of flag activity which make up the flag lifecycle. The flag lifecycle, defined based on impression data, is as follows:
| Lifecycle term | Definition |
|---|---|
Setup |
The flag exists on the platform and may include configuration settings, but it has not yet received any impressions. This is typically the status immediately after a flag is created. |
Active |
Has received impressions with different values during the selected timeframe. |
Stale |
Has received impressions during the selected time frame, bt all with the same value. |
Inactive |
No impressions received during the selected time frame. |
Permanent |
Long-lived flag that ignores impression data. This status is user-defined. |
Mark a flag as permanent
Mark a flag as permanent Edit flag settings, you can mark any flag as Permanent. When you mark a flag as Permanent, it is excluded from impression tracking and lifecycle calculations.
|
Access impression data
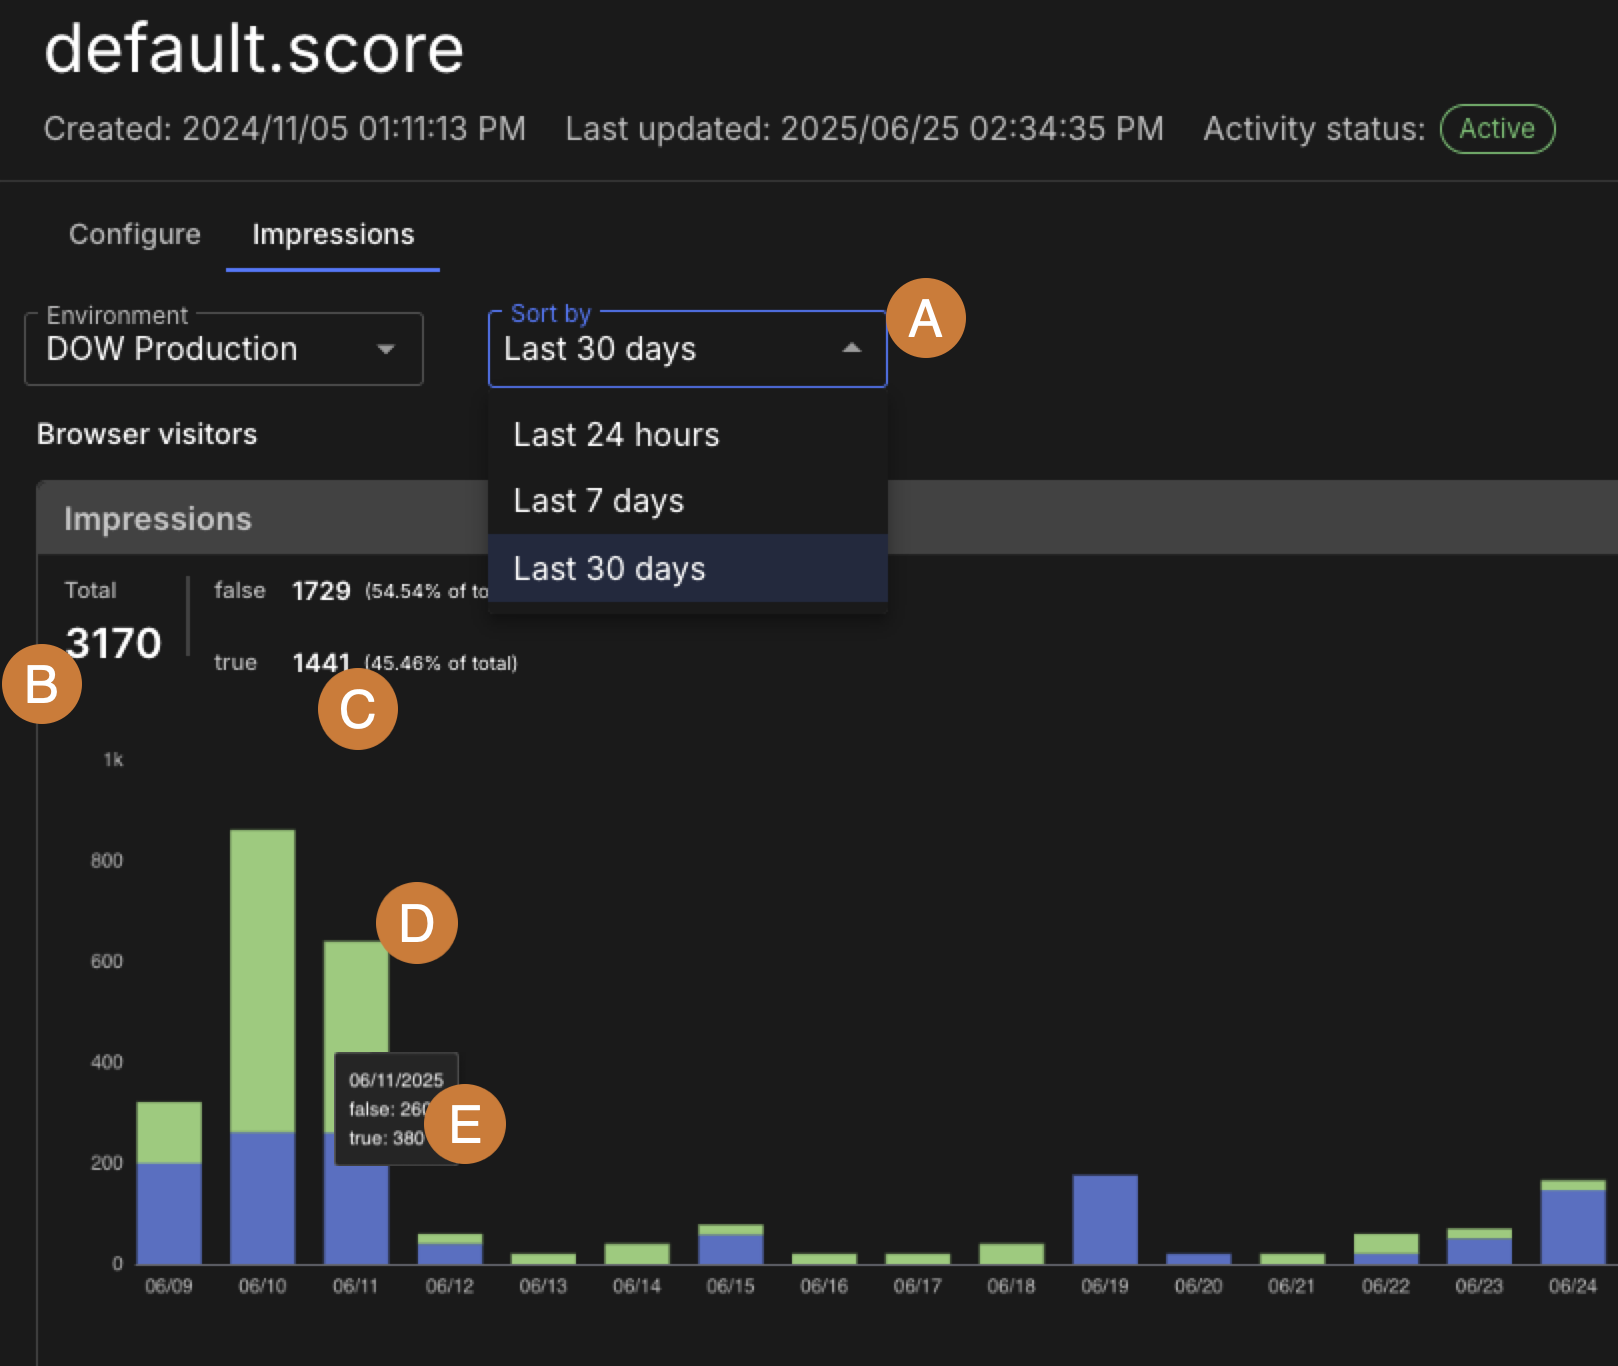
Once a configured flag is enabled, you can view impression data in the Feature management section. Each evaluation of a flag is counted as an impression, displayed as a stacked bar chart by time frame.
To access flag impressions:
-
Select Feature management from the left pane.
-
Select an Environment.
-
Select an Impressions number for a flag to open the impressions chart.
 Figure 1. An example flag list with an impression link highlighted
The impressions chart displays the number of evaluations by flag value for the selected time frame.
 Figure 2. An example flag impression chart
The chart includes the following:
-
Time frame filters: Last 24 hours, Last 7 days, or Last 30 days.
-
The total number of impressions in the selected time frame.
-
The number and percentage of impressions for each flag value.
-
A stacked bar chart where each color represents a different flag value.
-
Hover over a stacked bar to view the number of impressions for each value during that time period.
-