Incorporate continuous integration (CI) into CloudBees Unify to view your CloudBees CI and Jenkins® Multibranch Pipelines jobs and builds in Workflows and Runs for the associated component, including test results and generated artifact information.
Prerequisites
Set up CloudBees Unify and your CI controller to work together. For more information, including technical requirements and limitations, refer to Getting started.
Access the Multibranch Pipeline component
The component containing the CI Multibranch Pipeline integration is listed in the components list for your CloudBees Unify organization.
Select Components, and then select the component containing the CI integration. View the component details using the tabbed navigation.
Review Multibranch Pipeline jobs
From the CloudBees Unify component containing the CI integration, view all Multibranch Pipeline jobs.
To view the CloudBees CI or Jenkins job:
-
Select the organization and component associated with the CI job.
-
Select .
-
(Optional) Select Filters to filter by Provider:
-
CloudBees CI as Provider indicates a CloudBees CI job.
-
Jenkins as Provider indicates a Jenkins job.
-
Your connected CI Pipeline jobs are listed as part of all workflows associated with that component, and identified by Provider.
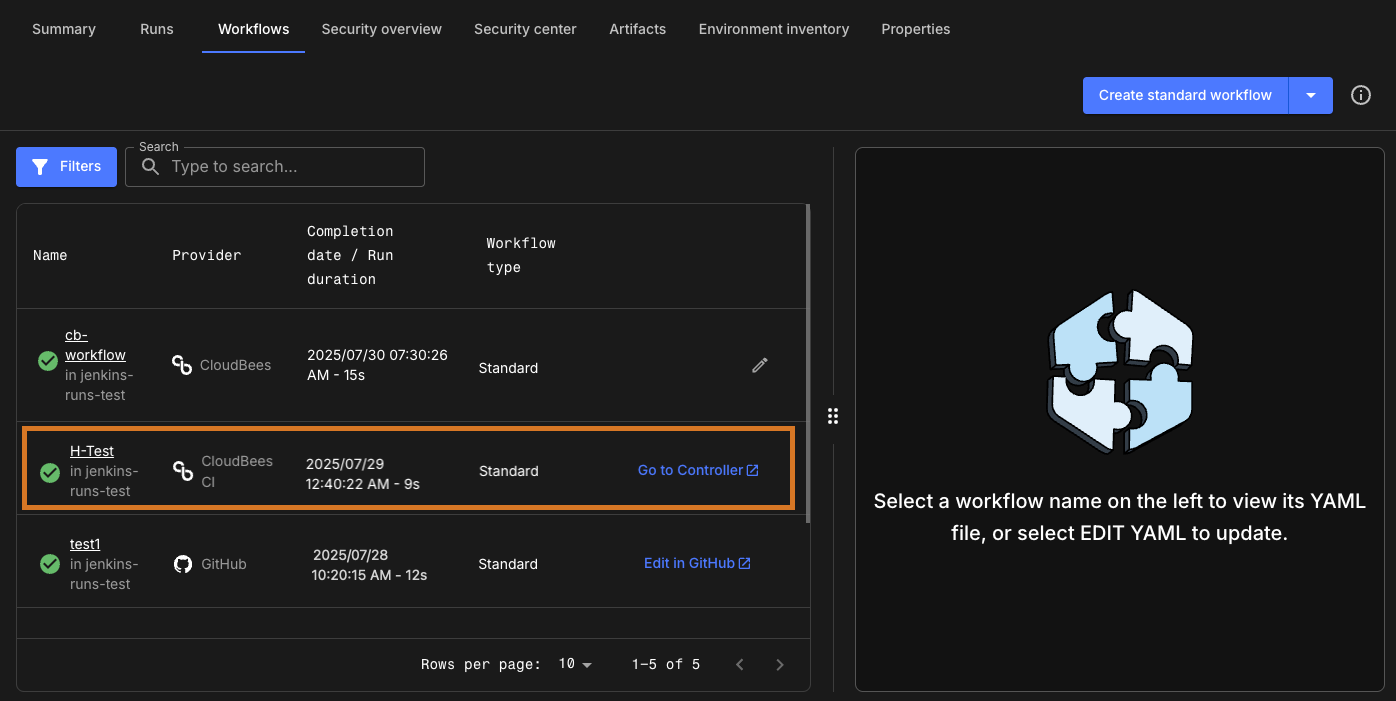
As shown in the above example:
-
The Provider is identified as CloudBees CI.
-
To view the job details, select Go to Controller.
Review Multibranch Pipeline builds
From the component containing the CI integration, view all Multibranch Pipeline builds.
To view the CloudBees CI or Jenkins build:
-
Select the organization and component associated with the CI build.
-
Select .
-
(Optional) Select Filters to filter by Provider:
-
CloudBees CI as Provider indicates a CloudBees CI build.
-
Jenkins as Provider indicates a Jenkins build.
-
Your connected CI Pipeline builds are listed as part of all runs associated with that component, and identified by Provider.
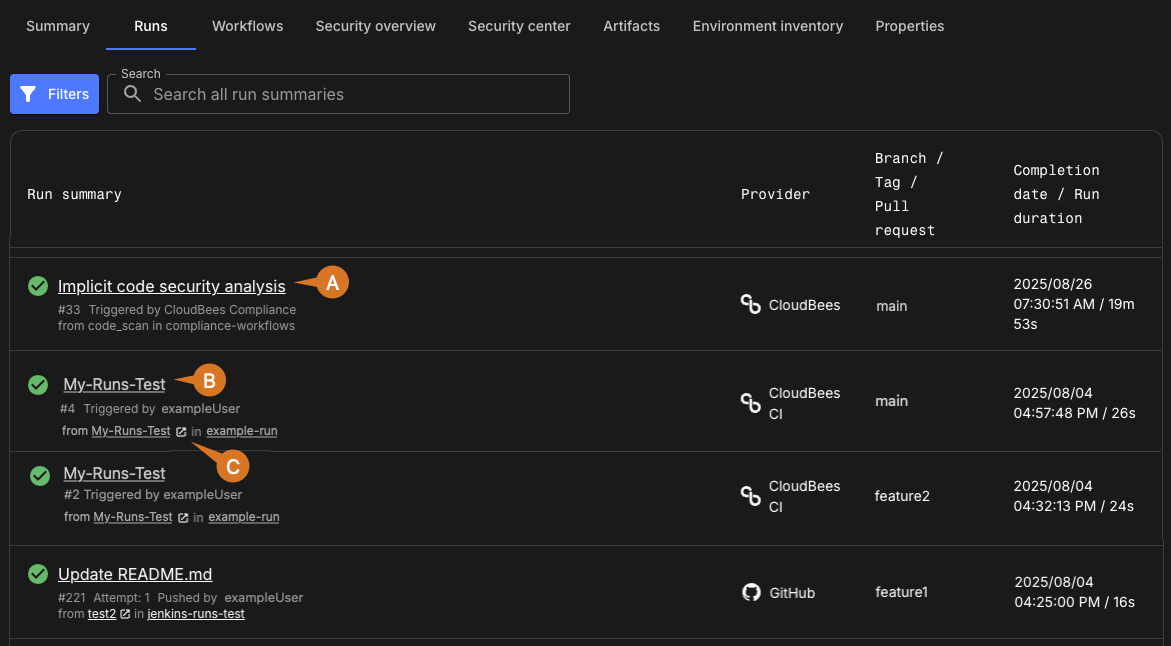
As shown in the above example:
-
After enabling implicit code security analysis, the implicit security scan is displayed in the Run summary.
To learn more about available security metrics for integrated CI jobs and builds, refer to Integrated CI analytics. -
Select the build name to view the build details in .
-
Select the external link to view the build in the controller.
Review Multibranch Pipeline build details
Access the details for your Multibranch Pipeline builds.
To view CloudBees CI or Jenkins build details:
-
Select the organization and component associated with the CI build.
-
Select .
-
Select the build name, as shown in the build figure above.
The connected CI Pipeline build details are displayed.
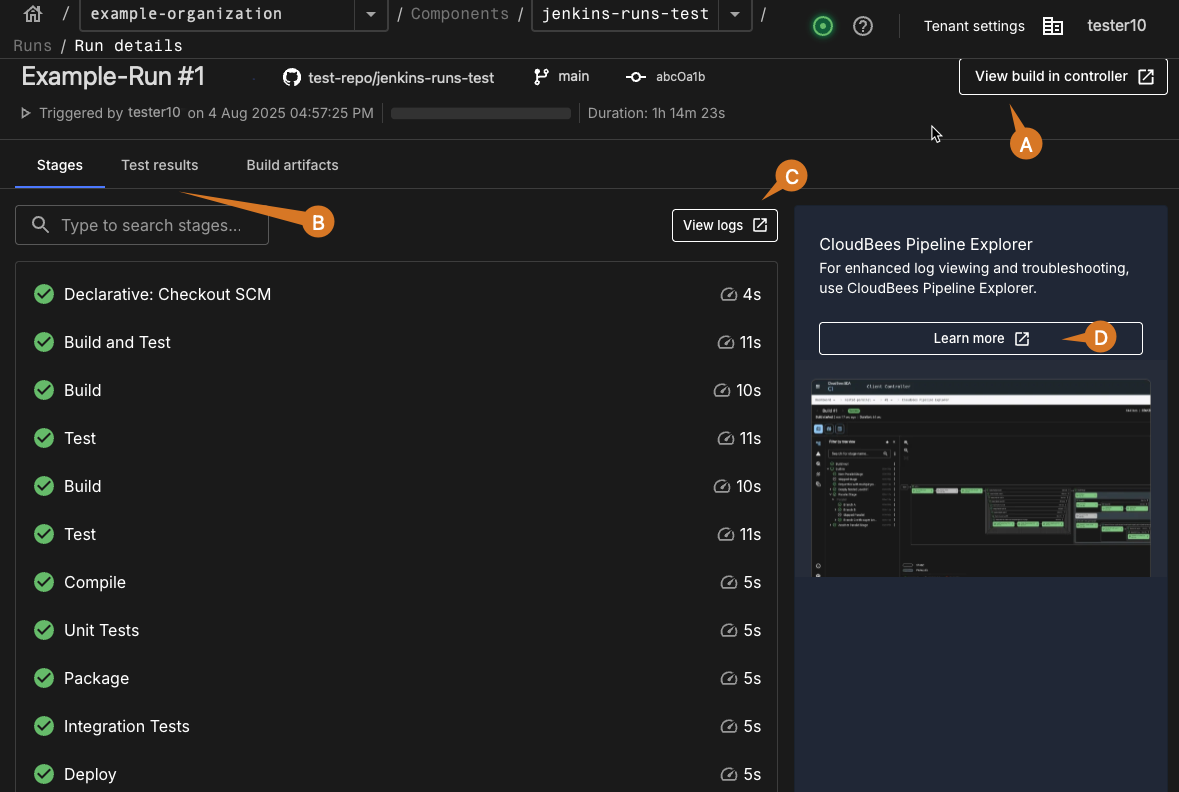
As shown in the above example:
-
Select the external link View build in controller to go to the build in the controller.
-
Select the following tabs:
-
Stages: To view a summary of the build stages.
-
Test results: To view any test results from your build.
-
Build artifacts: To view a list of generated artifacts from your build.
-
-
Select the external link View logs to go to the build logs in the controller.
-
Select Learn more go to the CloudBees Pipeline Explorer documentation. CloudBees Pipeline Explorer is a tool for enhanced log viewing and troubleshooting.
Review the component summary
The Component summary tab in Components displays a comprehensive snapshot of all activities related to your component. Display the most relevant data by filtering on a repository branch and/or a specified time frame. For more information, refer to Component summary.
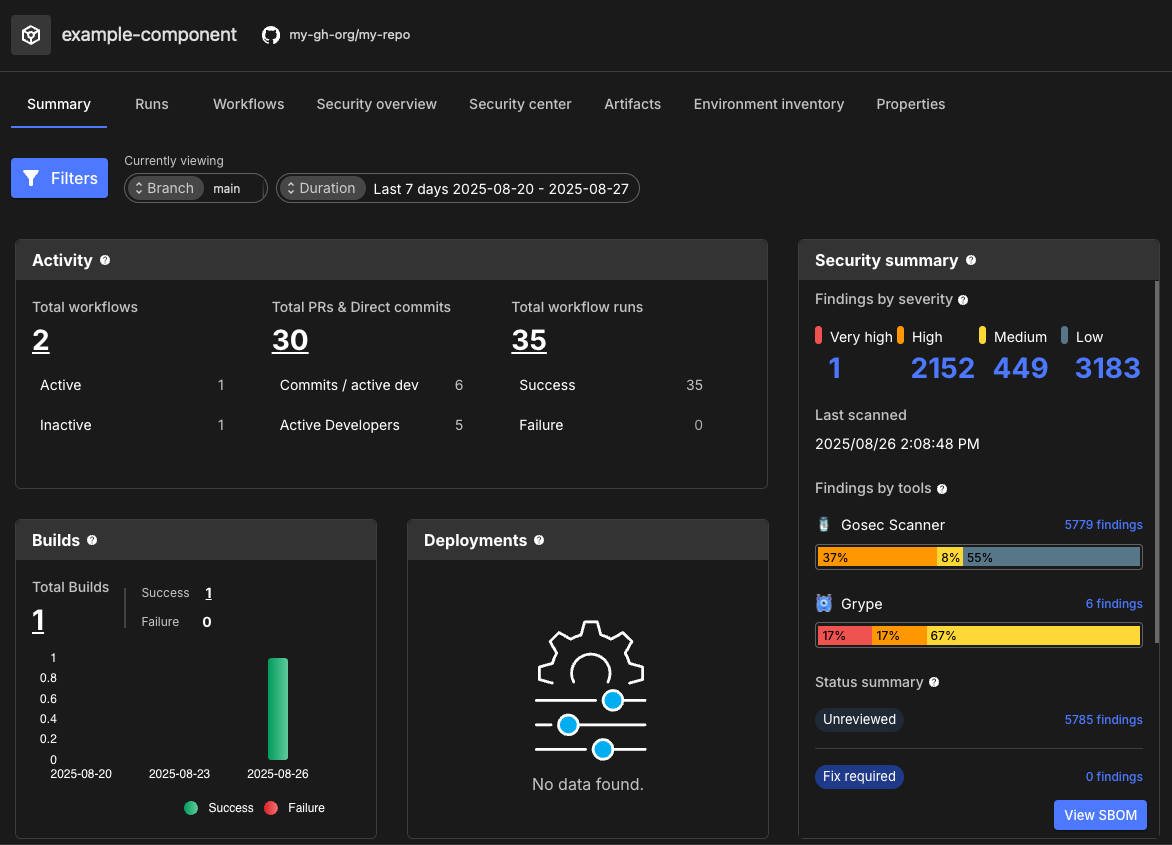
Review security issues and findings
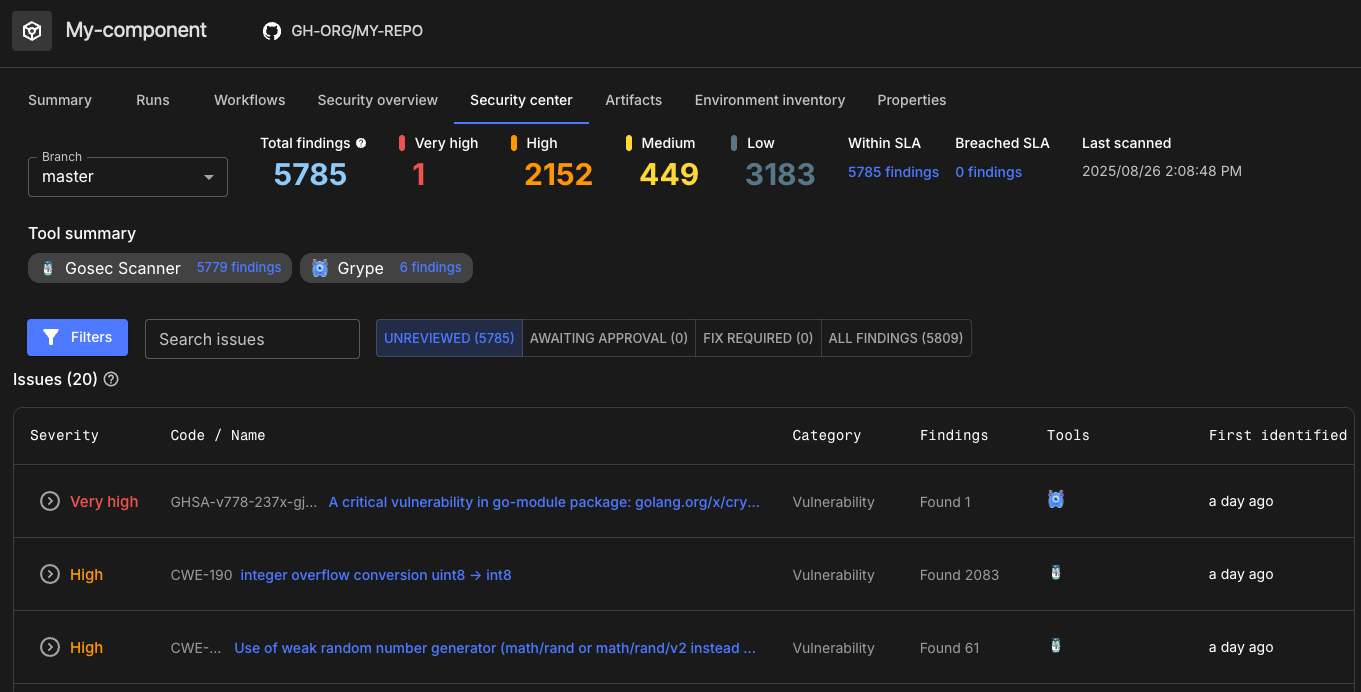
Select or to get security details for integrated CI jobs and builds.
Refer to the following for more information:
Review artifact information
If you have generated build artifacts, select for your integrated CI component to review the complete version history for each artifact. To learn more, refer to Register and view build artifacts.