The organization level security dashboard enables you to understand application security posture across the entire organization and its child organizations in a single, centralized view.
Navigate to the security dashboard
To access the security dashboard:
-
Select an organization from the organization selector.
-
Select .
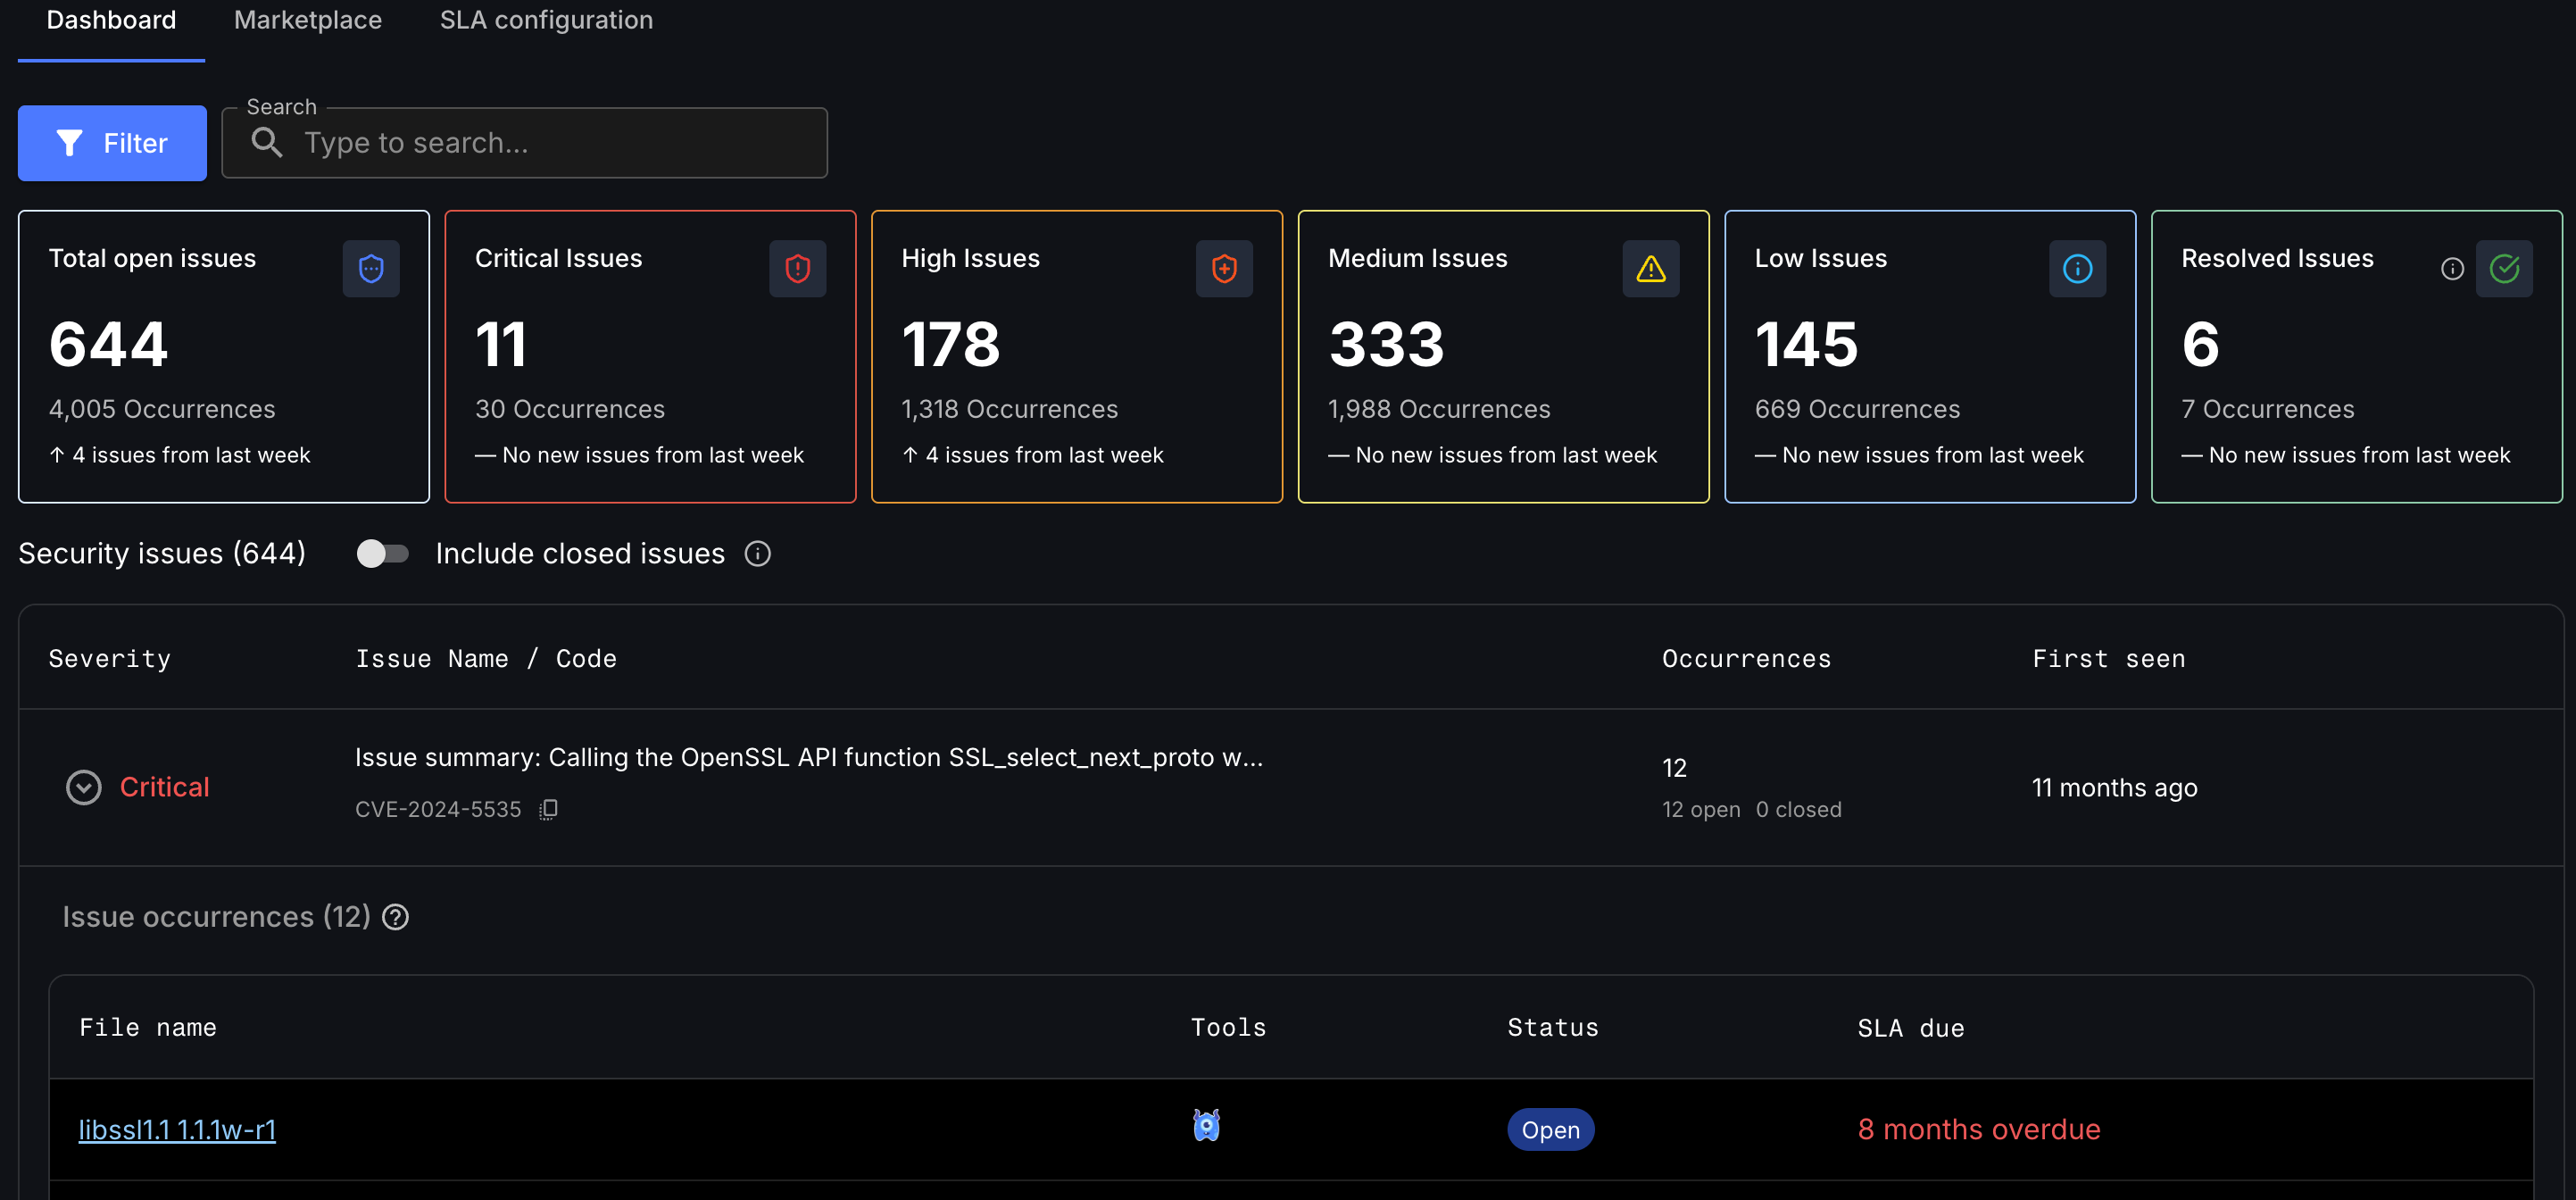
The Dashboard tab displays security issues and occurences for selected organization and all its child organizations in scope. This includes applications, components, and branches belonging to these organizations.
Use the filters to scope the dashboard to specific applications, components, or default branches. Not all available branches are displayed by default. To view other branches, select them manually. The filters dynamically update the dashboard to reflect the selected scope.
| Applications and components support multiple selections. The branch filter supports a single selection for each component, allowing you to select one branch per component. |
-
Selecting an application filters the available components and default branch associated with that application.
-
Selecting a component will show all the branches but only the default branch is selected after selecting a component.
Review dashboard filters
Use the following filters to scope the security issues and their occurrences from the most relevant and recent risk signals:
-
Severity: The risk rating reported by the security tool that discovered the issue.
-
Tools: The security tool, or tools, that reported the issue.
-
Status: The triage status of the occurrences.
-
First identified: The date range in which the issue was first identified.
You can combine multiple filters. Clear an individual filter, or reset all filters, to return to the unfiltered table.
When you change a filter, the table data gets refreshed to match the selected scope.
Review the header summary
The header summary gives you a high-level view of your organization’s security posture for the current scope. The header summary includes:
-
Open issues and open occurrences, showing the total count for the current organization and its child organizations.
-
A severity breakdown of open issues, split into Critical, High, Medium, and Low.
-
Resolved issues, showing the count of issues resolved for the current organization and its child organizations. An issue is marked as Resolved only when all its occurrences are resolved. If any occurrence remains unresolved or is in progress, the issue is not considered resolved.
Review security issues and occurrences
The dashboard displays security issues and its occurrences from multiple security tools, pipelines, and applications, giving you a trusted place to assess the overall risk and decide where to focus the remediation effort.
-
Issue Name/Code: The name or identifier of a security issue reported by a security tool.
-
Occurrences: The individual instances of a security issue reported in a branch, file, or code location.
-
Severity: The rating reported by the security tool when discovering an issue.
-
First seen: The time when the issue was first detected.
| You need the View findings by triage status permission to access the organization security dashboard. For permission details, refer to RBAC permissions reference. |
Review issue occurrence details
The Issue occurrences table lists the occurrences of an issue for the selected scope.
-
File name: The name of the issue.
-
Tool: The security tool that reported the occurrence.
-
Status: The current triage status of the occurrence. For details on each status, refer to Triage security findings.
-
SLA due: The date by which the occurrence must be resolved, based on the SLA defined for the organization. For more information, refer to Define security SLAs.
For code findings, select the occurrence to open the file in the connected source code management system. Where supported, CloudBees Unify highlights the relevant line in the file.