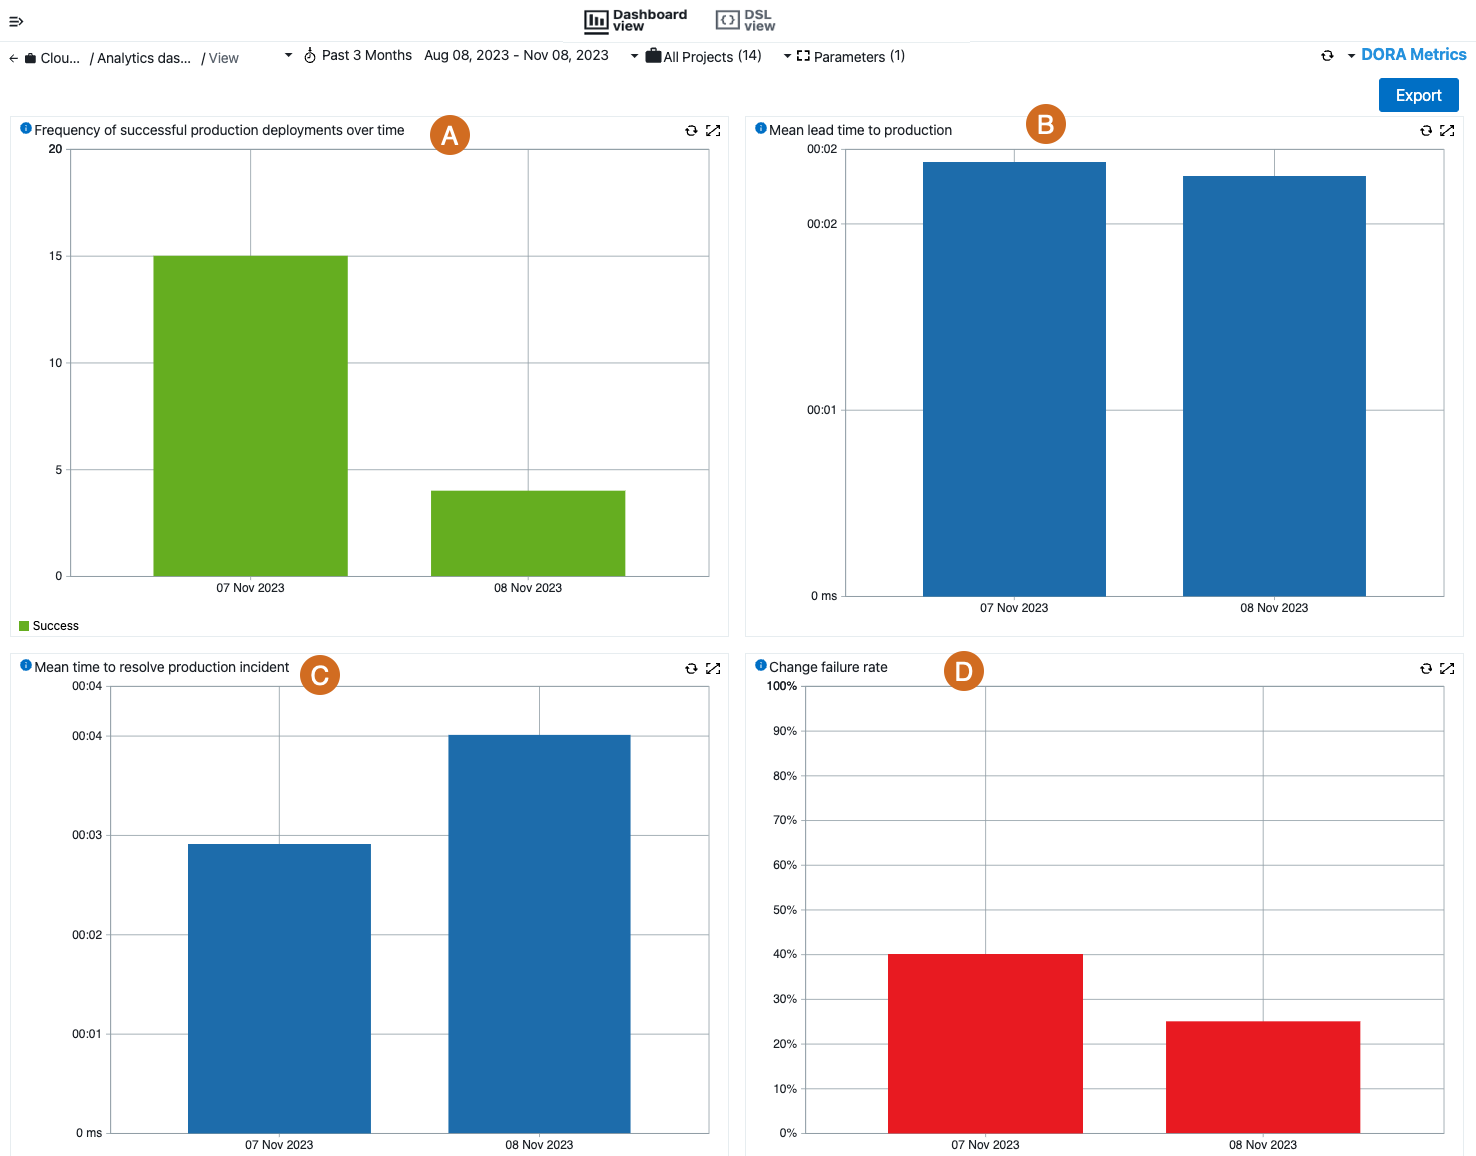
Analytics and metrics are essential tools in software delivery for providing visibility into the process and identifying improvement opportunities. DevOps Research and Assessment (DORA) metrics provide a way to compare development teams’ performance and DevOps maturity.
DORA metrics dashboard
CloudBees CD/RO includes a built-in dashboard with widgets to calculate DORA metrics.
-
Dashboard title: DORA Metrics
-
This dashboard includes widgets for: Deployment Frequency, Mean Lead Time, Mean Time to Recover, and Change Failure Rate.
-
The widgets within the dashboard calculate metrics based on these use case descriptions:

-
Deployment frequency (DF) shows how often an organization successfully releases to production. It calculates the frequency of application deployments to production environments by outcome. This information is based on the results of application deployment runs. Deployment frequency measures how many application deployments run to completion over time.
-
Mean lead time (MLT) for changes shows the average time for a commit to get into production. It calculates the average duration of pipeline runs that deliver content to production.
-
Mean time to recover (MTTR) shows how long an organization takes to recover from a failure in production. It calculates the average duration of completed pipeline runs tagged for incident remediation and includes an output parameter called SysID.
-
Change failure (CF) rate displays the percentage of deployments causing a failure in production. The change failure rate is based on the number of pipeline runs to resolve a production incident versus successful business-as-usual (non-incidents) production pipeline release pipeline runs. The output parameter SysID and an incident tag identify an incident pipeline run.
DSL example to illustrate single release
The following DSL example illustrates how to use a single release definition for both production and incident releases and will activate the DORA metrics; once this is configured, the dashboard widgets should contain data.
Follow the steps to configure the examples in this section.
-
Navigate to .
-
Copy the code below.
-
Paste the code into the IDE.
-
Select Execute
 .
.project "DORA",{ procedure "Incident handler",{ formalOutputParameter "SysID" // Required to identify pipeline run as an incident step "Set SysID output parameter", /* Command assumes "incidentId" parameter exists in the release pipeline definition. Command sets the output parameter SysID to the pipeline incidentId input parameter value */ command: 'ectool setOutputParameter "SysID" "$[/myPipelineRuntime/incidentId]" ' } release "Production and Incident",{ tag "production_release" // This will tag the release and any pipeline runs from it pipeline releaseName,{ formalParameter "incidentId" stage "Production",{ task "If Incident", taskType: 'PROCEDURE', condition: '$[incidentId]', subproject: projectName, subprocedure: "Incident handler" task "Deploy", command: 'echo deploying to production', subTaskType: 'DEPLOY', applicationProjectName: projectName, applicationName: 'Sample Application', environmentProjectName: projectName, environmentName: 'Production', applicationVersion: '1.0', artifacts: 'comp:1.1.0' } } } tagObject tag: "PROD", environmentName: 'Production' } -
The result should look similar to:
 Figure 2. Success
{ "project":{ "projectId":"d974e22e-7d9c-11ee-9422-42010a1ebfd5", "projectName":"DORA", "createTime":"2023-11-07T18:38:30.897Z", "lastModifiedBy":"email@cloudbees.com", "modifyTime":"2023-11-07T19:40:35.783Z", "owner":"email@cloudbees.com", "processCount":"0", "propertySheetId":"d974e230-7d9c-11ee-9422-42010a1ebfd5", "stageCount":"0", "tracked":"1" } } -
Continue the process to configure the DORA Metrics dashboard.
Use case examples for setting up CloudBees CD/RO to calculate DORA metrics
Use the following examples to set up CloudBees CD/RO to calculate DORA metrics for each of the four built-in widgets.
-
Production deployment frequency.
-
Create an environment in CloudBees CD/RO and add a production tag value, for example,
PROD. -
Create an application in CloudBees CD/RO and map it to run on a
PRODtagged environment. -
Run the application.
-
Navigate to the DORA Metrics dashboard in .
-
Select the DORA Metrics dashboard.
-
Locate the parameters input field on the dashboard.
 Figure 3. DORA parameters
 -
Enter
PRODinto the Production tags: parameter field to get the number of deployments grouped by date. -
Select Apply.
-
-
Mean lead time.
-
Create or locate a release in CloudBees CD/RO.
-
Add a Tag to the release with a specific value, for example,
production_release. -
Run the production release.
-
Navigate to the DORA Metrics dashboard in .
-
Locate the parameters input field.
-
Enter
production_releaseto the Production tags: parameter field to get the average pipeline run duration grouped by date. -
Select Apply.
-
-
Mean time to recovery and Change failure rate.
-
Create or locate a release in CloudBees CD/RO.
-
Add a Tag to the release with a specific value, for example,
production_releaseorincident_release. This value will match a tag on the MTTR and CF widgets. -
Add an input parameter to the release. For this example, add an input pipeline parameter called
incidentID. The value of this pipeline parameter can then be used by a task procedure to set the required SysID output parameter value, where the run condition for the task is based on whether theincidentIdvalue is set.The ServiceNow plugin procedure GetRecords_NextGenincludes the SysID output parameter. If ServiceNow is not to be used, create your own procedure that sets this output parameter. -
Run the release pipeline and enter an incident ID value.
-
Navigate to the DORA Metrics dashboard in .
-
Locate the parameters input field on the dashboard.
-
Enter
incident_releaseorproduction_releaseto the Production tags: parameter field depending on whether the release is intended for incident release or both production and incident releases. -
Select Apply.
-
Run the release one or more times without setting the incident ID.
-
Run the release again with the incident ID set to a non-empty value.
-
Return to the DORA Metrics dashboard, to view the results.
-
Export dashboard results
CloudBees CD/RO dashboards can be exported as PDFs. For more information, refer to Export dashboards to PDF.
| If you need more refined results, you can also Create a report and Export reports results. |