The Release Command Center dashboard, part of CloudBees Analytics, offers a comprehensive overview of a product or release throughout all phases. It integrates high-level metrics from initial planning stages using tools like Jira or Rally—for grooming the backlog and targeting stories and tasks—through to release planning, continuous integration, and deployments across various environments. The dashboard aggregates data from CloudBees CD/RO and external tools, showcasing metrics for both application-wide and independent microservice deployments, excluding intra-application microservice metrics.
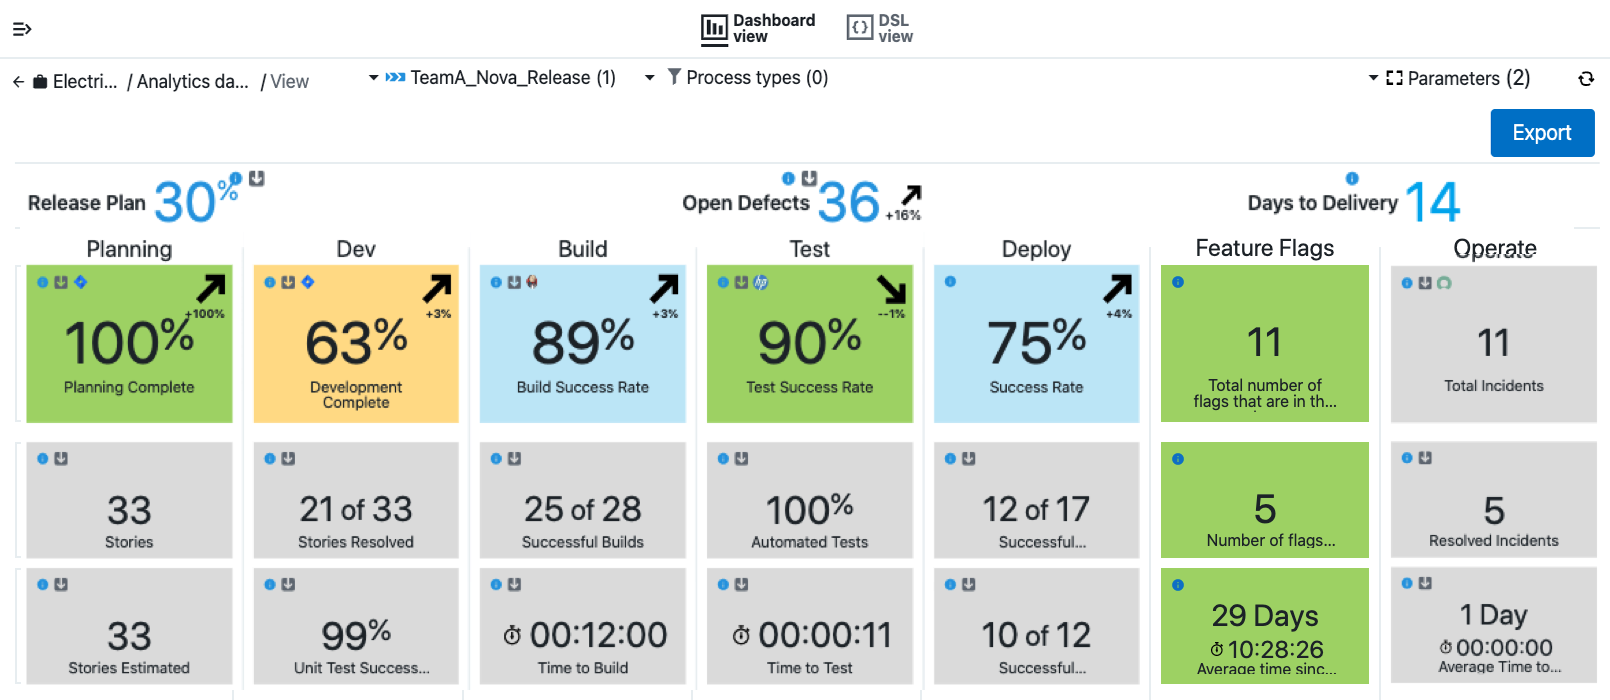
This example of the Release Command Center dashboard shows a release currently in progress without major issues.

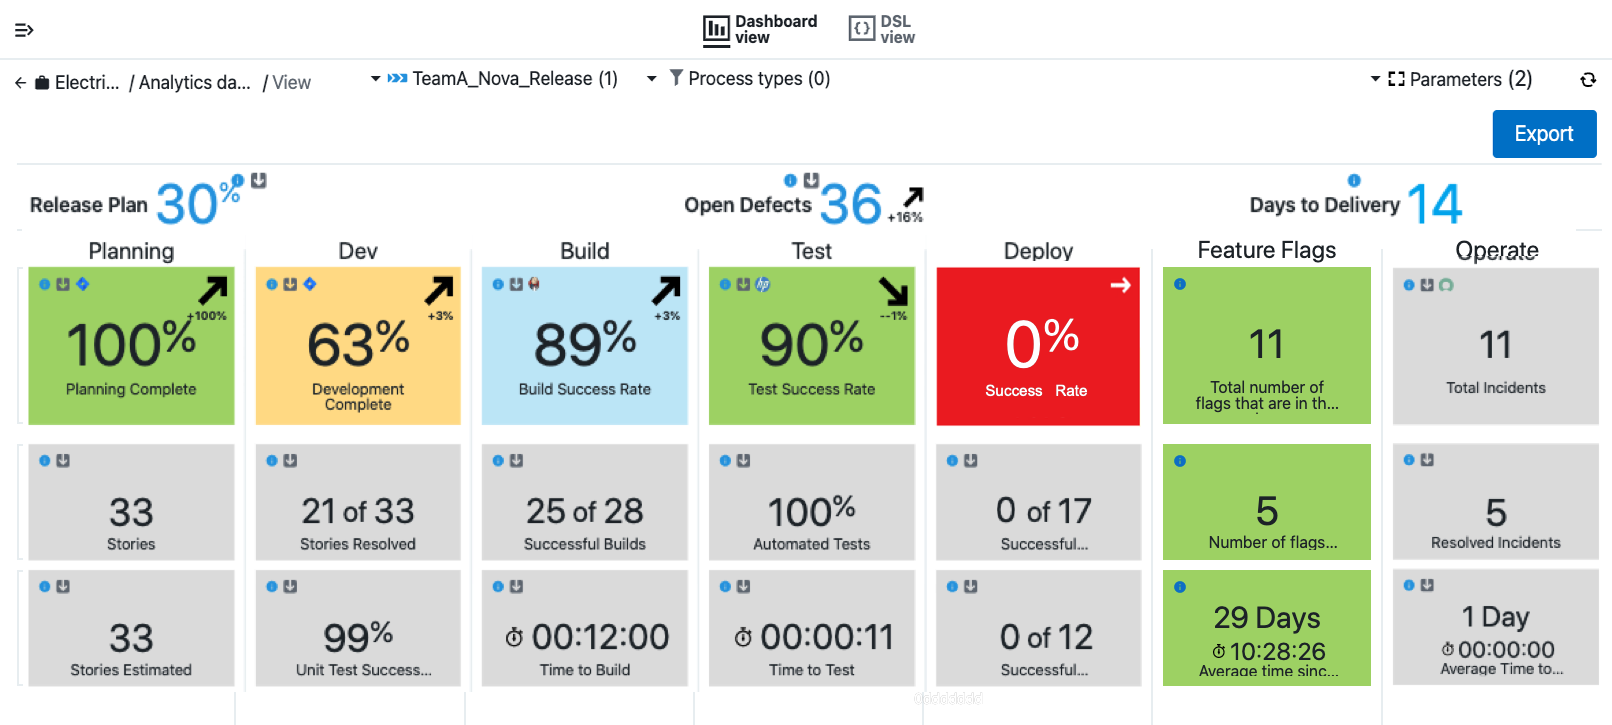
This example of the Release Command Center dashboard illustrates a release in progress that is experiencing deployment issues. Notably, the Deploy cell is colored red, signaling an excessive number of deployment failures over the last 10 days, which impedes satisfactory release progression.

Filters
The Release Command Center dashboard provides several filters to customize the view:

1 |
Select the desired release for which data is presented. |
2 |
(Optional) Select the application process to filter the results. |
3 |
Select the arrow to apply additional parameters to refine the data. |
4 |
Time Slice is the number of days relative to the Show as of date used to calculate the relative date range for reporting the release metrics. The default is 10 days. The Show as of date is the beginning date for which metrics are shown. |
Metrics

-
Release Plan Metric
This metric displays the percentage of release stories that are complete. The percentage is calculated using the latest feature data associated with the release for type
story. Records with statusclosedare considered to be completed. This metric includes a trend indicator arrow, which shows the general direction of an already-formed trend. This metric uses the underlying Release Plan Completed widget. -
Open Defects Metric
This metric displays the number of open defects for the release. The open defects are calculated using the latest defect data associated with the release. Records with a resolution that is either not set or empty are considered as open. This metric also includes a trend indicator arrow, which shows the general direction of an already-formed trend. This metric uses the underlying Open Defects In Release widget.
-
Days to Delivery Metric
This metric displays the number of days remaining in the release. This metric uses the underlying Days Remaining in the Release widget.
Columns and Cells
Each column displays a particular category of metrics. This lets you estimate the work in terms of story points or time all the way through deploying and running in production. Data is presented at the following levels:
-
Column (such as Dev, Build, or Test)
-
Column level summary (measures in upward or downward trends)
-
Column level details
The color thresholds are defined for the column summary widgets for the Planning, Dev, Build, Test, and Deploy columns. By default, the thresholds are the same based on the percentage value displayed for their corresponding widgets:
-
Less than 50%: Red
-
Between 50 and 75%: Yellow
-
Between 75 and 90%: Blue
-
90% or greater: Green
-
Below is a list of each column with a description of each cell in that column.
Drilling down into columns
Drill-down lets you take a closer look at the data in the Release Command Center dashboard. You can drill down by selecting widgets in each of the columns.
Depending on the widget, drill-down takes you to the source of the displayed metrics, which can either be CloudBees CD/RO or an external system, such as Jira or ServiceNow. Drill-down details are provided below.
Planning phase
| Widget | Description |
|---|---|
Percentage Of Stories With Story Points |
Percentage of release stories that have story points assigned. This metric includes a trend indicator arrow, which shows the general direction of an already-formed trend. |
Total Stories |
Total count of release stories. |
Estimated Stories |
Total count of release stories with story points. |
The planning phase metrics are collected from systems such as Jira or Rally. Pre-configured support for collecting data for CloudBees Analytics to visualize through the Release Command Center is provided for Jira software using the EC-Jira plugin. Selecting any cell (widget) in this column where the data for the metrics to display came from Jira opens Jira.
Dev column
| Widget | Description |
|---|---|
Percentage Of Dev Complete Stories |
Percentage of release stories that have exited development. |
Dev Completed or Resolved Stories |
Percentage of release stories that are development complete. |
Unit Test Success Rate |
Percentage of successful unit tests out of the total unit tests run through CI builds for the release in the selected date range (the last 10 days by default). |
The Dev column metrics are collected from systems such a Jira or Rally. Pre-configured support for collecting data for CloudBees Analytics to visualize through the Release Command Center is provided for Jira software using the EC-Jira plugin.
Build column
| Widget | Description |
|---|---|
Build Success Rate |
Percentage of successful builds out of the total builds for the release in the selected date range (the last 10 days by default). This metric includes a trend indicator arrow, which shows the general direction of an already-formed trend. |
Total Successful Builds |
Number of successful builds out of the total builds for the release in the selected date range (the last 10 days by default). |
Average Build Duration |
Average time taken by builds associated with the current release to complete in the selected date range (the last 10 days by default). |
The Build column metrics are collected from systems such as Jenkins. Pre-configured support for collecting data for CloudBees Analytics to visualize through the Release Command Center is provided for Jenkins using the EC-Jenkins plugin.
Test column
| Widget | Description |
|---|---|
System Test Success Rate |
Percentage of successful tests out of the total tests that were run for the release in the selected date range (the last 10 days by default). This metric includes a trend indicator arrow, which shows the general direction of an already-formed trend. |
System Test Automation Percentage |
Percentage of automated tests out of total tests that ran for the release. |
Average System Test Duration |
Average test duration in the selected date range (the last 10 days by default). |
Drill-down in the Test column collects data from a plugin such as EC-ALM. Selecting any cell in this column opens HP ALM in a browser window, from which you can drill down for more information.
Deploy column
| Widget | Description |
|---|---|
Success Rate |
Deployment success rate in the selected date range (the last 10 days by default). |
Successful Application Deployments |
Number of successful application deployments out of the total completed deployments in the selected date range (the last 10 days by default). |
Successful Microservice Deployments |
Number of successful microservice deployments out of the total completed deployments in the selected date range (the last 10 days by default). |
Average Time to Deploy |
Average deployment duration in the selected date range (the last 10 days by default). |
Selecting to drill down into Successful Application Deployments opens the Application Deployments page, which shows application deployments for the selected release.
Following is an example of the Application Deployments page when opened from the Release Command Center:

This is a page that is filtered by all deployments for the selected application. You can filter the list of deployments according to status by using the filter buttons at the top of the page.
Following are the available filters:
|
All deployments |
|
Running deployments (gray highlighting) |
|
Successful deployments (green highlighting) |
|
Deployments that stopped because of one or more errors (red highlighting) |
|
Deployments that finished with one or more warnings (yellow highlighting) |
|
Aborted deployments |
|
Manual deployments |
|
Rollback deployments |
For example, you can view only the successful deployments by selecting the ![]() icon:
icon:
To view the details of a deployment, select the deployment to open the Applications / View Run page. For more information, refer to Model and deploy traditional applications.
Selecting to drill down into Successful Microservice Deployments opens the Microservice Deployments page, which shows independent (project-level) microservice deployments for the selected release. Note that you can also open the Microservice Deployments page by selecting from the Home menu.
The filter buttons for microservice deployments work in a manner similar to the filter buttons for application deployments as described above.
Feature Flags column
| You must have a CloudBees Feature Management license to source feature flag data. Refer to About feature flags for further information about CloudBees Feature Management. |
The Feature Flags column shows metrics associated with feature flags configured for the current release. The EC-FeatureFlags plugin sources data from CloudBees Feature Management, which in turn supplies data to widgets in this column. You configure the desired set of feature flags for your CloudBees CD/RO release from CloudBees Feature Management.
| Widget | Description |
|---|---|
Total number of flags that are in this release |
The number of updated flags based on the Show as of date and the Time Slice parameter. |
Number of flags with targeting enabled |
Number of flags with targeting enabled, updated during the time period, based on the Show as of date and the Time Slice parameter. |
Average time slice flag creation |
Average time since flag creation, updated during the time period, based on the Show as of date and the Time Slice parameter. |
Operate column
The Operate column shows incident metrics associated with the deployed release (post-production). This column collects data periodically from incident management system such as ServiceNow. Refer to Release Command Center data source setup for details on setting up data sources to collect data from systems such as ServiceNow for the Release Command Center.
| Widget | Description |
|---|---|
Total Incidents |
Total number of incidents opened against the release. |
Resolved Incidents |
Number of resolved incidents out of total incidents for the release. |
Average Resolution Time |
Average time to resolve an incident for the release. |
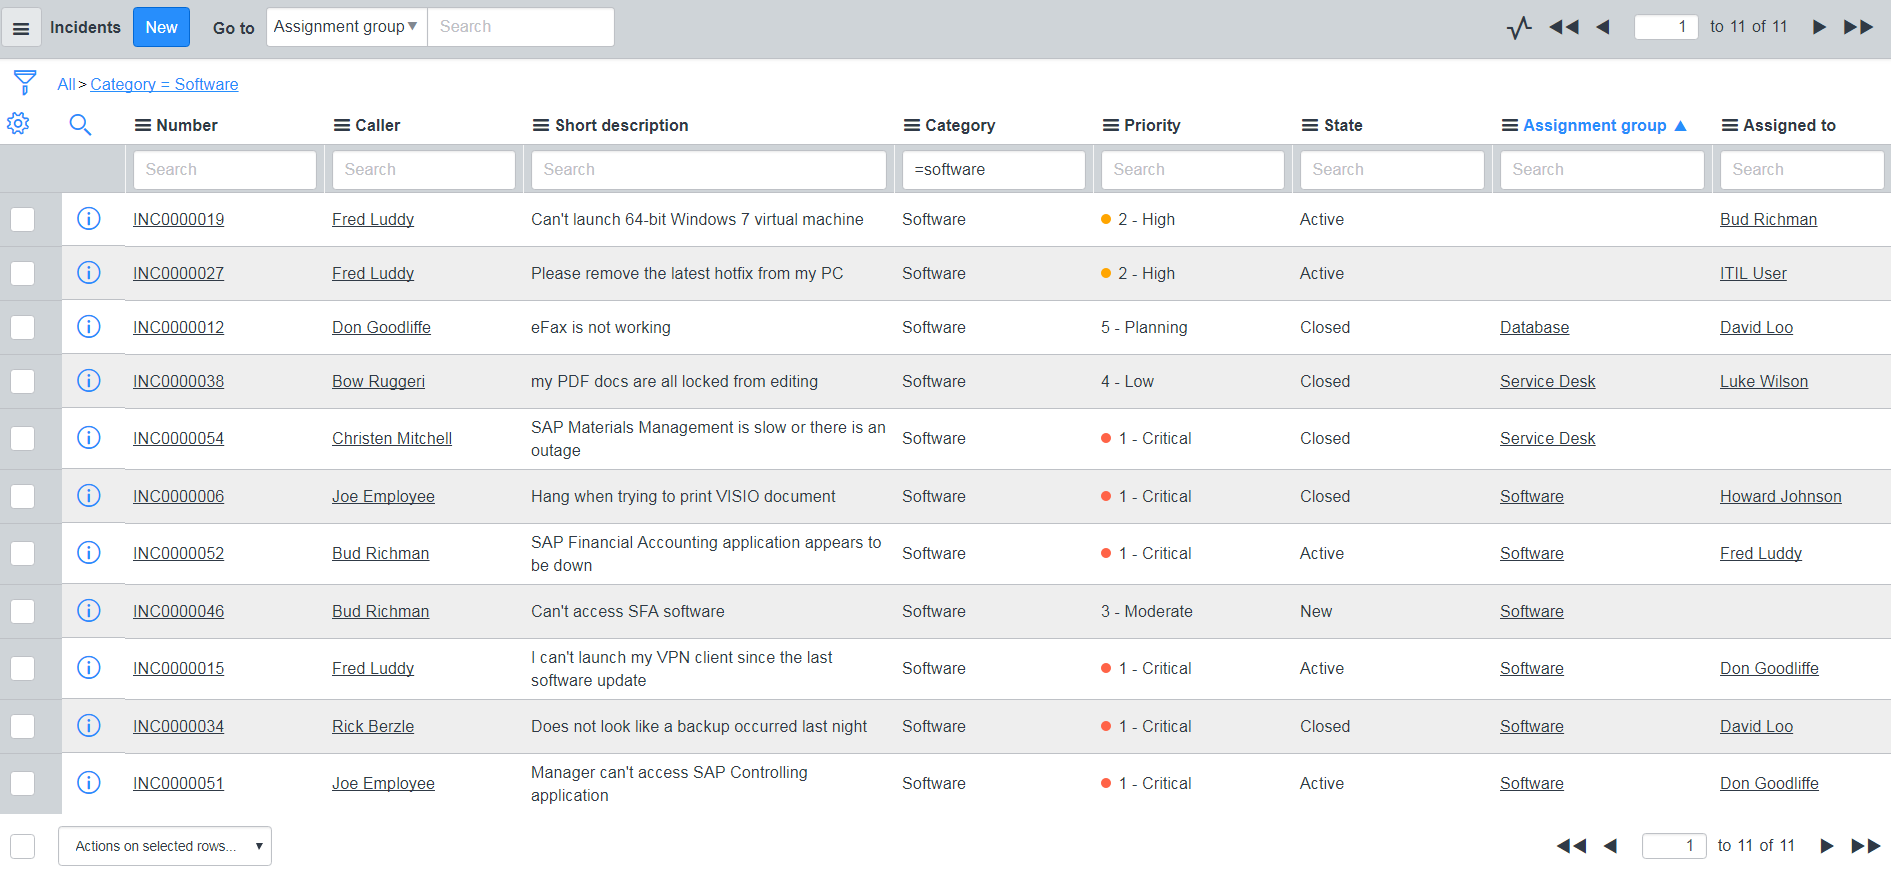
You can drill down into the data in this column. Selecting the Total Incidents cell opens a ServiceNow page that lists all incidents associated with the release. For example:

Selecting the Resolved Incidents cell or the Average Time to Resolve cell in this column opens a ServiceNow page that lists all resolved incidents associated with the release. For example:

Accessing the Release Command Center dashboard
You can access the Release Command Center dashboard using one of these methods:
-
Through CloudBees Analytics:
-
From the main menu, select . The dashboard list displays.
-
Select Release Command Center from the dashboard list. The Release Command Center dashboard opens displaying data for the selected release.
-
-
Through the Release view:
-
From the main menu, select .
-
On the Release screen, select a release.
-
Select Command center at the top of the screen. The Release Command Center dashboard opens for the selected release.
-
Changing the effective date and relative date range
By default, the Release Command Center dashboard displays the release metrics as of the current day and uses a date range (a time slice) of the last 10 days.
You can change the Show as of date to compare a 10-days-ago snapshot of the dashboard with a 20-days-ago snapshot to analyze the progression of the release.
-
Set a 14-day time slice to view the information for an entire two-week sprint.
-
Compare a currently-running release to the last release that was completed a month ago.
Changing the effective dates
-
To change the Show as of parameter, select Show as of and choose a new date from the calendar that displays.
-
To change the time slice parameter, select the Choose parameters button and enter a positive integer for the number of days to use as the time slice in the dialog that appears.
To learn more about Release Command Center data sources, refer to Release Command Center data source setup.
Export dashboard results
CloudBees CD/RO dashboards can be exported as PDFs. For more information, refer to Export dashboards to PDF.
| If you need more refined results, you can also Create a report and Export reports results. |