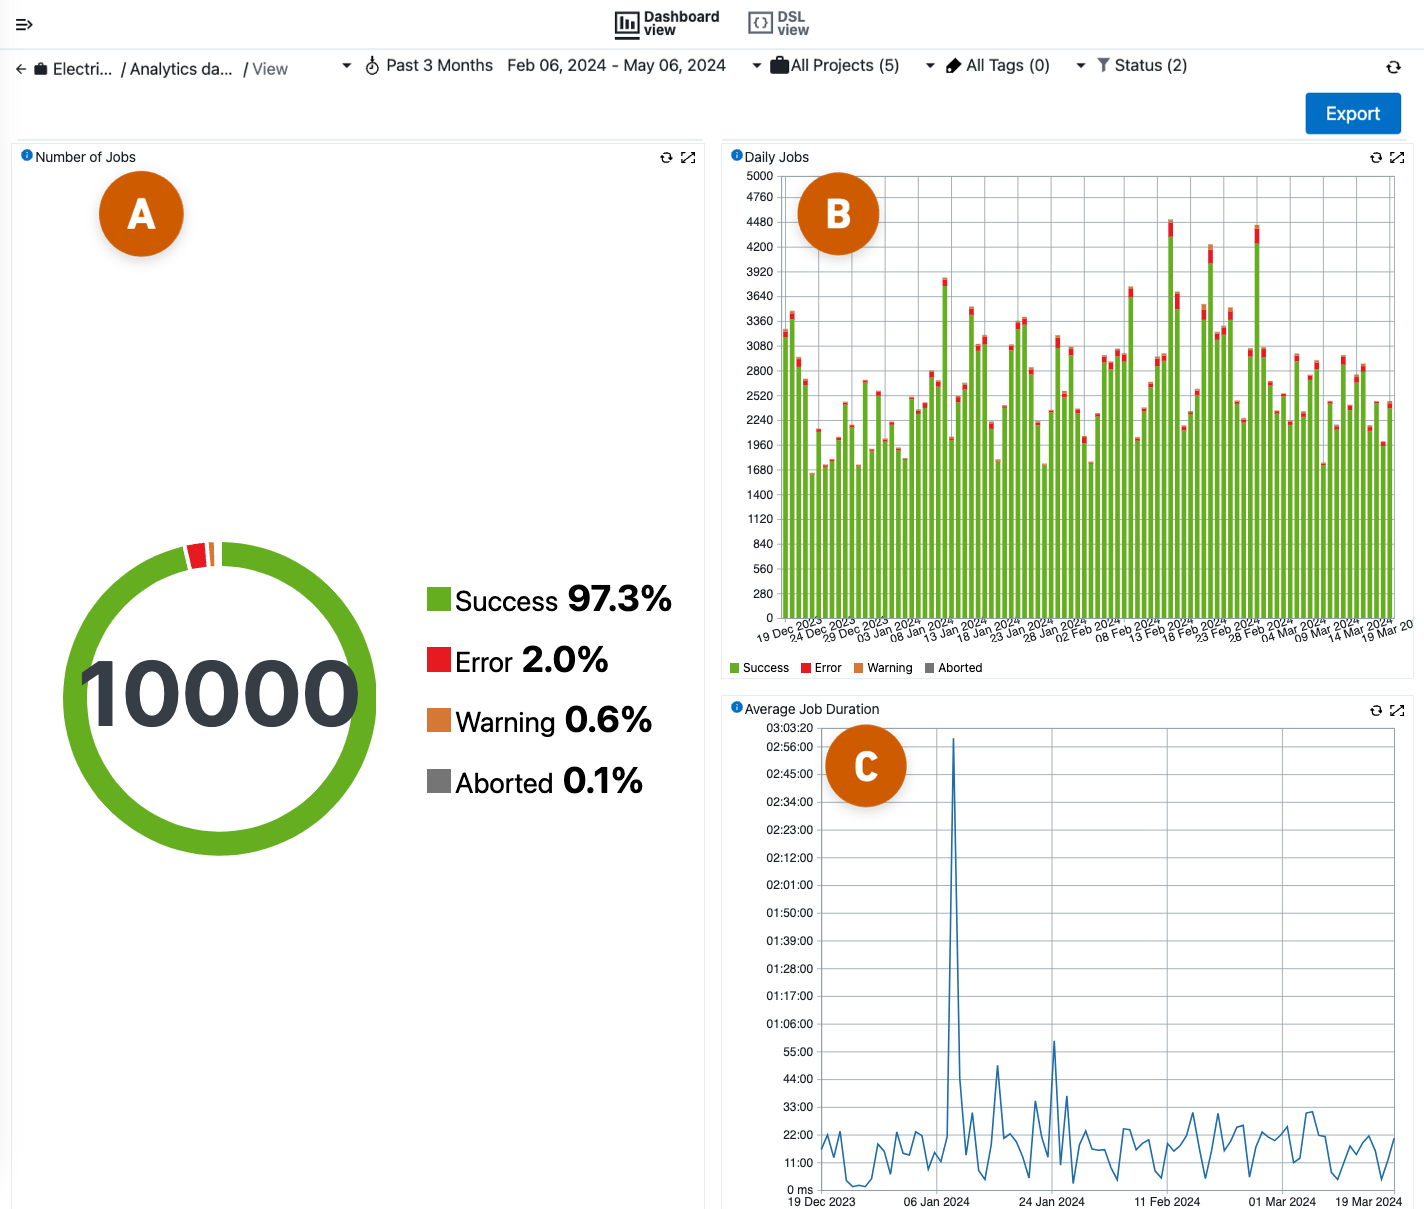
For DevOps engineers, developers, operations teams, and release managers, the job metrics dashboard is a unified view of critical metrics in the DevOps environment. This dashboard helps you to identify trends and detect coding inefficiencies and security warnings.
For example, detect a growing number of jobs being aborted, displaying errors and warnings. View fluctuations in the number of jobs or changes in job duration for early indicators of issues with a CloudBees CD/RO pipeline.
Visualizations
This built-in dashboard is pre-configured from procedure run data. CloudBees CD/RO automatically creates a transaction in the reporting database every time a procedure starts and ends. It derives the duration of the jobs, the number of jobs, and the outcome for each procedure run.

An example of the dashboard is displayed above, composed of the following charts:
-
Number of Jobs: Displays the total number of procedure runs broken out by their color-coded outcome in a donut chart.
-
Daily Jobs: Displays daily totals of procedure runs for the selected timeframe using a stacked vertical bar chart. Each bar corresponds to a day, segmented and color-coded by outcome for quick analysis.
-
Average Job Duration: Displays the average procedure run duration for each day for the selected timeframe in a line chart.
Filter the dashboard
Use the filter options to customize and refine the display of the widget visualizations to your relevant data. The available filters are time period, project, tags, and status.

The following filters are available to customize your dashboard display:
-
Time filter: Procedure run metrics for the past three months are displayed by default. Select the arrow to choose a different date range or select the
Custom…option to specify a custom date range. -
Project: Select which project metrics to include in the dashboard visualizations. By default, metrics for all projects are included.
-
Tags: Filter the jobs based on the tags marked on the procedure. Metrics for all procedures are displayed by default. Example tag formats include "nightly backup" or "env=prod." Refer to object tags for more information.
-
Status: The status filters are color-coded for quick analysis. The All statuses option is selected by default. The available status options are:
-
Success
-
Error
-
Warning
-
Aborted
-
Customize the dashboard
The CloudBees CD/RO built-in dashboards are not editable. However, you can copy the Job metrics dashboard and customize the copy for your use. Refer to copying an existing dashboard for more information.
Export dashboard results
CloudBees CD/RO dashboards can be exported as PDFs. For more information, refer to Export dashboards to PDF.
| If you need more refined results, you can also Create a report and Export reports results. |