A pipeline stage summary shows various statuses and metrics relevant to the pipeline when a pipeline stage is executed. For example, the summary could be the scan results from the code coverage tool or links to reports generated during the pipeline run. You can view the pipeline stage summaries during the pipeline run, or after it completes.
From the Pipeline Runs list, you can select a specific stage to view the stage’s summary. The stage summary shows two sets of stage-specific information.
-
Deployment summary consisting of:
-
A system-generated deployment summary.
-
Applications deployed through the pipeline and the environments where they are deployed.
-
-
User-generated summary consisting of:
-
Links to websites for reports and other information about the deployed artifacts.
-
Property information about the pipeline stage and the objects in it.
-
Creating user-generated data for the stage summary
If the task in a stage is defined by a procedure, a workflow, or an application process that includes a procedure as a process step, you can create user-generated data using ectool.
Linking to stage summary information
To create links to a website:
-
Create a procedure and the underlying steps with commands like the following:
ectool setProperty "/myPipelineStageRuntime/ec_summary/report" --value "<html><a href=\"https://www.myreportserver.com\" target=\"_blank\">Global Report</a></html>" -
Call this procedure from a task in the stage.
Generic property information
-
Create a procedure and the underlying steps with commands like the following.
To create a summary property:
ectool setProperty "/myPipelineStageRuntime/ec_summary/testCoverage "test value"To create a property entry:
ectool setProperty "/myPipelineStageRuntime/ec_summary/testCoverage" --value "80%" -
Call this procedure from a task in the stage.
The following sections provide examples of user-generated data in the stage summary.
Viewing the stage summary during a pipeline run
To view the stage summary during a pipeline run, select the pipeline from the Pipeline Runs list. The stage summary is displayed.
-
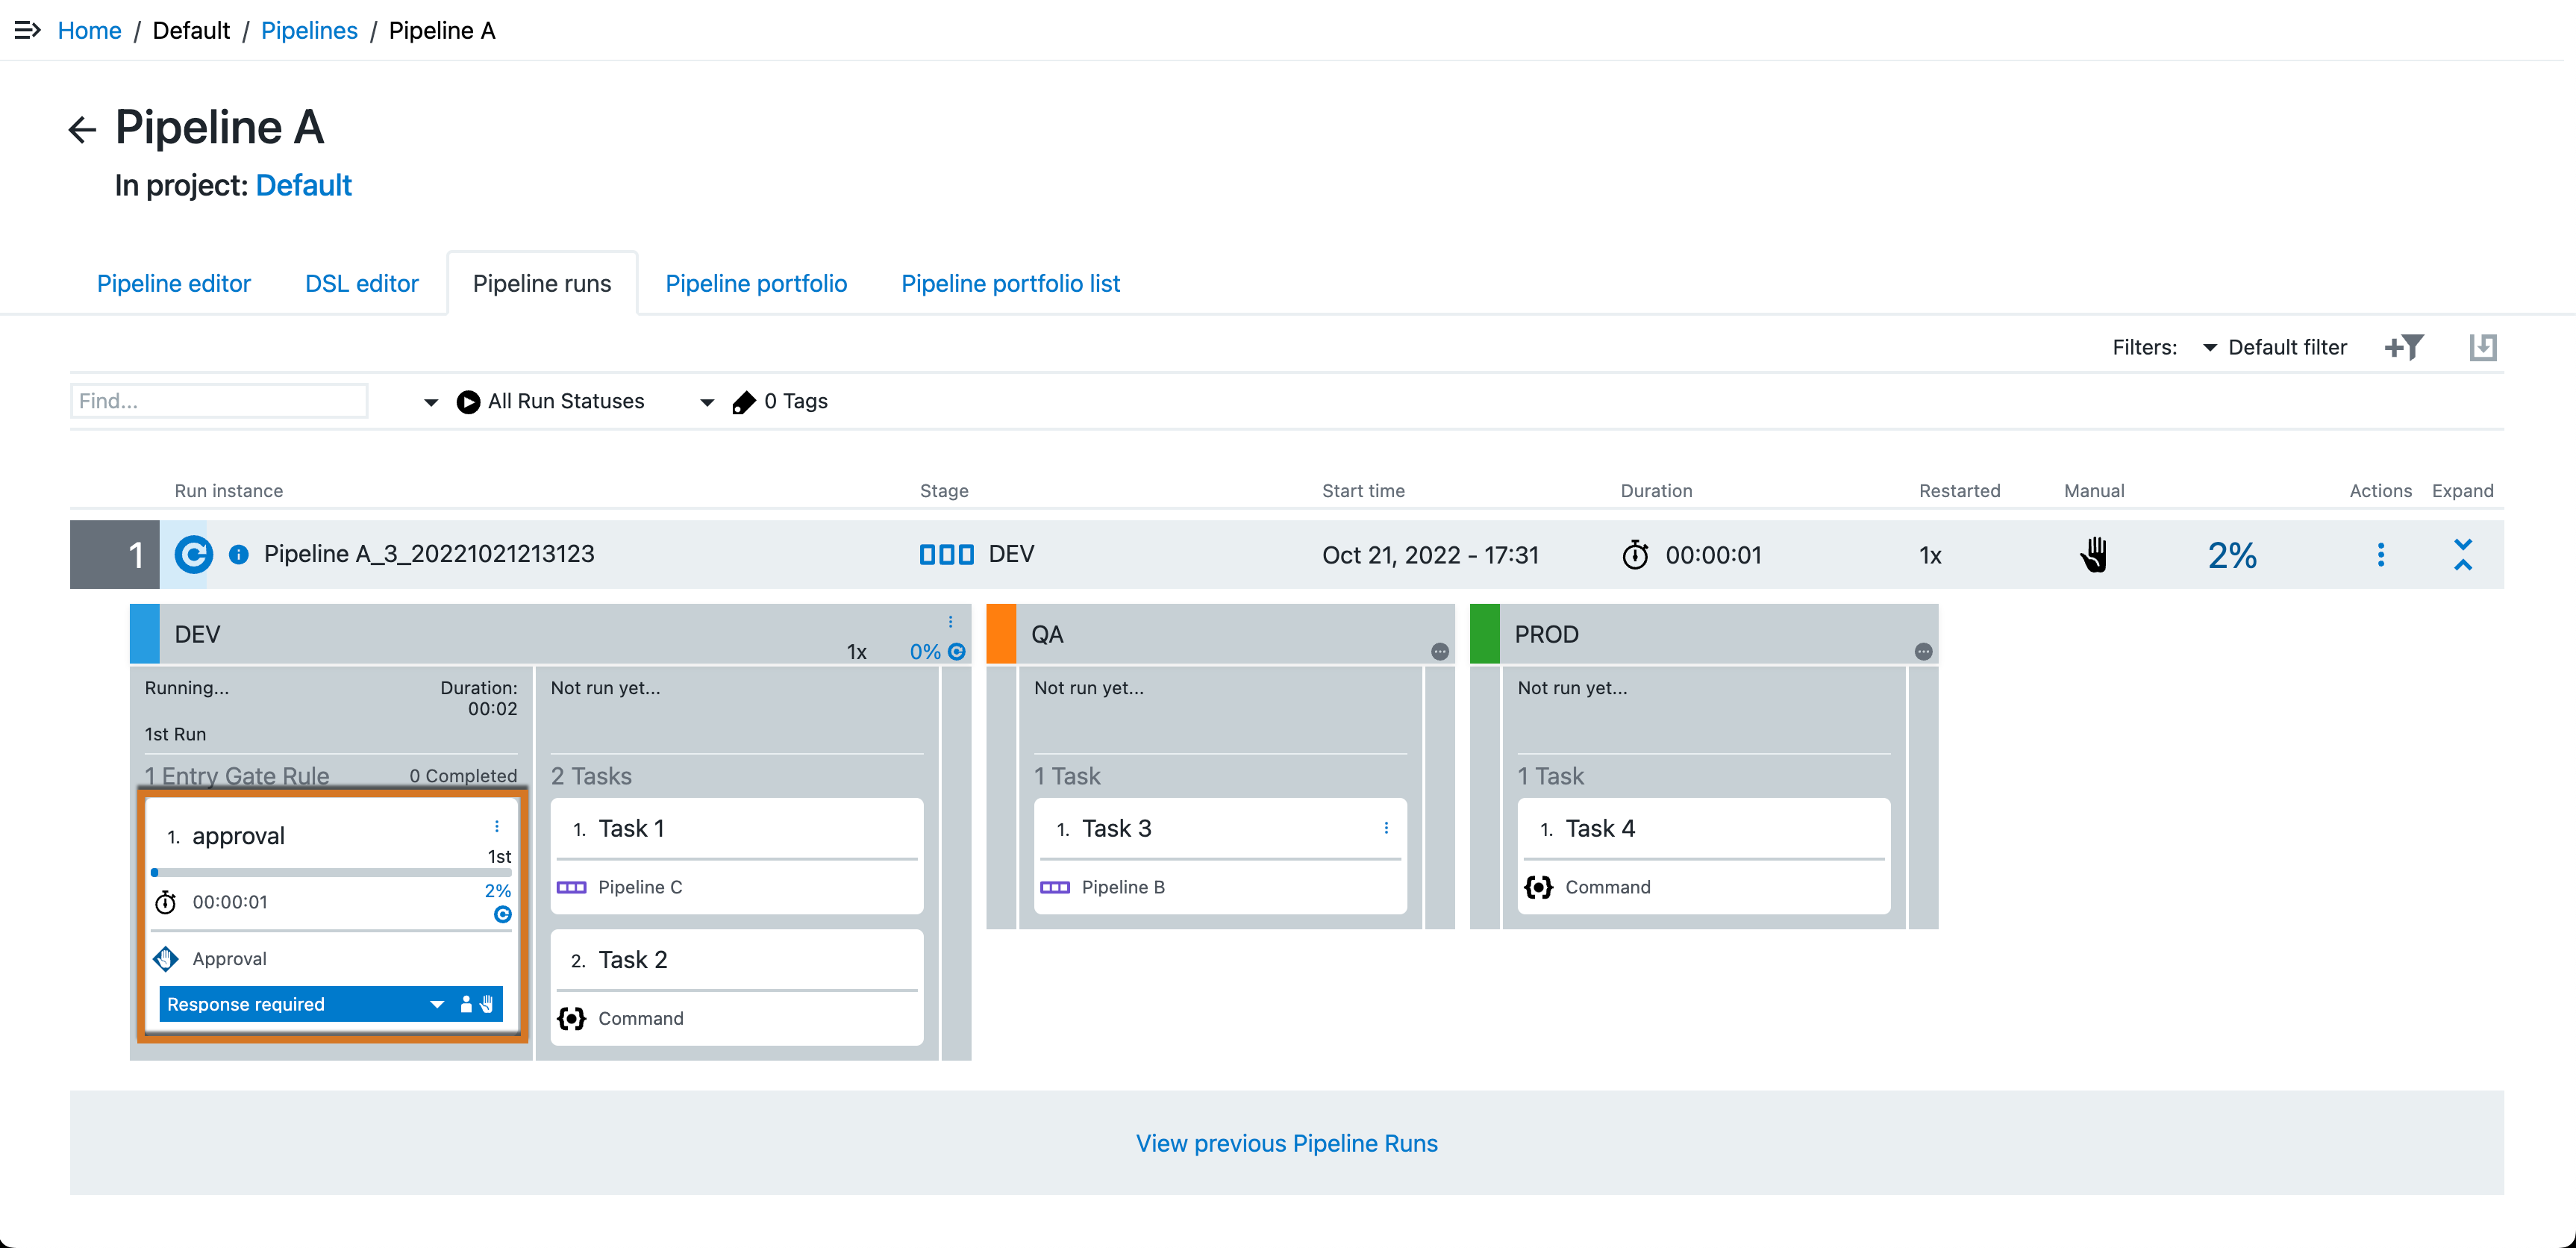
When manual approvals are required at the entry and exit gates to a stage, the system waits for the approvers to approve or reject before proceeding to the next step in the pipeline.
 Figure 1. Manual approval required
 -
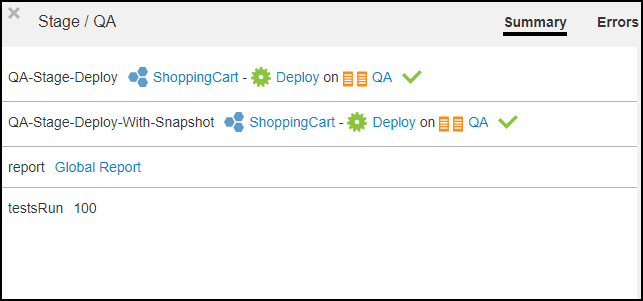
As the pipeline progresses through its stages, view its progress by selecting the Summary link in the stage header to open the pipeline stage summary.
 Figure 2. Stage summary information
The stage summary shows information about the tasks. In this example:
-
The first task is QA-Stage-Deploy. It is defined by the ShoppingCart application. The Deploy application process was deployed in the QA environment. The green check mark indicates that the task successfully completed.
-
The second task is QA-Stage-Deploy-with-Snapshot. It is also defined by the ShoppingCart application. The Deploy application process was deployed in the QA environment. The green check mark indicates that this task also successfully completed.
-
The third task is QA-Stage-TakeSnapshot. It is defined by a procedure called TakeSnapshot. When you select the task, the Job Details page opens, showing that the procedure consists of two steps. Both steps were successfully completed. You can select Log in the Log column on the Job Details page to view more details.
-
Viewing the stage summary for a completed pipeline run
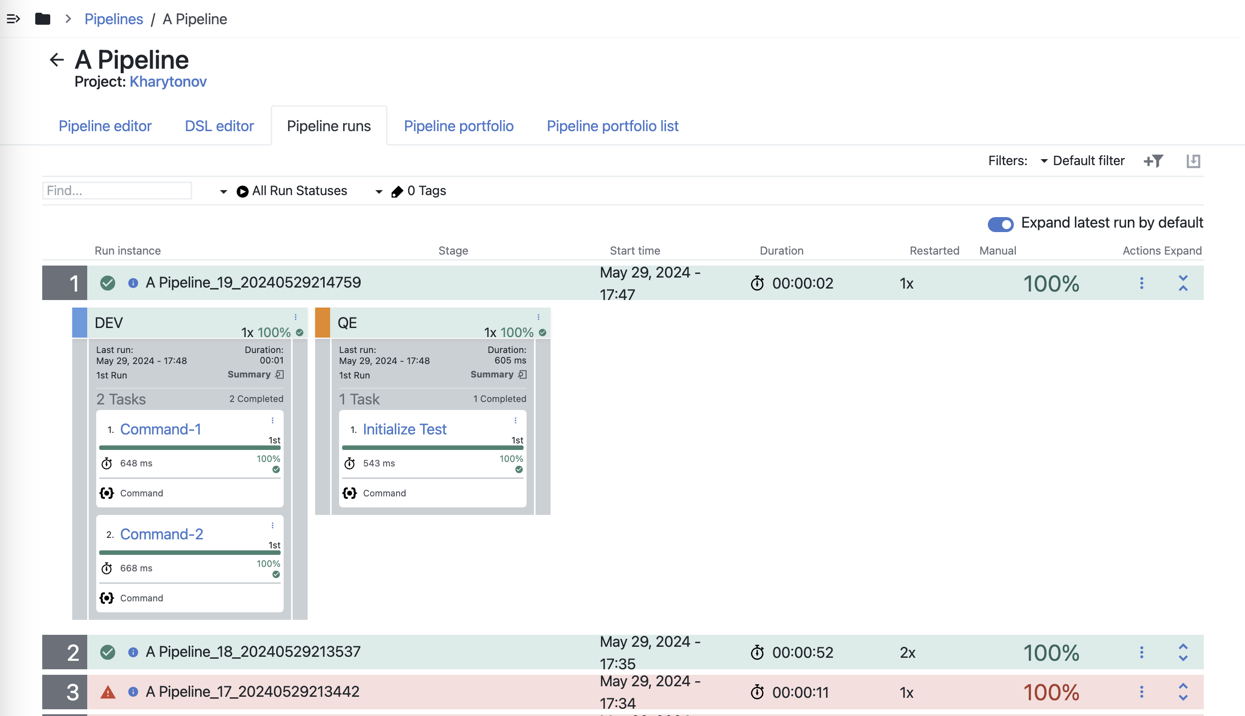
To view the stage summary of a stage in a completed pipeline run, select the pipeline name in the Pipelines list, and then select Pipeline runs. A list of current and completed pipeline runs displays for the selected pipeline.
The Expand latest run by default toggle is enabled by default, indicated by its blue color. When enabled, the most recent pipeline run is expanded, displaying stages and run details. To disable this option, select the toggle, which will change its color to gray.

To troubleshoot the pipeline, select the Error Summary link on the stage that completed with errors and review the error details.