This section outlines the process that should be followed when attempting to diagnose a memory leak in your CloudBees CI environment. Most of the information here pertains to Linux environments, but some of it can be applied on Windows systems as well.
Understand memory allocation
In order to make the best use of the information in this section, it is helpful to have an understanding of how memory is allocated and tracked by the Linux kernel and how the Java Virtual Machine (JVM) uses that memory.
The kernel maintains a cache of pages (items that are stored in RAM) that have been freed recently by the processes that originally used them. If the same running process needs that data again, it can be retrieved quickly from the RAM cache instead of having to be read from disk again. If a new process needs to allocate memory for something, pages are flushed from this cache. As a result, when you look at the amount of free memory on a system, you need to make sure that you are considering the cached value because this is the true amount of free memory available. In the example below, you would refer to the “available” value, not the “free” value. Older versions of the Linux kernel do not separate this, but you can calculate it from the “buff/cache” value.
user@cloudbees:~$ free -h total used free shared buff/cache available Mem: 3.9G 224M 250M 48M 3.5G 3.2G Swap: 1.9G 83M 1.8G
You can also see system memory usage by running cat /proc/meminfo. For example:
MemTotal: 4121524 kB MemFree: 255712 kB MemAvailable: 3400804 kB Buffers: 177612 kB Cached: 3295172 kB SwapCached: 2480 kB Active: 1904340 kB Inactive: 1757004 kB
Again, newer kernels will have the MemAvailable value, older ones will only show Buffers and Cached. It is common to mistakenly think that a system is running out of memory when a very low “free” memory value is seen, but as long as the “available” or “cached” value is reasonably large, there is no problem.
Out Of Memory Killer
The kernel also has a feature called the Out Of Memory (OOM) Killer, which kills processes when memory is low to keep the whole system from crashing. When free memory is very low and a process tries to allocate more than what is available, the kernel looks at other user-space (non-kernel) processes that are running and kills those that are using the most memory until enough is free for the requesting process. Since CloudBees CI is typically the largest memory user on a system, if free memory runs out it will most likely be killed.
JVM memory usage
The JVM uses three different memory regions internally when it allocates memory from the kernel. These are the Heap, Metaspace, and Native regions.
-
Heap memory is usually the largest region, and is used to store all object data used by the running application. Every string, array, map, etc., lives in the Heap. This needs to be sized appropriately for the CloudBees CI workload. CloudBees recommends setting the max heap size to no less than 4GB for small systems, and no more than 16GB for the largest ones.
-
The Metaspace region is used for storing metadata about all the loaded Java classes. In many Java applications the Metaspace usage doesn’t change very much during runtime, but CloudBees CI is a little bit different in this respect. Because Pipeline configuration is written in a Groovy DSL, and Groovy is an extension of the JVM and its classes, Pipeline jobs can load and unload classes as a part of normal running operation. This is especially true when shared libraries are used. If a bug prevents classes from being unloaded when they are no longer needed, they can be loaded multiple times, using more and more memory that is never freed. This is known as a class or metaspace leak.
-
The Native region is memory that is reserved for the JVM itself, and generally should not be impacted by what the application is doing. In rare cases we may see memory usage issues that are traced to problems with the way Native memory is used.
Symptoms of a memory leak
Several different symptoms can indicate a possible memory leak.
-
If you see that CloudBees CI was terminated by the OOM killer, it’s important to check how much memory the java process was using when it was killed, and compare this with the max heap setting for the environment. See Memory Problem: Process killed by OOM Killer on the CloudBees Knowledge Base for information about the OOM killer and how it can impact CloudBees CI. The
dmesgcommand dumps the kernel logs that show any OOM kill events. Such events will look like this:[XXXXX] Out of memory: Kill process 12345 (java) score 869 or sacrifice child [XXXXX] Killed process 12345 (java) total-vm:18819908kB, anon-rss:13225320kB, file-rss:0kB, shmem-rss:0kBThe anon-rss value is the important one to look at; it’s the total physical RAM used by the java process. Here it shows 13GB of RAM used. Compare this with the max heap setting that is defined for the CloudBees CI controller or operations center service, and if the anon-rss value is significantly larger than the max heap value (more than 1-2GB larger), it indicates a metaspace or native memory leak.
If the anon-rss usage looks normal relative to the max heap setting, it’s more likely that the OOM kill happened due to the host (or container) not having enough memory overall, or some other process in the system is using too much memory, as opposed to there being a memory leak.
-
If the controller is using a large amount of memory despite not having very many jobs configured, this could be a sign of a memory leak. The Monitoring plugin can be used to add basic memory usage graphs to CloudBees CI, which can help with diagnosing memory leaks. Alternatively, the Metrics plugin can be used to allow an external monitoring/graphing tool to display this information about your CloudBees CI environment.
If heap memory usage is very high despite a small number of jobs being configured, this can indicate a heap memory leak or Pipeline jobs using excessive memory due to poor design. If you find that your controller needs a large amount of heap memory to perform well, you should discuss this with the CloudBees Support team to see if there is a problem that needs to be addressed.
-
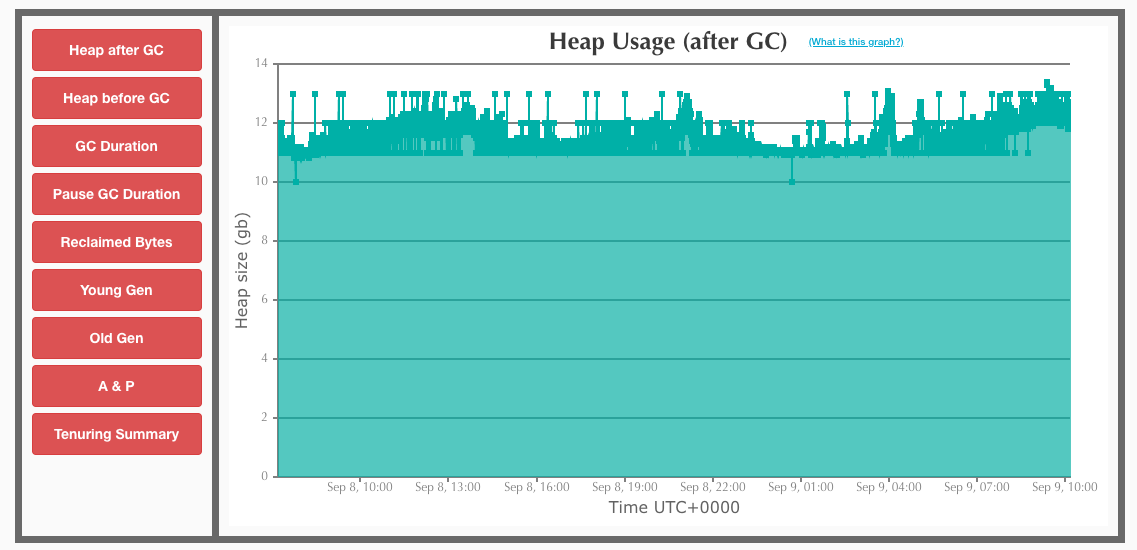
Graphs from garbage collection logs can show evidence of a heap memory leak. GC Easy is a free service that you can upload GC logs to for analysis. If the Heap Usage (after GC) graph shows a flat line, it indicates that memory is not being freed by the garbage collector. This could just be caused by the controller not having a large enough max heap setting, and therefore all of it is used. But, if the used amount is less than the max and isn’t ramping up and dropping back down in a sawtooth pattern, that indicates a memory leak.
Diagnose and resolve memory leaks
Diagnosing and resolving memory leaks in CloudBees CI generally requires deep knowledge of the product and its codebase. The CloudBees Support team has developed a set of tools and processes to help analyze memory issues quickly. Among other things, we can:
-
Analyze a support bundle to check for known memory leaks in versions of CloudBees CI and its plugins that are in use.
-
Review logs for evidence of Out Of Memory Killer events, unusually high memory usage, and other evidence of leaks or memory performance issues.
-
Examine a heap dump from the affected system, to see exactly where memory is being used and identify remedies.
We often work on issues like this in consultation with our Engineering team as well. If you suspect you may have a memory leak in your environment, please open a support case.