This document is intended as a reference for tuning and troubleshooting the Java Virtual Machine (JVM) that CloudBees CI runs on, using current best practices, as well as a troubleshooting guide for performance issues for CloudBees CI administrators.
Background
CloudBees CI is a self-contained Java-based program, ready to run out-of-the-box, with packages for Windows and Unix-like operating systems. The CloudBees CI application runs inside a JVM.
JVMs have two primary functions:
-
To allow Java programs to run on any device or operating system (known as the "Write once, run anywhere" principle)
-
To manage and optimize program memory
There are several aspects to tuning a JVM for CloudBees CI:
-
A supported version of Java
-
Minimum JVM specifications
-
Recommended CloudBees CI JVM specifications
Supported Java versions
JVMs manage program resources during execution based on configurable settings, and it’s important to ensure that you’re running a supported version of Java.
Recommended specifications for CloudBees CI
Heap size
Heap sizes are calculated based on the amount of memory on the machine unless the initial and maximum heap sizes are specified on the command line.
| Default JVM specifications (out-of-the-box) | Recommended JVM specifications for CloudBees CI | |
|---|---|---|
Initial heap size |
1/64th of physical memory up to 1GB |
A minimum of 2GB for the operations center and a minimum of 4GB for controllers in a production instance |
Maximum heap size |
1/4 of physical memory up to 1 GB |
Maximum of 16GB (Anything larger should be scaled horizontally) |
Garbage collection |
ParallelGC |
G1GC |
You can specify the initial and maximum heap sizes using the flags -Xms (initial heap size) and -Xmx (maximum heap size). For more information, refer to Recommended CloudBees CI JVM options. It is recommended to define the same value for both -Xms and -Xmx so that the memory is allocated on startup rather than runtime.
Garbage collection
In many traditional programming languages, program memory was managed by the programmer. Java uses a process called garbage collection to manage program memory. Garbage collection happens inside a running JVM and continuously identifies and eliminates unused objects in memory from Java programs. As of Java 8, there are four different types of garbage collection algorithms:
Serial collector
-
Designed for single-threaded environments
-
Freezes all application threads whenever it’s working
-
Does not make effective use of multiple processors so not a good fit for most CloudBees CI instances.
Parallel/Throughput collector
-
Designed to minimize the amount of CPU time spent for garbage collection (maximum throughput) at the cost of sometimes long application pauses.
-
JVM default collector in Java 8 (In later versions of Java G1 is default)
-
Uses multiple threads to scan through and compact the heap
-
Stops application threads when performing either a minor or full garbage collection
-
Best suited for apps that can tolerate application pauses and are trying to optimize for lower CPU overhead
CMS collector
-
concurrent-mark-sweep
-
Uses multiple threads (“concurrent”) to scan through the heap (“mark”) for unused objects that can be recycled (“sweep”)
-
Does not perform compaction of older objects—eventually the heap will become fragmented and have to do a slow Full GC.
-
Requires a lot of tuning to use with CloudBees CI, and tends to be more “brittle” than other collectors — if not carefully managed, it can cause serious problems. Recommended to not be used.
G1 collector
-
The Garbage first collector (G1) aims to minimize GC pause times and adjust itself automatically rather than requiring specific tuning.
-
Uses parallel threads to collect young objects (stop the world pause), and collects older objects mostly without interrupting the application (concurrent GC).
-
Does not aim to collect all garbage at once — most collection cycles just remove young objects, and when older objects are collected they are usually done a part at a time.
-
Introduced in JDK 7 update 4
-
Designed to better support heaps larger than 4GB.
-
Utilizes multiple background threads to scan through the heap, and then it divides the heap into regions ranging from 1MB to 32MB (depending on the size of your heap)
-
Geared towards scanning those regions that contain the most garbage objects first (thus the "Garbage first" name).
-
Uses a bit of extra memory to support garbage collection.
Recommended CloudBees CI JVM options
Recommended specifications for CloudBees CI describes the recommended minimum settings you need for a JVM, and gave some context for the defaults and garbage collection choices.
This section covers how to configure the CloudBees CI JVM according to current best practices (as of January 2020) and how to configure it to use a garbage-collection strategy that aligns with your requirements.
The CloudBees CI service configuration file
If you installed CloudBees CI using system packages, the CloudBees CI JVM is controlled by a service configuration file, to which you can add Java arguments. The location of this file varies by product.
Client controller
For a client controller, the service configuration file is located in:
-
Debian based (for example, Ubuntu) Linux distributions:
/etc/default/cloudbees-core-cm -
Fedora based (for example, RedHat) Linux distributions:
/etc/sysconfig/cloudbees-core-cm -
Windows:
%ProgramFiles%\CloudBeesCoreCM\jenkins.xml
Operations center
For the operations center, you can find the service configuration in:
-
Debian based (for example, Ubuntu) Linux distributions:
/etc/default/cloudbees-core-oc -
Fedora based (for example, RedHat) Linux distributions:
/etc/sysconfig/cloudbees-core-oc -
Windows:
%ProgramFiles%\CloudBeesCoreOC\jenkins.xml
Adding Java arguments to the CloudBees CI on traditional platforms service configuration file
This CloudBees KB Article explains how to add Java arguments to the service configuration file.
Refer to the sections below for Supported Java 8 arguments and Supported Java 11 and 17 arguments. Using unsupported Java arguments will result in startup failure.
| CloudBees strongly recommends that you upgrade to Java 17 as soon as possible for the best experience. CloudBees no longer supports Java 8 and in late October 2024, support for Java 11 will be discontinued, and you will be unable to run new versions of the product on Java 11. Releases that occurred during the support window for Java 11 will continue to run on Java 11. |
Supported Java 8 arguments
Refer to JVM Recommended Arguments for JVM arguments supported by Java 8.
Supported Java 11 and 17 arguments
Refer to JVM Recommended Arguments for more information on JVM arguments supported by Java 11 and Java 17.
Memory Specifications
Default Maximum heap size “out-of-the-box” with Java is 1/4 of your physical memory. It’s not recommended to exceed ½ of your physical memory, noting that 16GB heaps are the largest supported. For small instances, you always want at least 1GB of physical memory left empty for Metaspace, off-heap Java use, and operating system use.
Minimum physical memory
CloudBees generically suggests starting CloudBees CI with at least 2 GB of heap (-Xmx2g), and a minimum physical memory of 4GB. Smaller instances that only serve a small team can use less, however, we do not suggest running CloudBees CI with less than 1GB of heap and 2 GB of total system memory, because this requires careful tuning to avoid running out of memory. It is important to plan for CloudBees CI heap to be increased as usage increases, and scale horizontally when the recommended maximum heap size of 16GB is reached.
Scaling memory in production
For a production environment with considerable workload, a good starting point would be -Xmx4g, which dictates a minimum physical memory of 8GB.
In the event your instance demands more than -Xmx16g, try scaling horizontally by adding more controllers using operations center, which divides the workload more efficiently. Dividing the workload at this threshold also minimizes a single point of failure. At 24 GB, this becomes extremely important because managing a controller at this scale requires a specialized skill-set and incurs extra administrative problems. Besides reduced efficiency, it concentrates so much responsibility on one system that it is hard to schedule routine maintenance and harder to guarantee system stability.
How do I know if I need to increase heap?
Traditionally, JVM administrators measure CPU, RAM, and disk I/O as macro metrics for the performance of the application. In addition to this, measuring micro metrics can assist in properly forecasting for growth. Micro metrics can be measured by analysing garbage collection logs, and thread dumps.
-
Thread count should be under 700.
-
The GC throughput (the percentage of time spent running the application rather than doing garbage collection) should be above 98%.
-
The amount of the heap used (not just allocated) for old-generation data should not exceed 70% except for brief spikes and should be 50% or less in most cases.
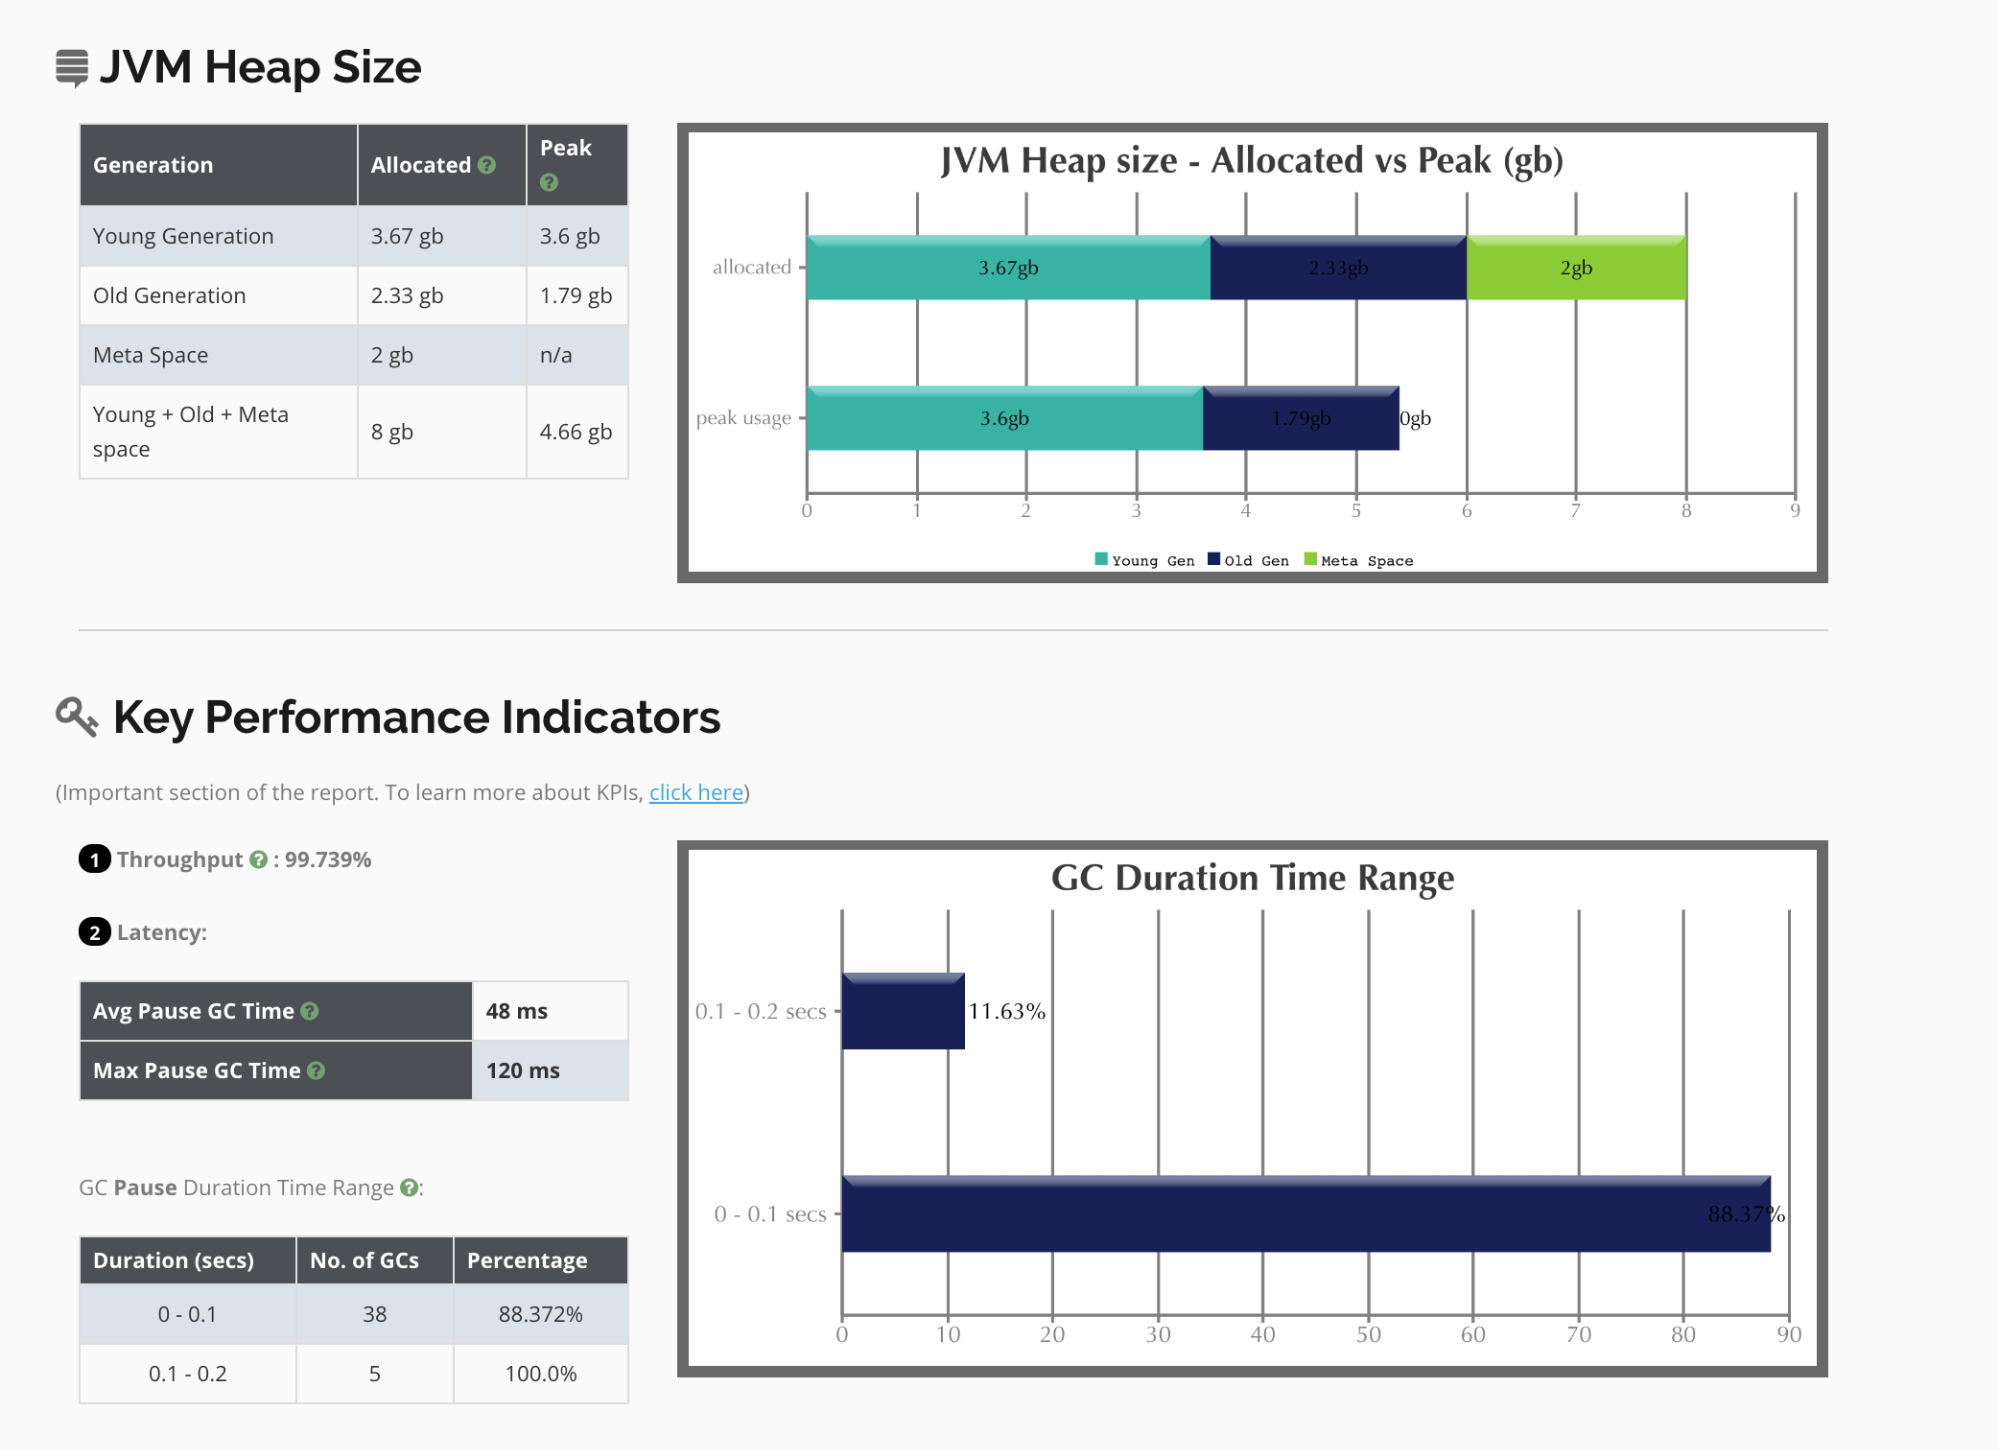
By analyzing GC logs in products such as gceasy.io, it is easy to evaluate these metrics.
Minimum and maximum heap sizes
Set your minimum heap size (-Xms) to the same value as your maximum heap size. Again, it is recommended that your maximum heap size not exceed 16GB (-Xmx16g). Setting these values ensures the memory needed for your application is allocated at startup rather than runtime.
Examples:
-Xms8g: sets the initial (and minimum) heap size to 8GB
-Xmx8g: sets the maximum heap size to 8g
Garbage Collection Specifications
Currently, it is recommended to use the G1 Garbage Collection algorithm.
G1 is superior to ParallelGC or CMS for a CloudBees CI JVM. This is because G1 avoids long “stop the world” pauses which can take many seconds in a large collection. CloudBees CI is an application that relies on low latency, so the shorter the GC pauses, the better. It is also the default Garbage Collector in Java 9.
Specify G1 GC as follows:
-XX:+UseG1GC
Troubleshoot
Troubleshoot a performance issue requires the collection of data. Generally, this requires gathering several Java thread dumps, which are a way of finding out what every JVM thread is doing at a particular point in time. This is especially useful if the Java application seems to hang under load, as an analysis of the thread dumps will indicate where threads are stuck.
It is important that the data is collected while the performance issue is actively occurring on the JVM/CloudBees CI. If CloudBees CI is restarted before the data is collected, the active threads will be lost, and it may be harder to pinpoint the issue.
There are two recommended methods of collecting data:
Generating a support bundle
Generate a support bundle explains how to generate a support bundle for CloudBees CI products.
Prerequisite
Recommended Java Arguments are set per Recommended specifications for CloudBees CI.
collectPerformanceData Script
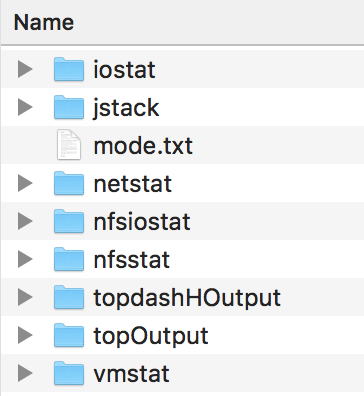
The collectPerformanceData script has been developed to gather data for analysis during a performance issue that occurs when running on a Unix-like system. The script collects a thread dump via jstack and includes output from the top, vmstat, netstat, nfsiostat, nfsstat and iostat binary utilities.
Running the script
To run the script:
-
Confirm that the binary tools to run the script are included in your
$PATH:-
iostat
-
netstat
-
nfsiostat
-
nfsstat
-
vmstat
-
top
-
-
Make the script executable with the command
shell% chmod +x collectPerformanceData.sh -
Retrieve the values of the variables
$JENKINS_USERand$JENKINS_PIDby using theechocommand -
Make sure that the directory where the script is running has
rw(read and write) permissions set on it -
As the same user that runs CloudBees CI, execute the script with the command
shell% sudo -u $JENKINS_USER sh collectPerformanceData.sh $JENKINS_PID 300 5Note that the “300” and “5” are configurable arguments for “Length to run the script in seconds” and “Intervals to execute commands in seconds.”
It is highly recommended to practice executing the script in your environment to make sure everything works as expected. When performance issues arise, you will be able to execute the script right away rather than spending extra time to troubleshoot the script execution.
Data included in the script output
The following section contains more details on the information obtained by the script:
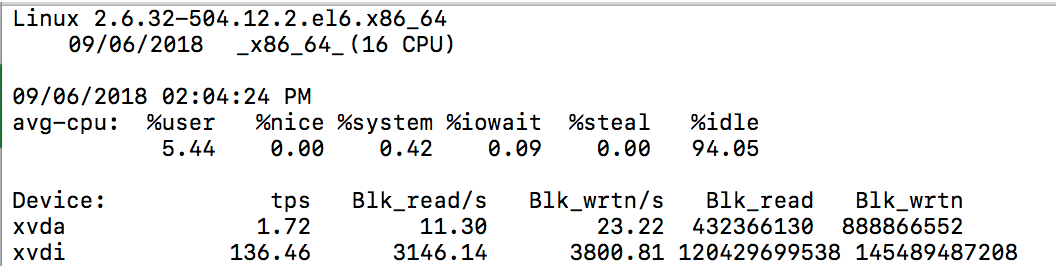
iostat
(input/output statistics) is a computer system monitor tool used to collect and show operating system storage input and output statistics. It is often used to identify performance issues with storage devices, including local disks, or remote disks accessed over network file systems such as NFS.
Example Output:
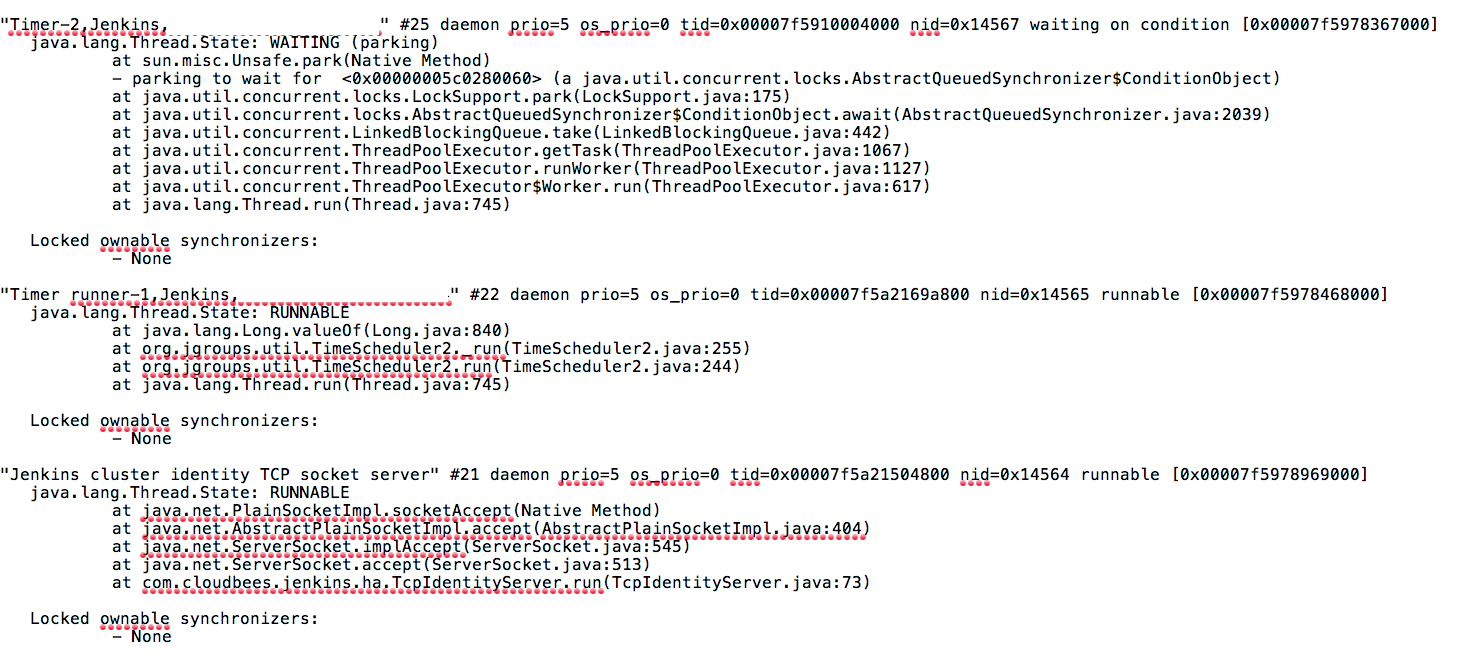
jstack
The jstack command-line utility attaches to the specified process or core file and prints the stack traces of all threads that are attached to the virtual machine, including Java threads and VM internal threads, and optionally native stack frames. The utility also performs deadlock detection.
Example Output:
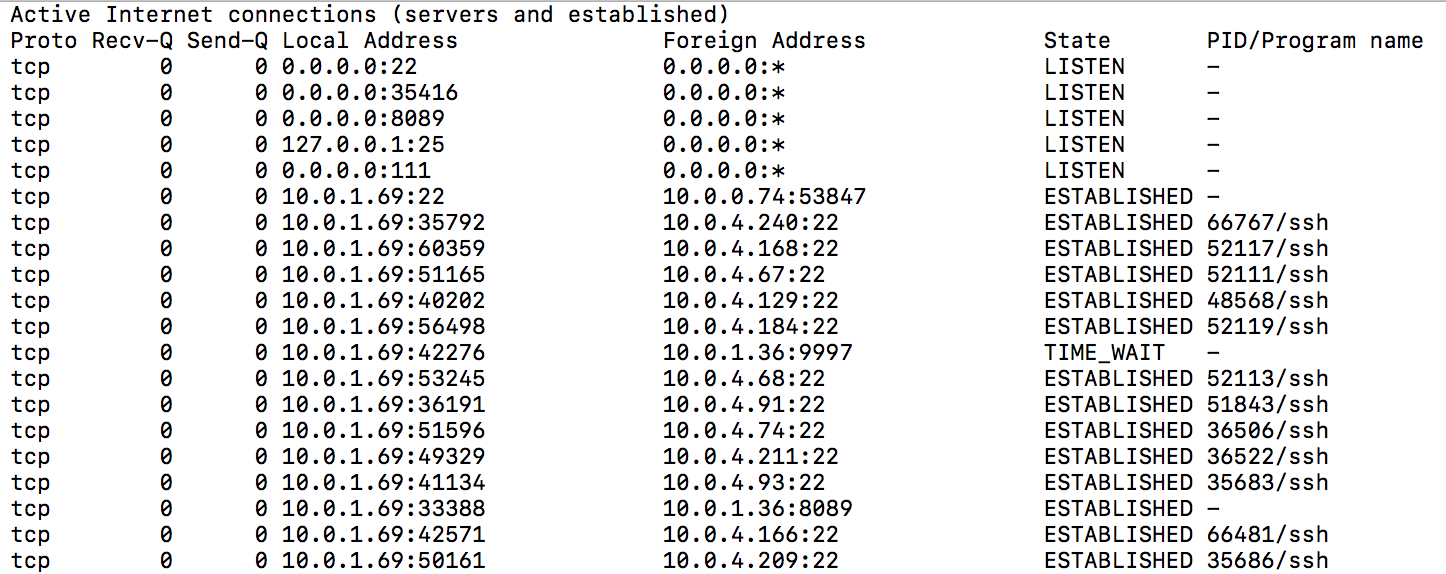
netstat
Netstat is a command line TCP/IP networking utility available in most versions of Windows, Linux, UNIX and other operating systems. Netstat provides information and statistics about protocols in use and current TCP/IP network connections.
Example Output:
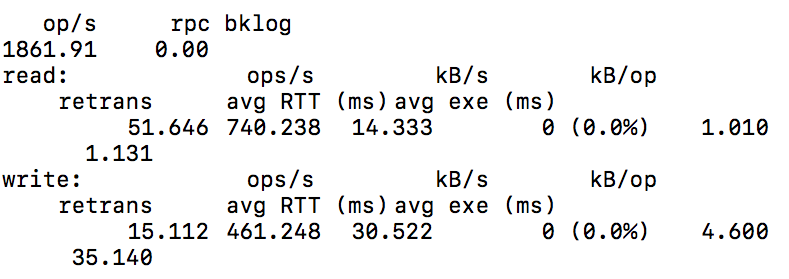
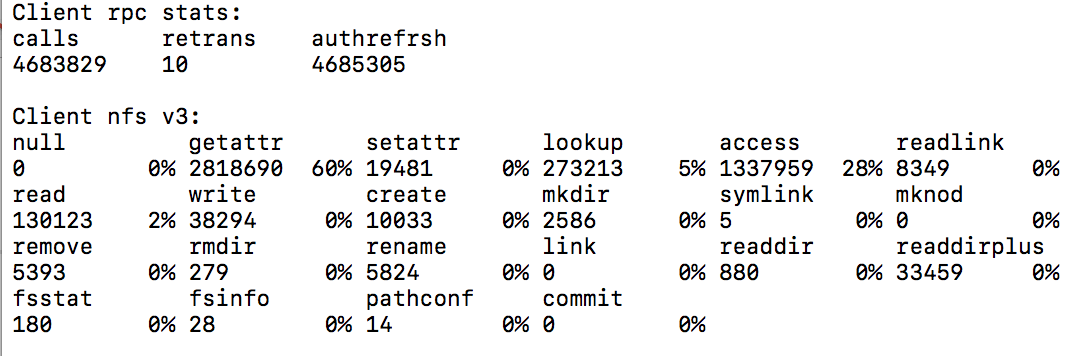
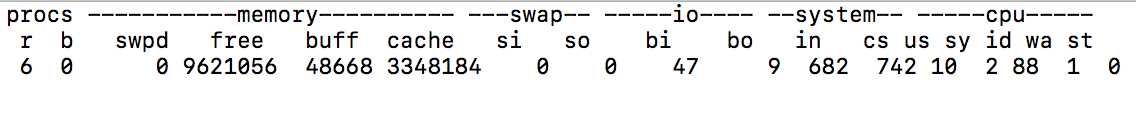
nfsiostat
The sysstat family includes a utility called nfsiostat, that resembles iostat, but allows you to monitor the read and write usage on NFS mounted file systems.
Example Output:
top
The top command allows users to monitor processes and system resource usage on Linux. By combining a series of JStack and top (or, more likely, top -h) dumps, you can help identify Java operations that are consuming a lot of CPU time. Convert thread IDs that are using a lot of CPU in “top” to hexadecimal and look for them in the jstack dumps taken at about the same time. If you see the same thread id appearing as a high CPU user across multiple thread dumps, that is often a culprit high CPU user. Be aware that these are all moment-in-time measurements though — you may just happen to capture something that is briefly using a lot of CPU but which is overall not a problem.
Example Output:
Understand Thread Dumps
A web server uses tens to hundreds of threads to process a large number of concurrent users. If two or more threads utilize the same resources, a contention between the threads is inevitable, and sometimes deadlock occurs.
Thread contention is a status in which one thread is waiting for a lock, held by another thread, to be lifted. Different threads frequently access shared resources on a web application. For example, to record a log, the thread trying to record the log must obtain a lock and access the shared resources.
Deadlock is a special type of thread contention, in which two or more threads are cannot progress at all because each holds a lock and is waiting on a lock the other thread already holds.
Different issues can arise from thread contention. To analyze such issues, you need to use a thread dump. A thread dump will give you the information on the exact status of each thread.
Below, you will find the aforementioned example using jstack:
"Computer.threadPoolForRemoting [#25] for OperationsCenter2 connection from example.com/10.62.98.33:43856" #7992 daemon prio=5 os_prio=0 tid=0x00007fa7741bd000 nid=0x2c94 runnable [0x00007fa6d46da000] java.lang.Thread.State: RUNNABLE at org.mindrot.jbcrypt.BCrypt.key(BCrypt.java:556) at org.mindrot.jbcrypt.BCrypt.crypt_raw(BCrypt.java:629) at org.mindrot.jbcrypt.BCrypt.hashpw(BCrypt.java:692) at org.mindrot.jbcrypt.BCrypt.checkpw(BCrypt.java:763) at hudson.security.HudsonPrivateSecurityRealm$3.isPasswordValid(HudsonPrivateSecurityRealm.java:686) at hudson.security.HudsonPrivateSecurityRealm$4.isPasswordValid(HudsonPrivateSecurityRealm.java:707) at hudson.security.HudsonPrivateSecurityRealm$Details.isPasswordCorrect(HudsonPrivateSecurityRealm.java:517) at hudson.security.HudsonPrivateSecurityRealm.authenticate(HudsonPrivateSecurityRealm.java:184) at sun.reflect.GeneratedMethodAccessor351.invoke(Unknown Source) at sun.reflect.DelegatingMethodAccessorImpl.invoke(DelegatingMethodAccessorImpl.java:43) at java.lang.reflect.Method.invoke(Method.java:498)
In this example, the following can be gathered:
Thread Name: "Computer.threadPoolForRemoting [#25] for OperationsCenter2 connection from cbj.example.com/10.62.98.33:43856"
-
When using the
java.lang.Threadclass to generate a thread, it will be named ThreadName-(Number), whereas when using thejava.util.concurrent.ThreadFactoryclass, it will be named pool-(number)-thread-(number).
Thread Type: daemon
-
Java threads can be divided into two:
-
daemon threads;
-
non-daemon threads.
-
Thread Priority: prio=5 os_prio=0
Java Thread ID: tid=0x00007fa7741bd000
-
This is the Java Thread ID obtained via
java.lang.Thread.getId()and usually implemented as an auto-incrementing long 1..n
Native Thread ID: nid=0x2c94
-
This is hexadecimal. If you convert it to a base 10 number, you can often find the thread in a
topcapture taken at the same time. -
Crucial information as this native Thread ID allows you to correlate for example which Threads from an OS perspective are using the most CPU within your JVM etc.
Thread State and Detail: runnable [0x00007fa6d46da000]
-
Allows quick identification of Thread state and its potential current blocking condition
-
Thread States:
-
NEW: The thread is created but has not been processed yet.
-
RUNNABLE: The thread is occupying the CPU and processing a task. (It may be in WAITING status due to the OS’s resource distribution.)
-
BLOCKED: The thread is waiting for a different thread to release its lock in order to get the monitor lock.
-
WAITING: The thread is waiting by using a wait, join, or park method.
-
TIMED_WAITING: The thread is waiting by using a sleep, wait, join or park method.
-
Thread Stack Trace:
at org.mindrot.jbcrypt.BCrypt.key(BCrypt.java:556) at org.mindrot.jbcrypt.BCrypt.crypt_raw(BCrypt.java:629) at org.mindrot.jbcrypt.BCrypt.hashpw(BCrypt.java:692) at org.mindrot.jbcrypt.BCrypt.checkpw(BCrypt.java:763) at hudson.security.HudsonPrivateSecurityRealm$3.isPasswordValid(HudsonPrivateSecurityRealm.java:686....
Each line in the stack trace corresponds to code, and subsequently a line number. As an example, we could trace:
hudson.security.HudsonPrivateSecurityRealm$3.isPasswordValid(HudsonPrivateSecurityRealm.java:686
Identify and fix performance issues
Typically, performance issues can be traced back to one of several different arenas.
CPU/Memory Issues - these may be related:
-
High CPU
-
Poor GC Performance/Thrashing in GC
Note that the issues are ordered from highest to lowest severity and that the previous issue can cause the symptoms of the subsequent issues to occur. For example, an Out of Memory Error can cause high CPU, a hang, and/or poor GC performance. Also note that if you are experiencing an Out of Memory Error along with high CPU & poor GC performance, the Out of Memory Error takes precedence. Once the Out of Memory Error is resolved it also resolves the other symptoms in most cases.
Out of Memory error
It is critical to determine the type of Out of Memory error since each type requires different steps for debugging and resolution. For example, reviewing a heap dump should be done after confirming that a Java heap Out of Memory Error occurred via the log files or verbose GC data. This is because the JVM will generate a heap dump for any Out of Memory Error that occurs if the Java Argument
-XX:+HeapDumpOnOutOfMemoryError is set. A Java heap dump also shows valid memory usage, so it is best to review the file generated when the Out of Memory Error is thrown if possible.
The following are common Out Of Memory Errors:
java.lang.OutOfMemoryError: Unable to create new native thread: The Java application has hit the limit of how many Threads it can launch. This can typically be resolved by increasing a ulimit setting. This error is often encountered because the user has created too many processes. The number and kind of running processes should be reviewed using top and ps.
java.lang.OutOfMemoryError: Java heap space : This is the Java Virtual Machine’s way to announce that there is no more room in the virtual machine heap area. You are trying to create a new object, but the amount of memory this newly created structure is about to consume is more than the JVM has in the heap. The fastest way to mitigate this error is to increase the heap via -Xmx parameter but keep in mind that increasing the heap space may only fix it temporarily and there may be underlying issues that need to be investigated further.
java.lang.OutOfMemoryError: GC overhead limit exceeded : By default the JVM is configured to throw this error if you are spending more than 98% of the total time in GC and less than 2% of the heap is recovered after the GC. Changes to GC settings will mitigate this error but keep in mind there may be underlying issues that need to be investigated further.
Useful files for Out of Memory Errors:
-
about.mdfrom support bundle (shows Java Virtual Machine (JVM) configuration) -
verbose GC data (useful for Java heap, metaspace, GC overhead limit exceeded Out of Memory Errors)
-
heap dump (useful for Java heap Out of Memory Errors)
-
heap histogram (useful for Java heap Out of Memory Errors)
-
limits.txtfile from support bundle (useful for Java native Out of Memory Errors) -
nodes.mdfor agent JVM configuration (if the issue occurs there) -
hs_err_pidXXXX.logfile (useful for native Out of Memory Errors)
It’s important to note that when dealing with an Out of Memory Error, increasing the heap space will most likely resolve the issue temporarily, but it may be masking the root cause, and therefore analysis of a thread dump is always a best practice to understand if there are larger issues, many times associated with plugins that will need to be addressed.
High CPU Usage
| Low Java heap space will also cause high CPU usage, as CPU will be doing Garbage Collections constantly to free up memory. Before considering the issue as high CPU, please review Out of Memory error above and make sure the issue is not caused by low memory. |
Most of the time, servers only use a small fraction of their CPU power. When CloudBees CI is performing tasks, CPU usage will rise and/or spike temporarily. Once the CPU intensive process completes, the CPU usage should once again drop down to a lower level.
However, if you are receiving high CPU alerts and/or are experiencing application performance degradation, this may be due to a CloudBees CI process being stuck in an infinite loop or that the service has encountered an unexpected error. If your server is using close to 100% of the CPU, it will constantly have to free up processing power for different processes, which will slow the server down and may render the application unreachable.
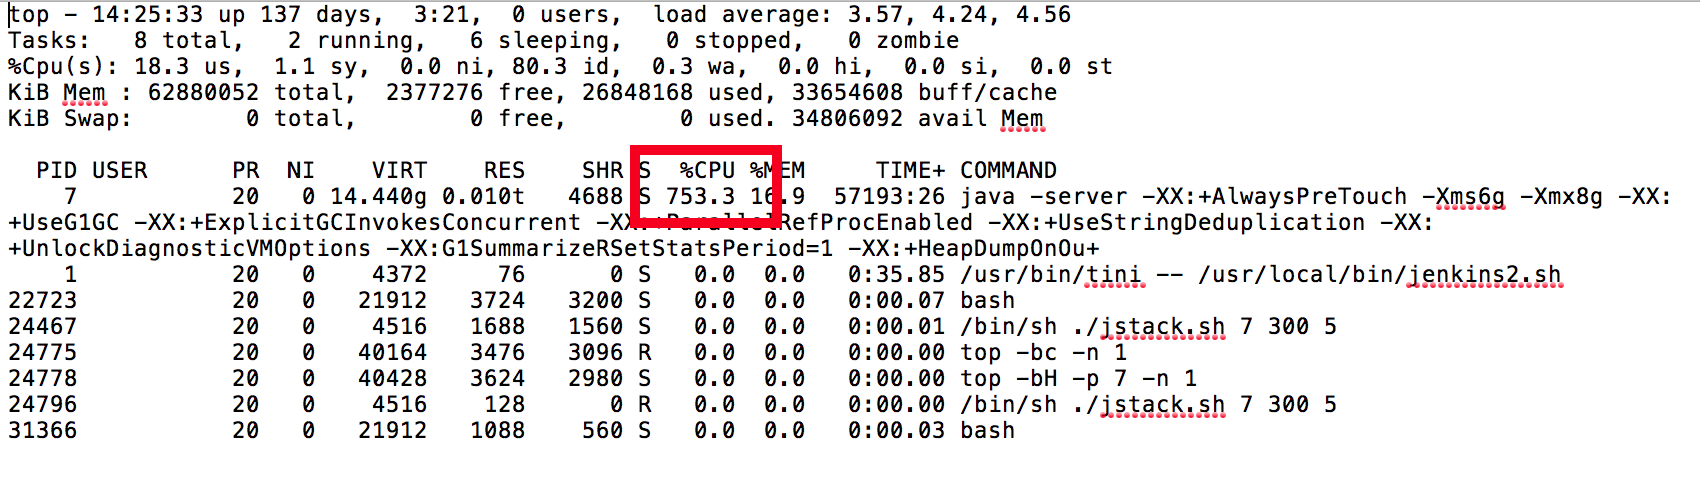
In order to reduce the CPU usage, you first need to determine what processes are taxing your CPU. The best way of diagnosing this is by executing the collectPerformanceData.sh script while the CPU usage is high, as it will deliver the outputs of top and top -H while the issue is occuring so you can see which threads are consuming the most CPU.
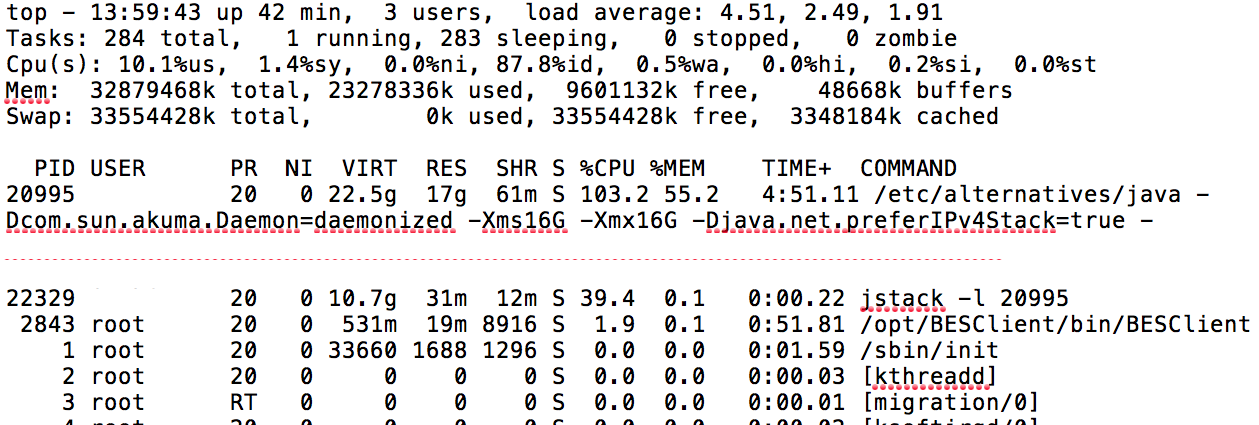
In the following example scenario, we had reports that the CloudBees CI UI has become unresponsive and subsequently ran the collectPerformanceData.sh script during this time to gather data. In the output of top we see that the JVM is consuming a high amount of CPU:
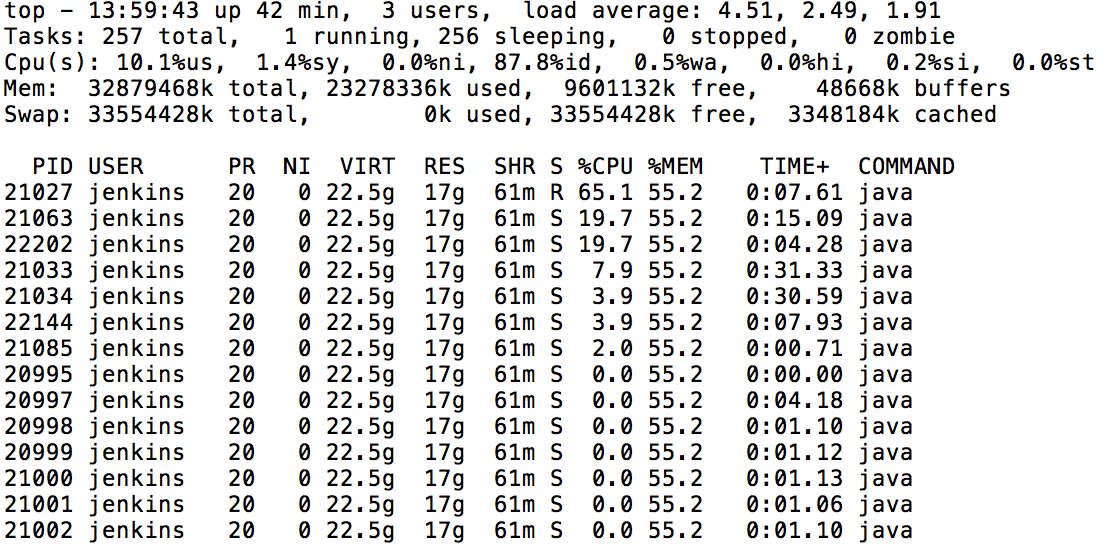
Additionally, we also see in the output of “top -h” that there are a couple of “Hot Threads” or threads that are consuming a large amount of CPU:
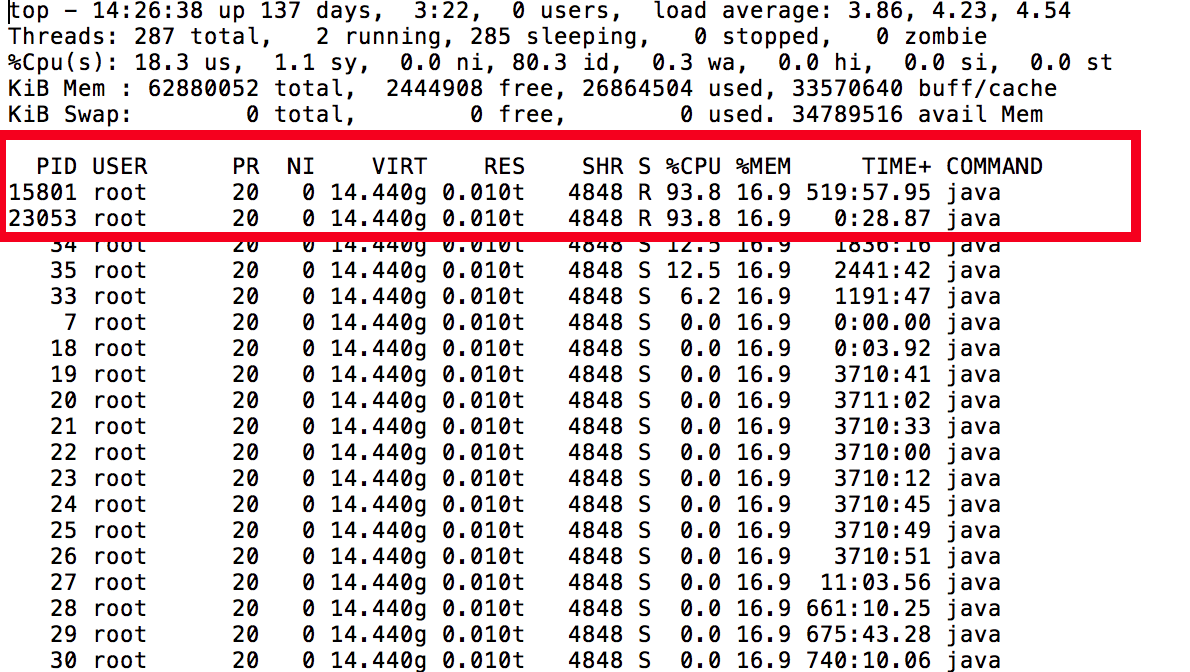
By obtaining the PID’s of these threads, we are able to convert the PID using a binary to hexadecimal converter which will provide us the ThreadID that we can then search for in the output of Jstack.
With the hexadecimal value, we can now search our JStack output for “3DB9” and find the following stacktrace:
"Computer.threadPoolForRemoting [#25] for OperationsCenter2 connection from test/10.62.98.33:43856" #7992 daemon prio=5 os_prio=0 tid=0x00007fa7741bd000 nid=0x3DB9 runnable [0x00007fa6d46da000] java.lang.Thread.State: RUNNABLE at org.mindrot.jbcrypt.BCrypt.key(BCrypt.java:556) at org.mindrot.jbcrypt.BCrypt.crypt_raw(BCrypt.java:629) at org.mindrot.jbcrypt.BCrypt.hashpw(BCrypt.java:692) at org.mindrot.jbcrypt.BCrypt.checkpw(BCrypt.java:763) at hudson.security.HudsonPrivateSecurityRealm$3.isPasswordValid(HudsonPrivateSecurityRealm.java:686) at hudson.security.HudsonPrivateSecurityRealm$4.isPasswordValid(HudsonPrivateSecurityRealm.java:707) at hudson.security.HudsonPrivateSecurityRealm$Details.isPasswordCorrect(HudsonPrivateSecurityRealm.java:517) at hudson.security.HudsonPrivateSecurityRealm.authenticate(HudsonPrivateSecurityRealm.java:184) at sun.reflect.GeneratedMethodAccessor351.invoke(Unknown Source) at sun.reflect.DelegatingMethodAccessorImpl.invoke(DelegatingMethodAccessorImpl.java:43) at java.lang.reflect.Method.invoke(Method.java:498)
The above findings show that BCrypt is causing the CPU usage to spike which implies that it is a CPU intensive operation. In this example, a bug report was created showing the information gathered and a fix was then implemented in a future release of CloudBees CI.
Fastthread.io
Once you have the output of jstack, for faster diagnosis you can use fastthread.io to analyze the thread dump:

Once uploaded, fastthread.io provides an analysis, and typically a prescriptive action can be determined.
Pipeline Hang
Oftentimes the root cause of performance issues can be traced back to poorly constructed pipelines that are not following Pipeline Best Practices. If you are experiencing a hanging pipeline, it is recommended to troubleshoot the issue by providing the Required Data to CloudBees Support(https://support.cloudbees.com/hc/en-us/requests/new).
UI Hang/Unreachable UI
As discussed above, an unresponsive UI is typically a symptom of high CPU utilization and memory consumption. However, other factors can come into play, such as networking latency or bad plugins. The following best practices should be observed when faced with an unresponsive or lagging UI.
Confirm Browser Functionality
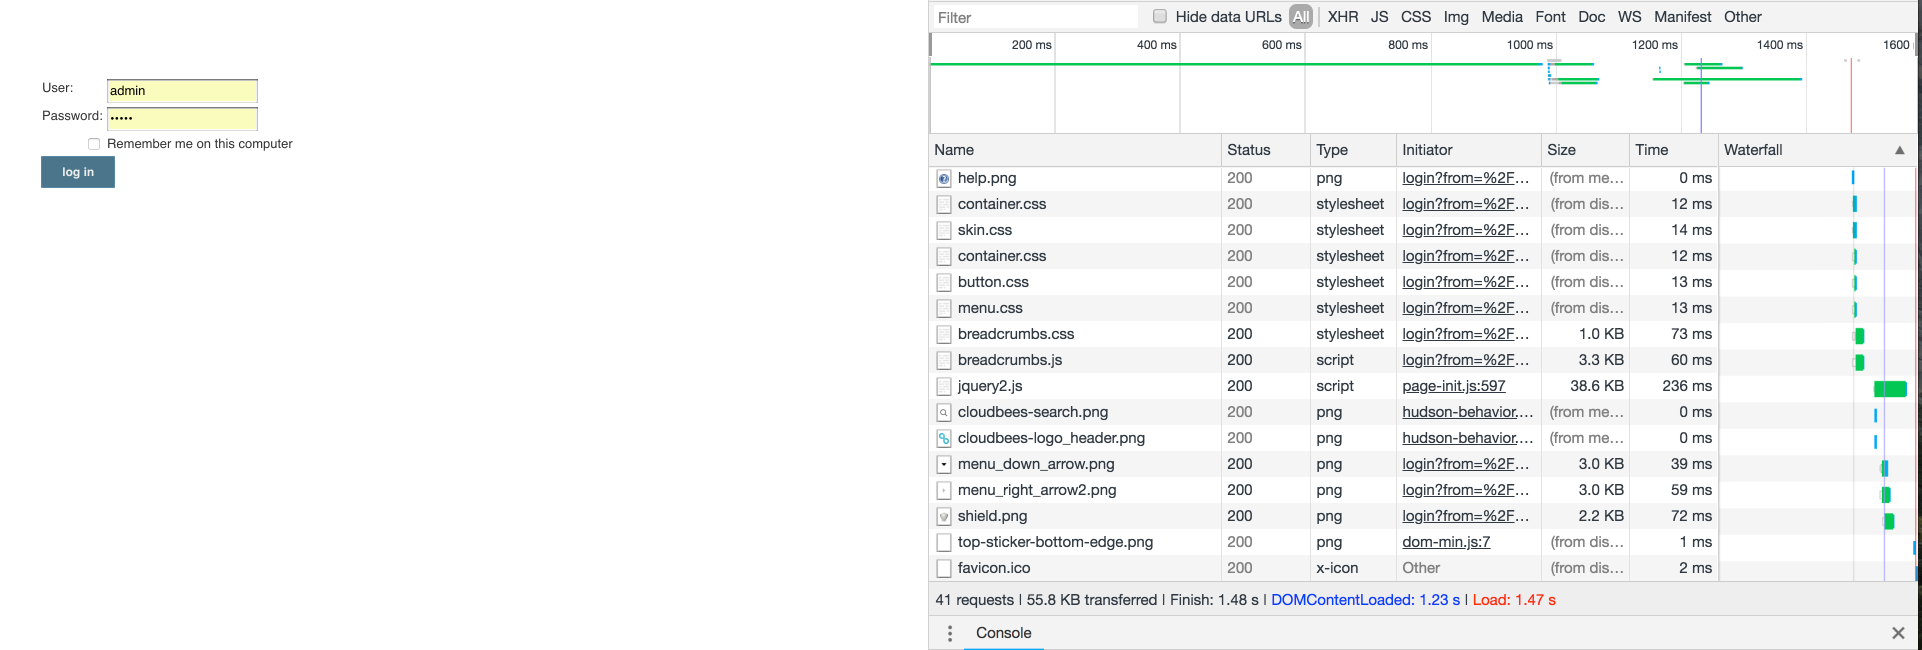
Using Firefox or Google Chrome, ensure that your web browser is up-to-date, clear your cache and cookies, and enable Developer Tools to ensure a proxy or firewall is not blocking your connection to CloudBees CI. The example below shows a stable network connection returning 200 status when attempting to reach the CloudBees CI instance:
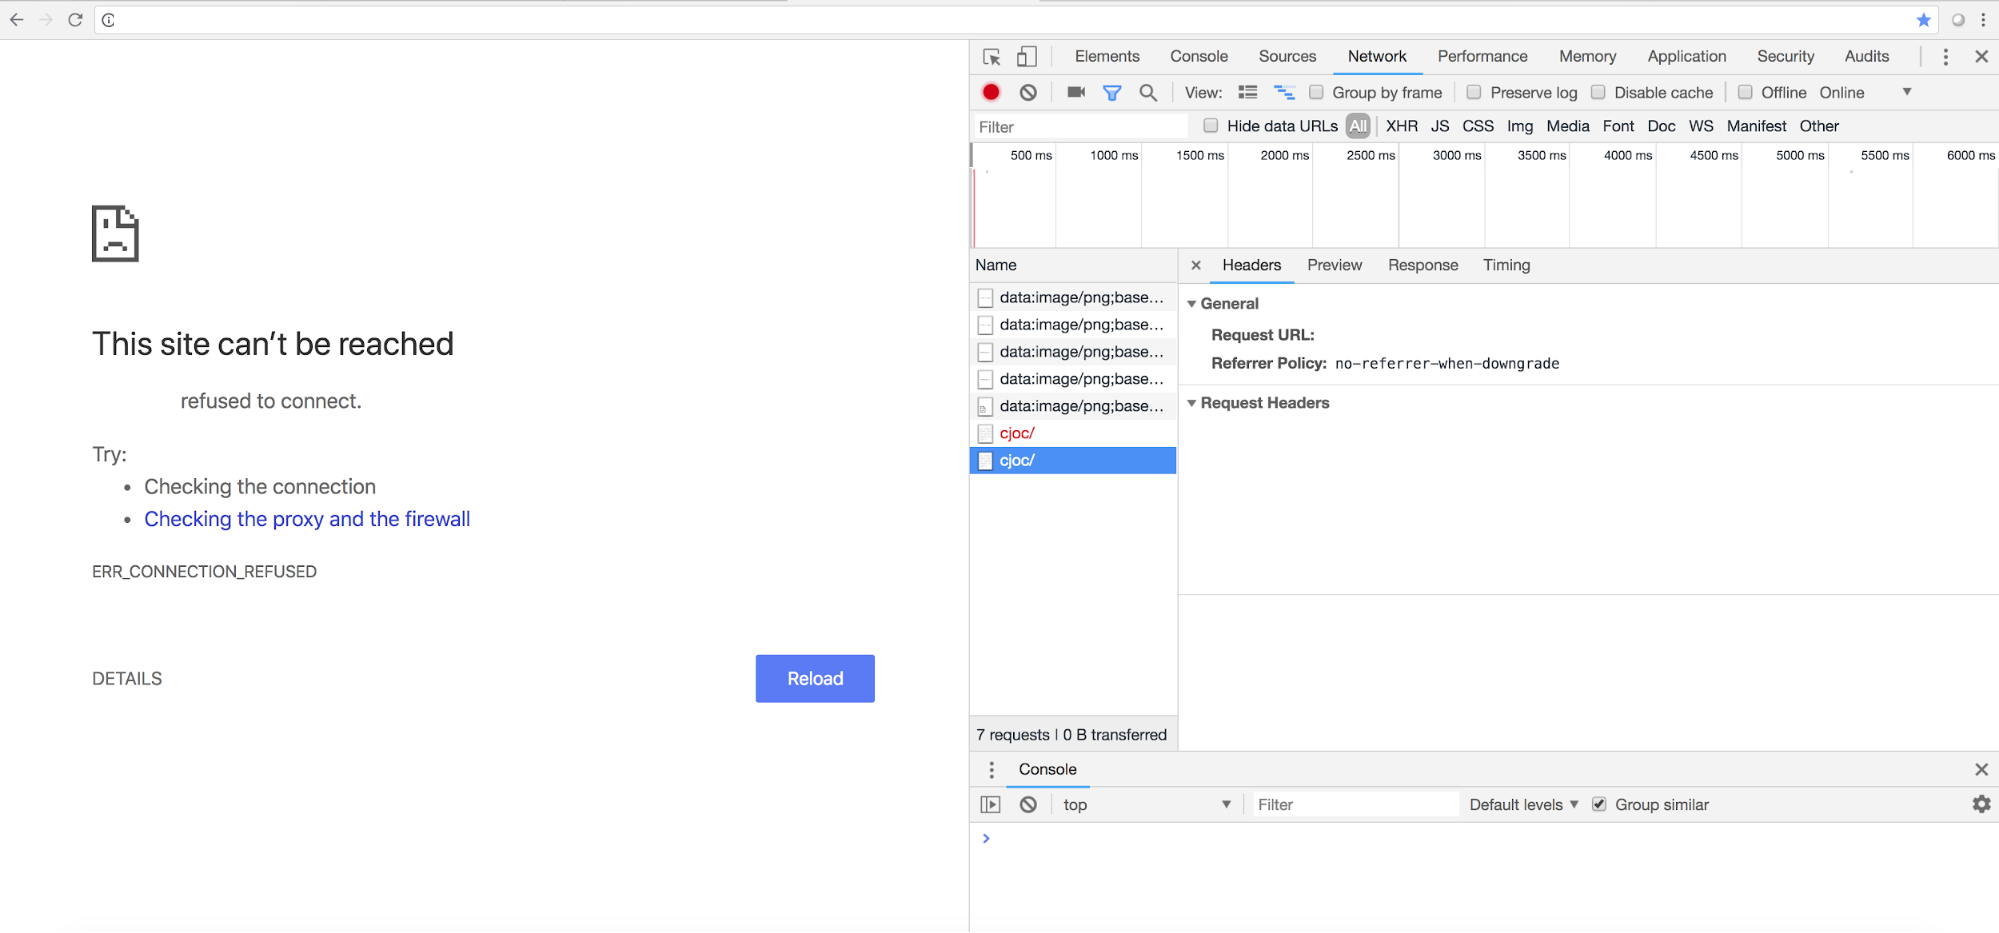
The example below shows a 404 status stating the server could not be reached. This would dictate further investigation as to why the server is unreachable. One way of would be to provide a HAR file to CloudBees Support for investigation. It is advised to obtain the output of collectPerformanceData.sh during this time to determine if high CPU, GC, or Out of Memory errors are present. Additionally, if you see requests that are taking a long response time, you may be experiencing a network-related issue. It is also advised to look over the slow response data of the Support Bundle to troubleshoot further.
Poor GC Performance / GC Thrashing
Very often, the root cause of Out Of Memory errors, as well as UI unavailability, is due to incorrect GC settings, or GC “thrashing”. Frequent garbage collection, due to failure to allocate memory for an object, insufficient free memory, or insufficient contiguous free memory due to memory fragmentation, is referred to as “thrashing”.
All GC events are “Stop The World” events. You want to limit these events to less than a second to ensure that your application does not become unresponsive for your end-users. Very long GC pauses may also result in 404 errors and other instabilities. In extreme cases, very long GC pauses may make it appear that build agents have disconnected or become unresponsive. If the JVM’s garbage collection is not performing as desired, you will need to benchmark CloudBees CI and tune the JVM based on the recommendations from CloudBees Support.
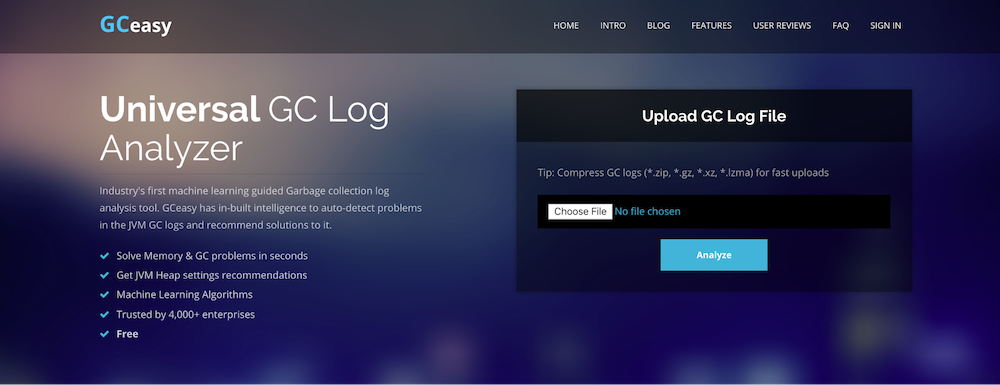
The recommended tuning approach to these parameters is to evaluate the GC logs using GCEasy.io, an online GC log analyzer.
Analysis using gceasy
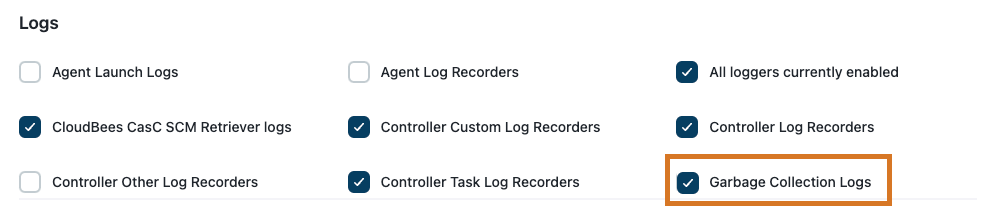
Ensure that GC logs are being captured as part of the aforementioned JVM Arguments, and are included in your support bundle created from CloudBees CI. This is a selectable checkbox in the CloudBees Support section of CloudBees CI:
FAQ
Q: I saw this article that recommended GC setting “X” for better performance… should I use it?
A: Probably not, unless you see poor GC performance with the suggested settings. CloudBees CI has an unusual pattern of memory use, so a lot of common expert tuning options do not apply to it. The recommended settings above are used at many Fortune 500 companies with only minor customizations. However, if you do wish to tinker, please make sure to gather GC logs under real-world use before and after applying the settings so you can compare the deltas.
-
Recommended customization options people may explore, beyond max/min heap size: MetaspaceSize, region size, and on very large systems HugePages (requires OS-level support).
Q: Should I set minimum heap and maximum heap to the same value?
A: You certainly don’t have to, but this gives some modest performance benefits for CloudBees CI-resizing the heap can be somewhat performance: expensive and in some specific cases may trigger higher SYS CPU use. It ensures more consistent performance when the level of load varies widely: heuristics won’t be able to shrink heap sizes in response to quieter periods.
Q: Should I use Concurrent Mark Sweep (CMS) GC for heaps from 2-4 GB?
A: No. Use G1 GC — CMS requires significant expert tuning to perform well for CloudBees CI and has several failure modes (ex: heap fragmentation) that can cause serious stability problems for CloudBees CI. We have seen big issues with some customers trying to use CMS GC.
Need help?
The CloudBees Support team is here to assist you. If you are already have a support subscription, please submit a support request.
If you are experiencing performance issues, you can troubleshoot the issue using the CloudBees Performance Decision Tree for troubleshooting.